2101
Quantitative Parameters of Diffusion Spectrum Imaging: Prediction of Severe Neurologic Deficits at Discharge in Acute Ischemic Stroke Patients1Radiology, Fujian Medical University Union Hospital, Fuzhou, China, 2Neurology, Fujian Medical University Union Hospital, Fuzhou, China, 3Philips Healthcare, Shanghai, China
Synopsis
Keywords: Stroke, Ischemia, Neurologic deficits
This study explores the value of quantitative parameters derived from diffusion spectrum imaging (DSI) in distinguishing between mild (NIHSS score ≤ 5) and severe (NIHSS score > 5) neurologic deficits at discharge in DWI positive acute ischemic stroke (AIS) patients. The method is to compare conventional diffusion and DSI parameters of acute infarction between the two groups. Our research shows DKI_AK, DKI_MKT, DKI_RK, MAP_RTPP and NODDI_ICVF can predict poor neural function outcome at discharge, with NODDI_ICVF demonstrates the highest diagnostic performance. DSI is a promising approach in detecting microstructural brain tissue changes in acute infarction lesion.
Introduction
Acute ischemic stroke (AIS) is a process from cytotoxic edema to vasogenic edema due to cell membrane damage and causes brain injury which leads to neurologic deficits. Most patients expect improved or normal neural functions at discharge while some of them still have severe neurologic deficits. Early identification of AIS patients who are at high risk of poor neural functions at discharge is crucial for prescribing individualized vigorous treatment and rehabilitation during hospitalization. Diffusion weighted imaging (DWI) is the standard model of the diffusion MRI most widely used in detecting early AIS lesion1,2. However, whether DWI characteristics such as acute infarction volume and apparent diffusion coefficient (ADC) value can act as surrogate neural functional outcome markers of AIS patients evoked conflicts3-6. Diffusion spectrum imaging (DSI) is an innovative superior diffusion model to sample and estimate water molecule diffusion7. Advanced models such as diffusion tensor imaging (DTI), diffusion kurtosis imaging (DKI), mean apparent propagator (MAP), and neurite orientation dispersion and density imaging (NODDI) can be derived from DSI to detect microstructural changes in central nervous system8,9. However, whether DSI parameters can be used to forecast neurologic deficits at discharge is unclear. Therefore, the purpose of this study was to investigate whether DSI parameters could identify between mild (NIHSS ≤ 5) and severe (NIHSS score > 5) neurologic deficits at discharge in DWI positive AIS patients.Methods
Forty-five patients who had DWI-positive AIS within 7 days from symptoms onset were enrolled in the study. Patients were divided into two groups, with 39 cases in mild neurologic deficits (MND) group at discharge and 6 cases in severe neurologic deficits (SND) group at discharge (Table 1). Structural and diffusion MRI was acquired from a 3T scanner (Ingenia CX, Philips Healthcare, the Netherlands) with a 32-channel head coil (Table 2). Four DTI-based parameters (DTI_AD, DTI_FA, DTI_MD and DTI_RD), five DKI-based parameters (DKI_AK, DKI_FA, DKI_MK, DKI_MKT and DKI_RK), five MAP-based parameters (MAP_MSD, MAP_QIV, MAP_RTOP, MAP_RTAP, and MAP_RTPP), and three NODDI-based parameters (NODDI_ICVF, NODDI_ISOVF, and NODDI_ODI) were calculated from DSI data using an in-house developed software ISMS (IntelliSpace Medicina Scientia) based on the open-source tool DIPY(https://dipy.org). Image registration between DWI and DSI was performed using SPM12 software (https://www.fil.ion.ucl.ac.uk/spm/software/spm12/). ROIs were delineated slice by slice along the edge of hyperintense area on registered DWI (b=1000 s/mm2) images (Figure 1) using ITK-SNAP software (http://www.itksnap.org/pmwiki/pmwiki.php). For each participant, ADC value of ROIs was also computed and ROIs were copied to registered DSI to calculate 17 diffusion parameters using FAE software10.DWI and DSI parameters between the two groups were compared using Mann-Whitney U test (Table 3). ROC curves were constructed to assess the corresponding diagnostic performance and the AUC values were obtained. The cutoff value, sensitivity and specificity were calculated and expressed by using their two-sided 95% CIs. A two-sided P-value of less than 0.05 is considered statistical significance.Results
There were no statistically significant differences in clinical information between the two groups (all P>0.05). As shown in Table 3, DKI_AK, DKI_MKT, DKI_RK, MAP_RTPP and NODDI_ICVF were significantly higher in the SND group compared with those of the MND group (P=0.016, 0.021, 0.034, 0.017, 0.014, respectively). In contrast, acute infarction volume, ADC value and other DSI parameters did not differ significantly between the two groups. NODDI_ICVF demonstrated the highest diagnostic performance in ROC curves for distinguishing between MND and SND groups (AUC [95% CI] = 0.808 [0.650; 0.965], specificity = 74.36% and sensitivity = 83.33%). DKI_AK, DKI_MKT, DKI_RK, MAP_RTPP also showed high diagnostic performance, as shown in Table 4 and Figure 2.Discussion
The study indicated that DWI positive lesion volume and ADC value did not differ between MND and SND groups which was consistent with previous studies4-6. DSI provides superior diffusion parameters to evaluate water molecule movement in brain tissue7 which enables detection of microscopic tissue changes from injury to repair. DKI evaluates water molecule diffusion in a non-gaussian model11,12 different from DWI and DTI. DKI_AK and DKI_RK calculate water diffusion along and perpendicular to the main diffusion direction respectively13. Severe neurologic deficits may imply heavy disruption of blood-brain barrier and increased vascular permeability which might result in high DKI_AK and DKI_RK. DKI_MKT obtains similar maps to DKI_MK but contains information only about kurtosis tensor14 which might be more sensitive to non-gaussian motion and explain the different results between DKI_MK and DKI_MKT. MAP and NODDI models describe more complex microstructures using specific model assumptions15,16 with MAP_RTPP reflecting the restrictive barriers in the axial orientation16 and NODDI_ICVF representing water molecule diffusion within axons and cells. Higher MAP_RTPP and NODDI_ICVF indicated heavy cytotoxic edema that might cause unrecoverable brain damage and ultimately lead to poor neural function outcomes. NODDI_ICVF demonstrated the highest diagnostic performance might also be due to its characteristic to detect molecule motion within axons and cells.Conclusion
DSI quantitative parameters outperformed conventional DWI characteristics in forecast poor neural function at discharge. DKI_AK, DKI_MKT, DKI_RK, MAP_RTPP and NODDI_ICVF were higher in the SND group than in the MND group with NODDI_ICVF demonstrating the highest diagnostic performance. DSI may be a useful technique in the prediction of longitudinal neural function outcomes in AIS patient with acute infarction.Acknowledgements
No acknowledgement found.References
1. Albers GW. Diffusion-weighted MRI for evaluation of acute stroke. Neurology. 1998;51(3 Suppl 3):S47-S49.
2. van Everdingen KJ, van der Grond J, Kappelle LJ, et al. Diffusion-weighted magnetic resonance imaging in acute stroke. Stroke. 1998;29(9):1783-1790.
3. Engelter ST, Provenzale JM, Petrella JR, et al. Infarct volume on apparent diffusion coefficient maps correlates with length of stay and outcome after middle cerebral artery stroke. Cerebrovasc Dis. 2003;15(3):188-191.
4. Engelter ST, Wetzel SG, Radue EW, et al. The clinical significance of diffusion-weighted MR imaging in infratentorial strokes. Neurology. 2004;62(4):574-580.
5.Wardlaw JM, Keir SL, Bastin ME, et al. Is diffusion imaging appearance an independent predictor of outcome after ischemic stroke? Neurology. 2002;59(9):1381-1387.
6. Hand PJ, Wardlaw JM, Rivers CS, et al. MR diffusion-weighted imaging and outcome prediction after ischemic stroke. Neurology. 2006;66(8):1159-1163.
7. Varela-Mattatall GE, Koch A, Stirnberg R, et al. Comparison of q-Space Reconstruction Methods for Undersampled Diffusion Spectrum Imaging Data. Magn Reson Med Sci. 2020;19(2):108-118.
8. Liang L, Lin H, Lin F, et al. Quantitative visual pathway abnormalities predict visual field defects in patients with pituitary adenomas: a diffusion spectrum imaging study. Eur Radiol. 2021;31(11):8187-8196.
9. Wan X, Xiao Y, Liu Z. Diffusion spectrum imaging of patients with middle cerebral artery stenosis [published online ahead of print, 2022 Aug 5]. Neuroimage Clin. 2022;36:103133.
10. Song Y, Zhang J, Zhang YD, et al. FeAture Explorer (FAE): A tool for developing and comparing radiomics models. PLoS One. 2020;15(8):e0237587.
11. Jensen JH, Helpern JA, Ramani A, et al. Diffusional kurtosis imaging: the quantification of non-gaussian water diffusion by means of magnetic resonance imaging. Magn Reson Med. 2005;53(6):1432-1440.
12. Jensen JH, Helpern JA. MRI quantification of non-Gaussian water diffusion by kurtosis analysis. NMR Biomed. 2010;23(7):698-710.
13. Cheung MM, Hui ES, Chan KC, et al. Does diffusion kurtosis imaging lead to better neural tissue characterization? A rodent brain maturation study. Neuroimage. 2009;45(2):386-392.
14. Hansen B, Lund TE, Sangill R, et al. Experimentally and computationally fast method for estimation of a mean kurtosis [published correction appears in Magn Reson Med. 2014 Jun;71(6):2250. Magn Reson Med. 2013;69(6):1754-1760.
15. Hutchinson EB, Avram AV, Irfanoglu MO, et al. Analysis of the effects of noise, DWI sampling, and value of assumed parameters in diffusion MRI models. Magn Reson Med. 2017;78(5):1767-1780.
16. Özarslan E, Koay CG, Shepherd TM, et al. Mean apparent propagator (MAP) MRI: a novel diffusion imaging method for mapping tissue microstructure. Neuroimage. 2013;78:16-32.
Figures
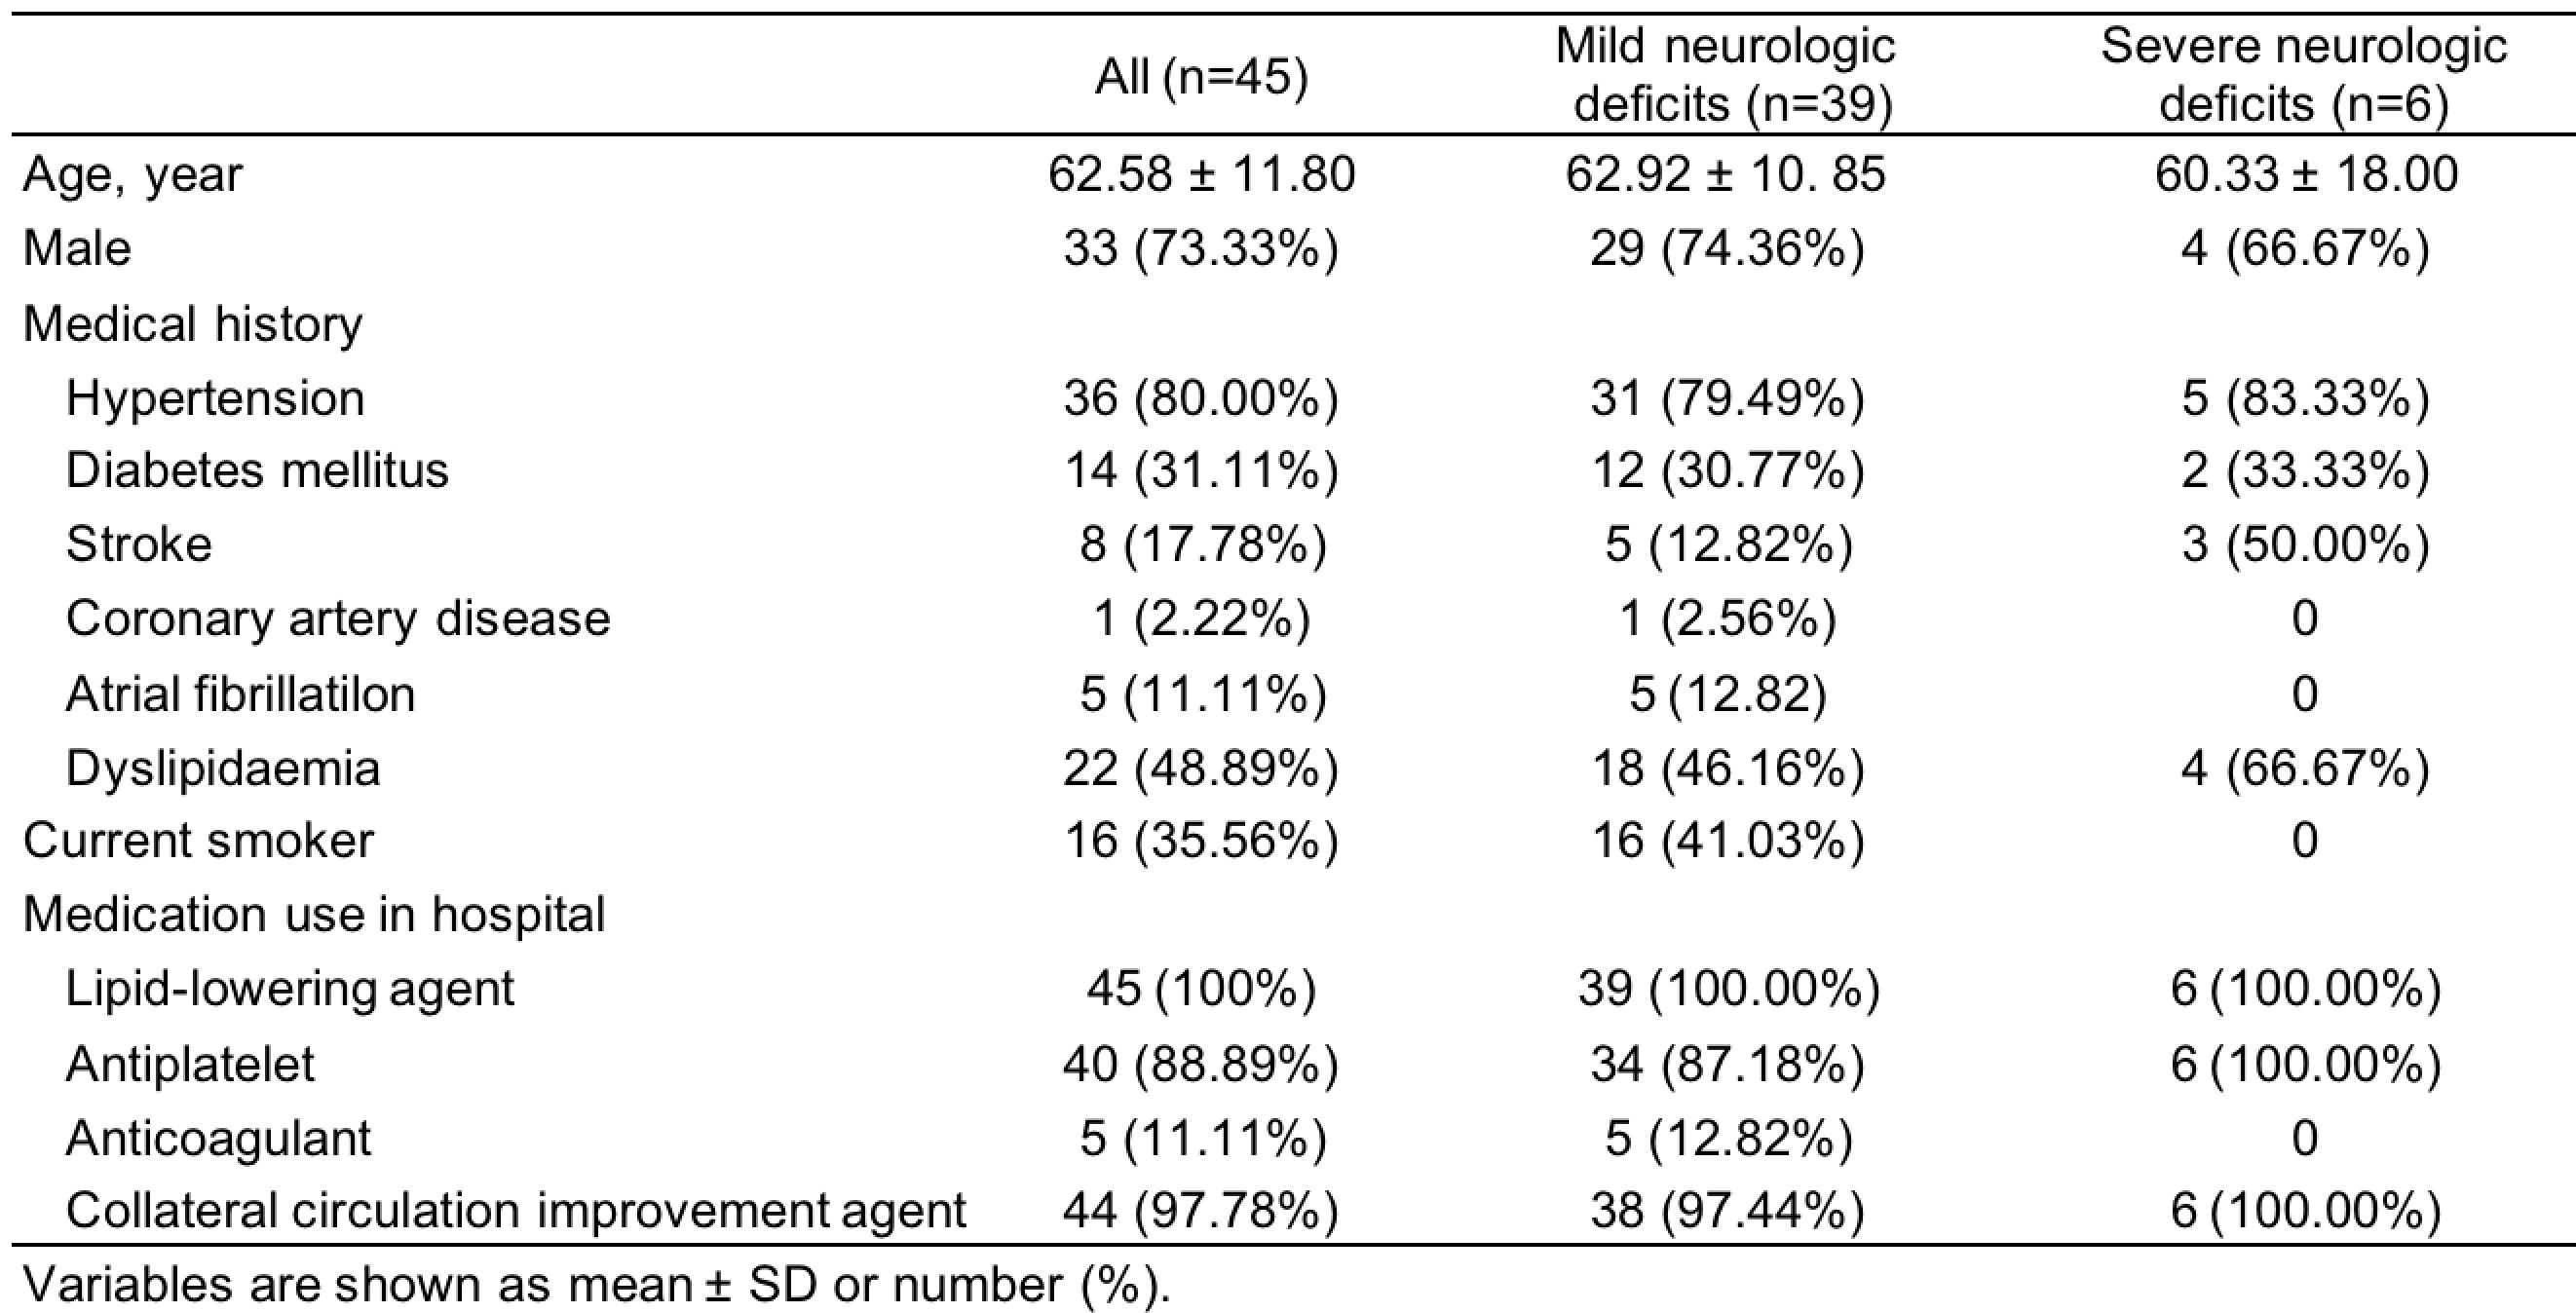
Table1 Study population characteristics
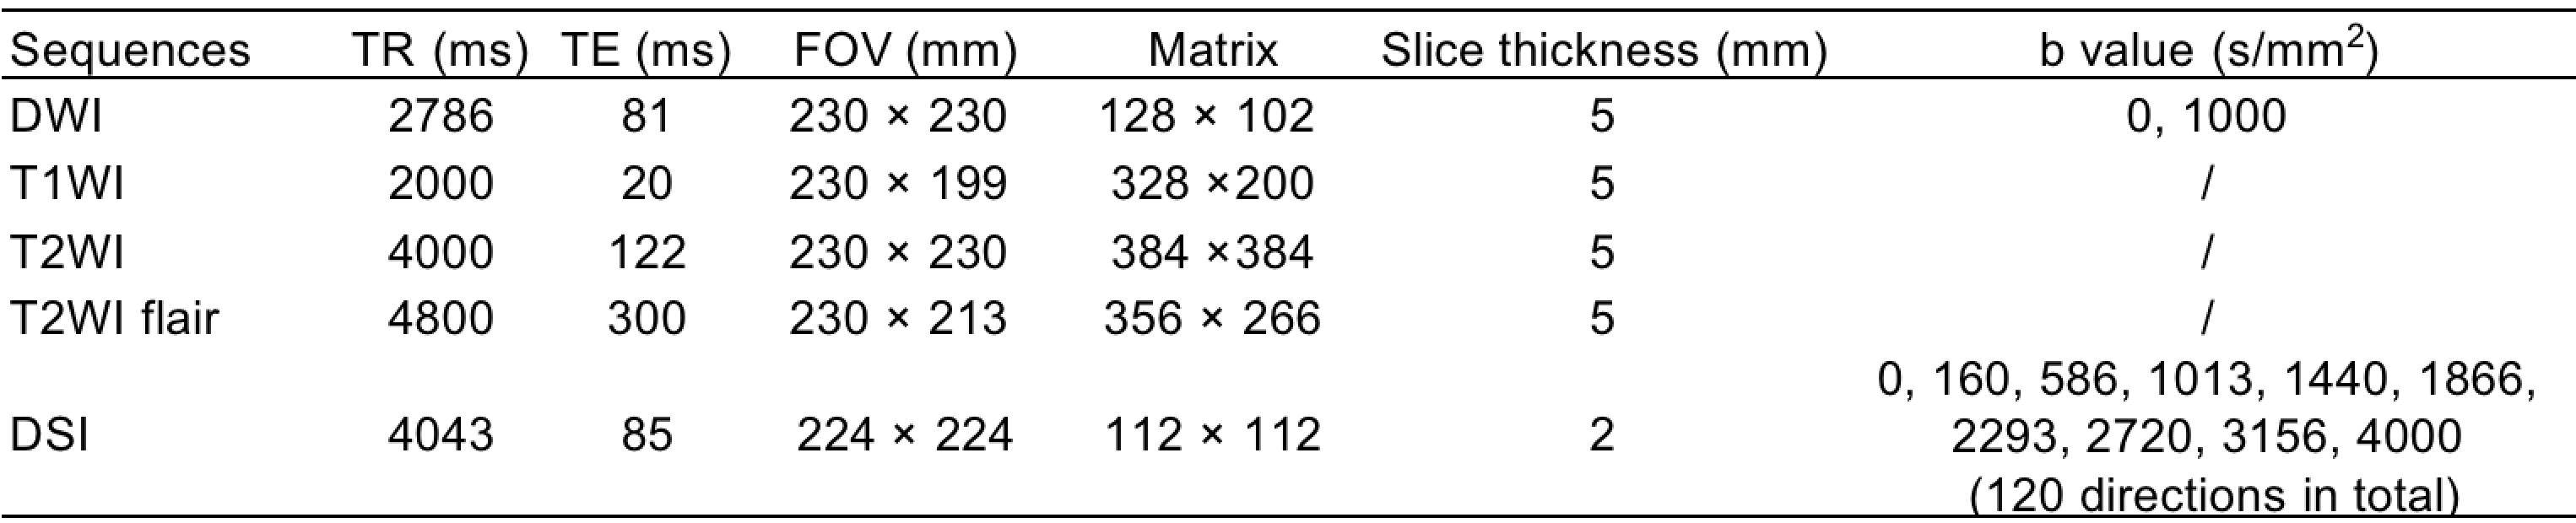
Table 2 Structural and diffusion MRI sequences
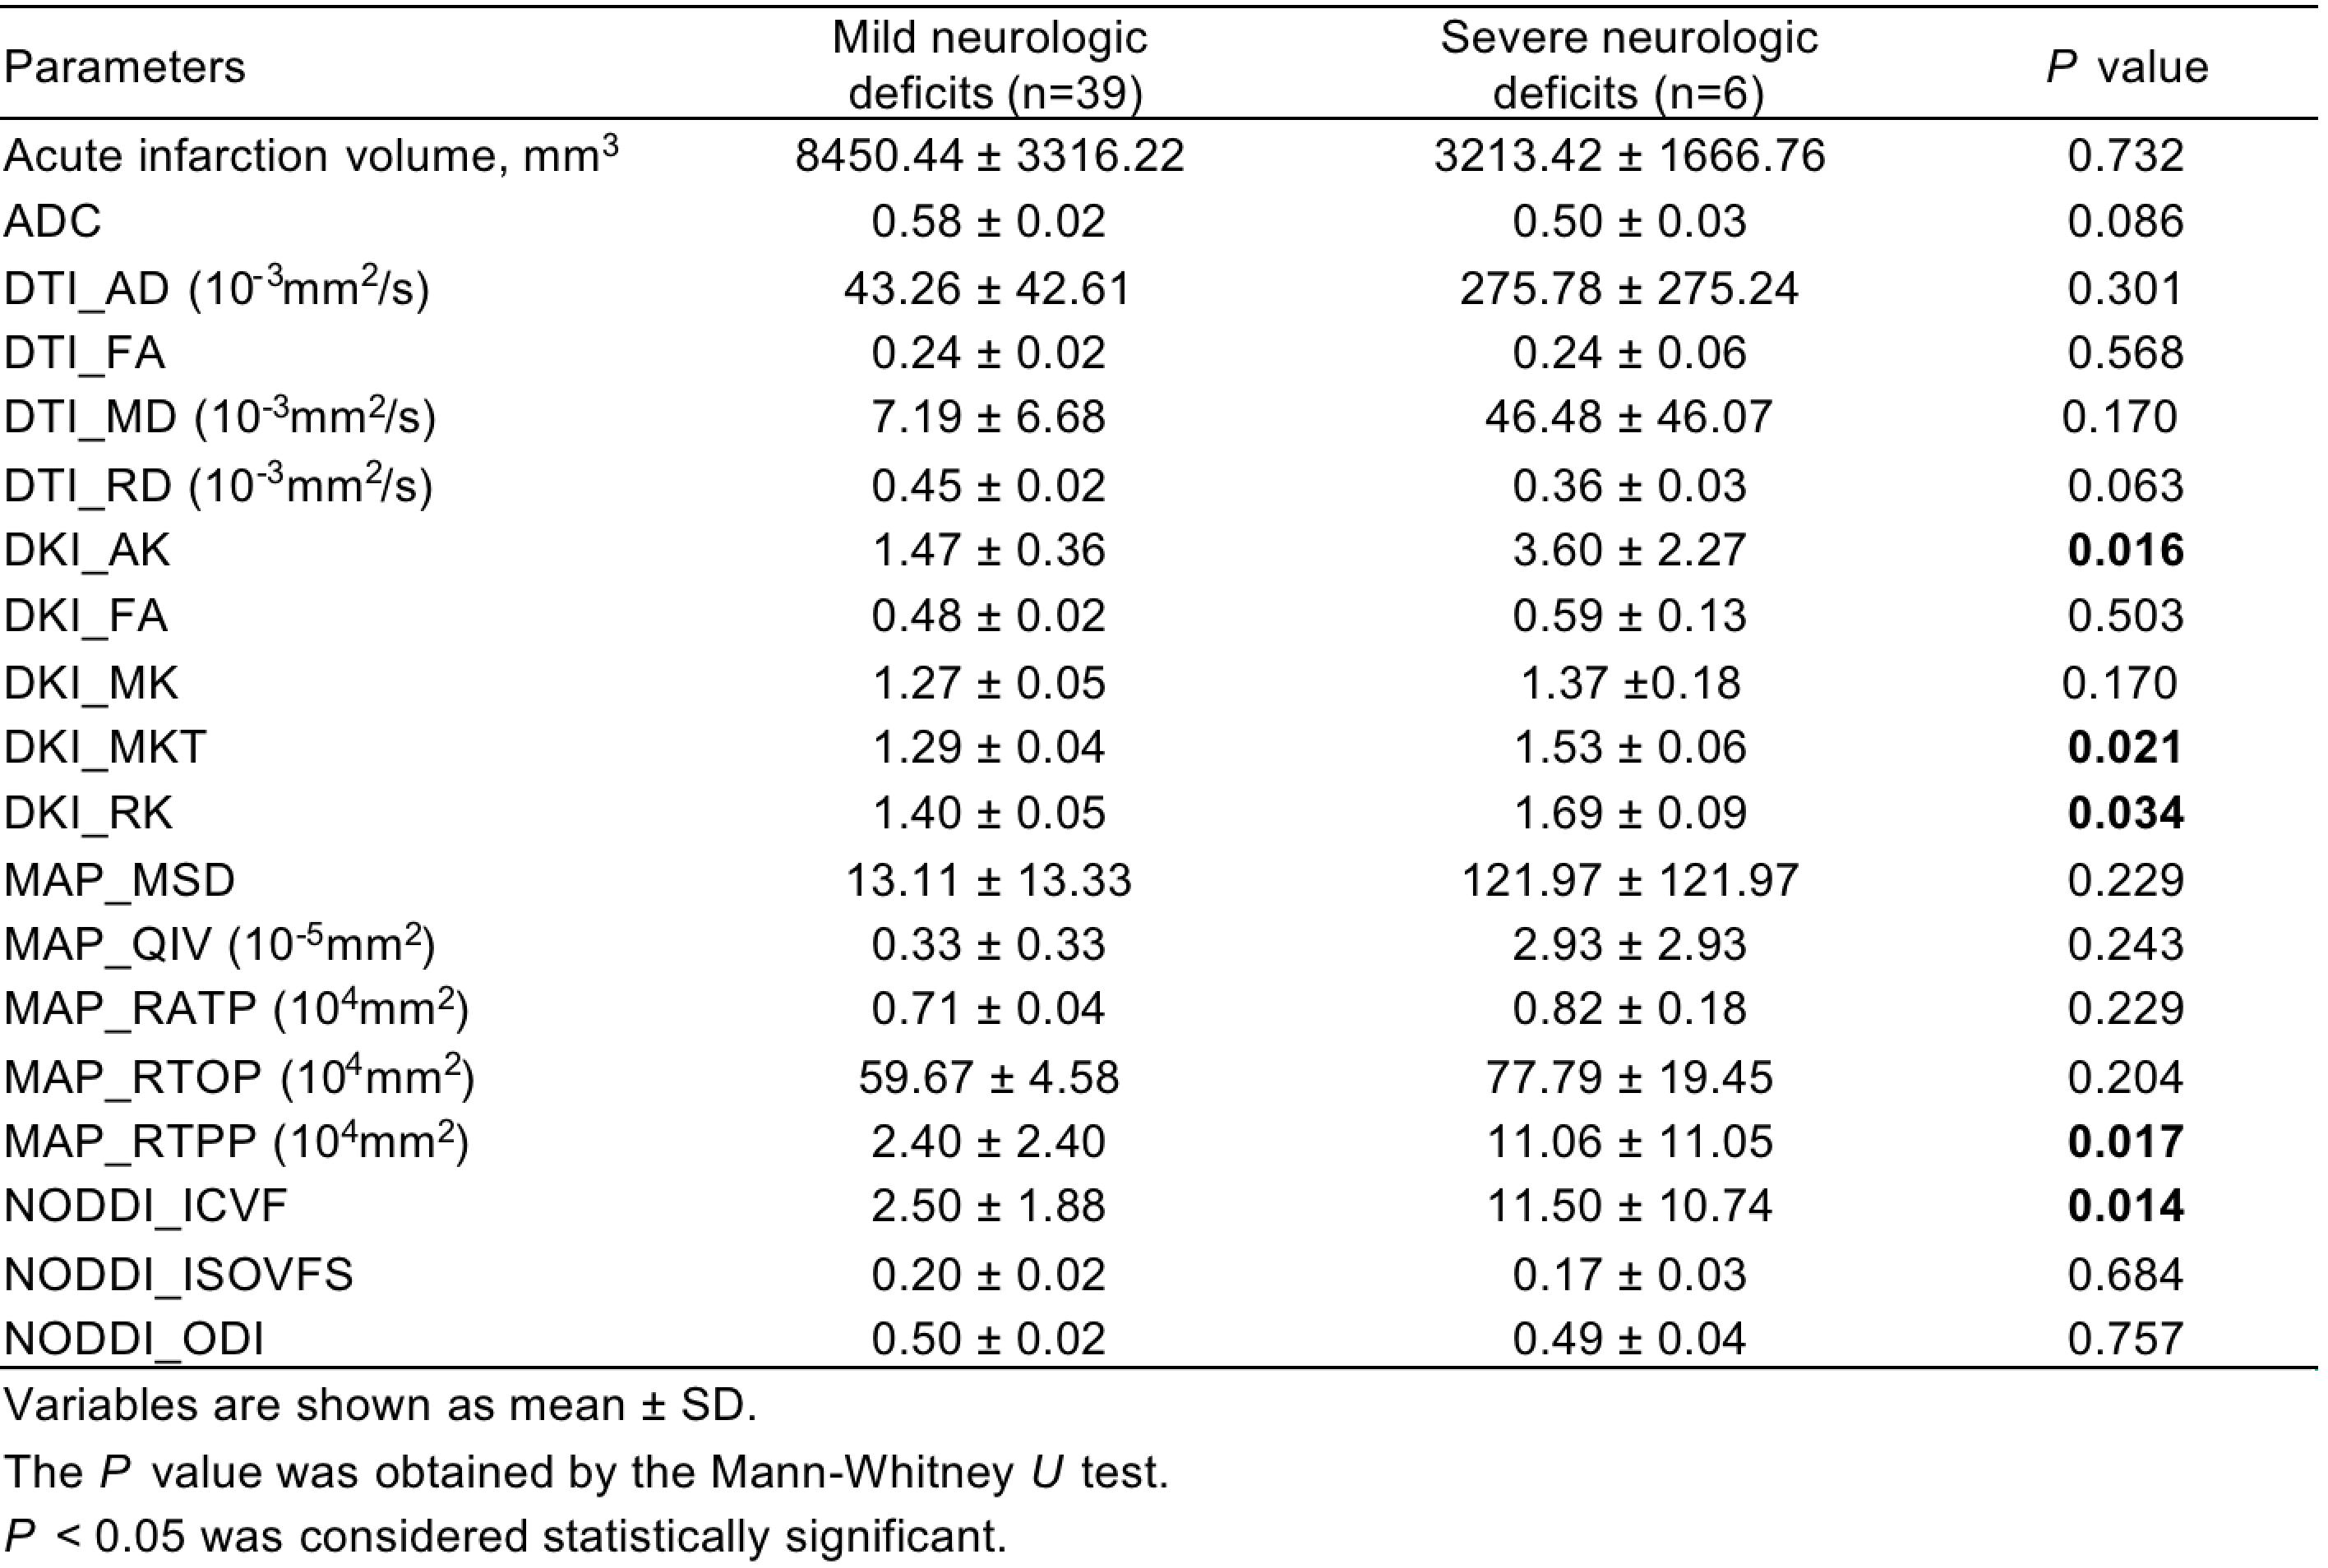
Table 3 Prediction of neurologic deficits at discharge using diffusion weighted imaging and diffusion spectrum imaging quantitative parameters
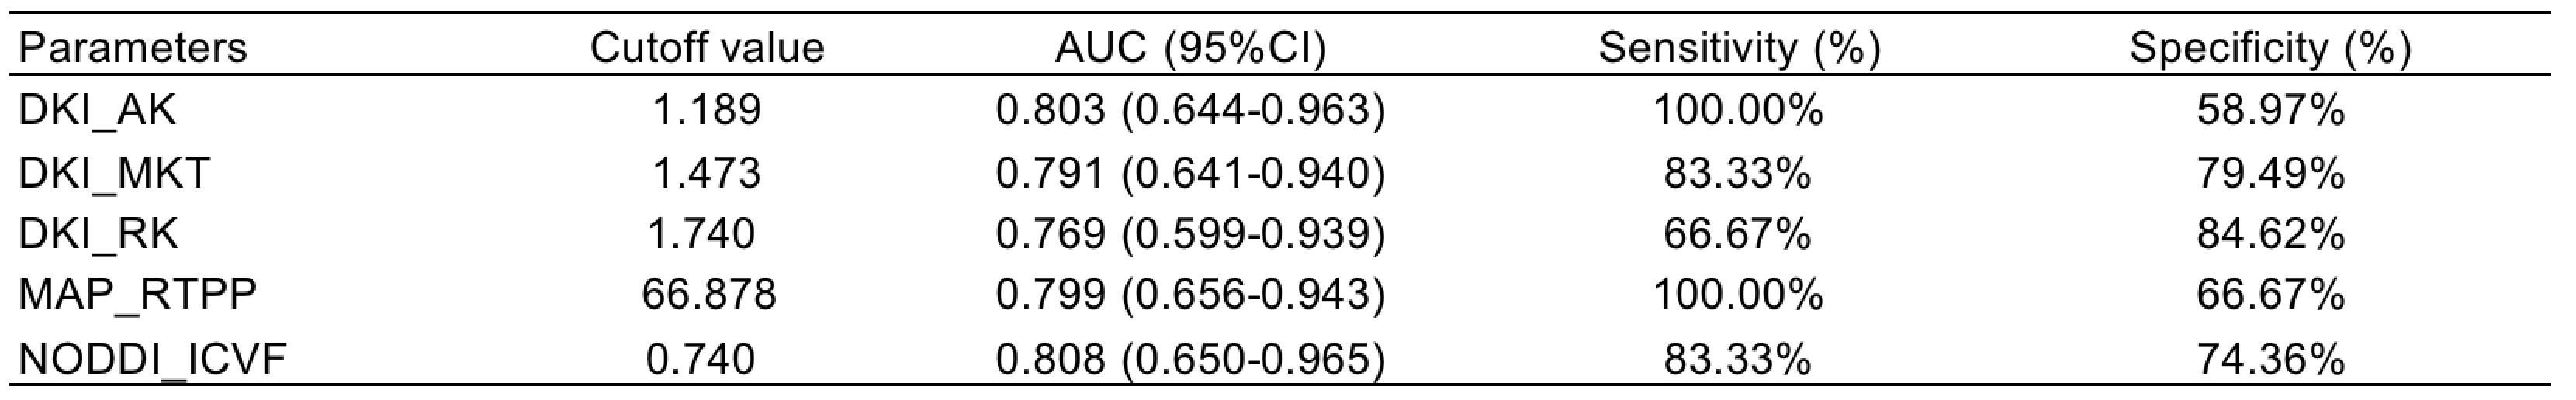
Table 4 Diagnostic performance of diffusion spectrum imaging quantitative parameters in predicting neural functions at discharge
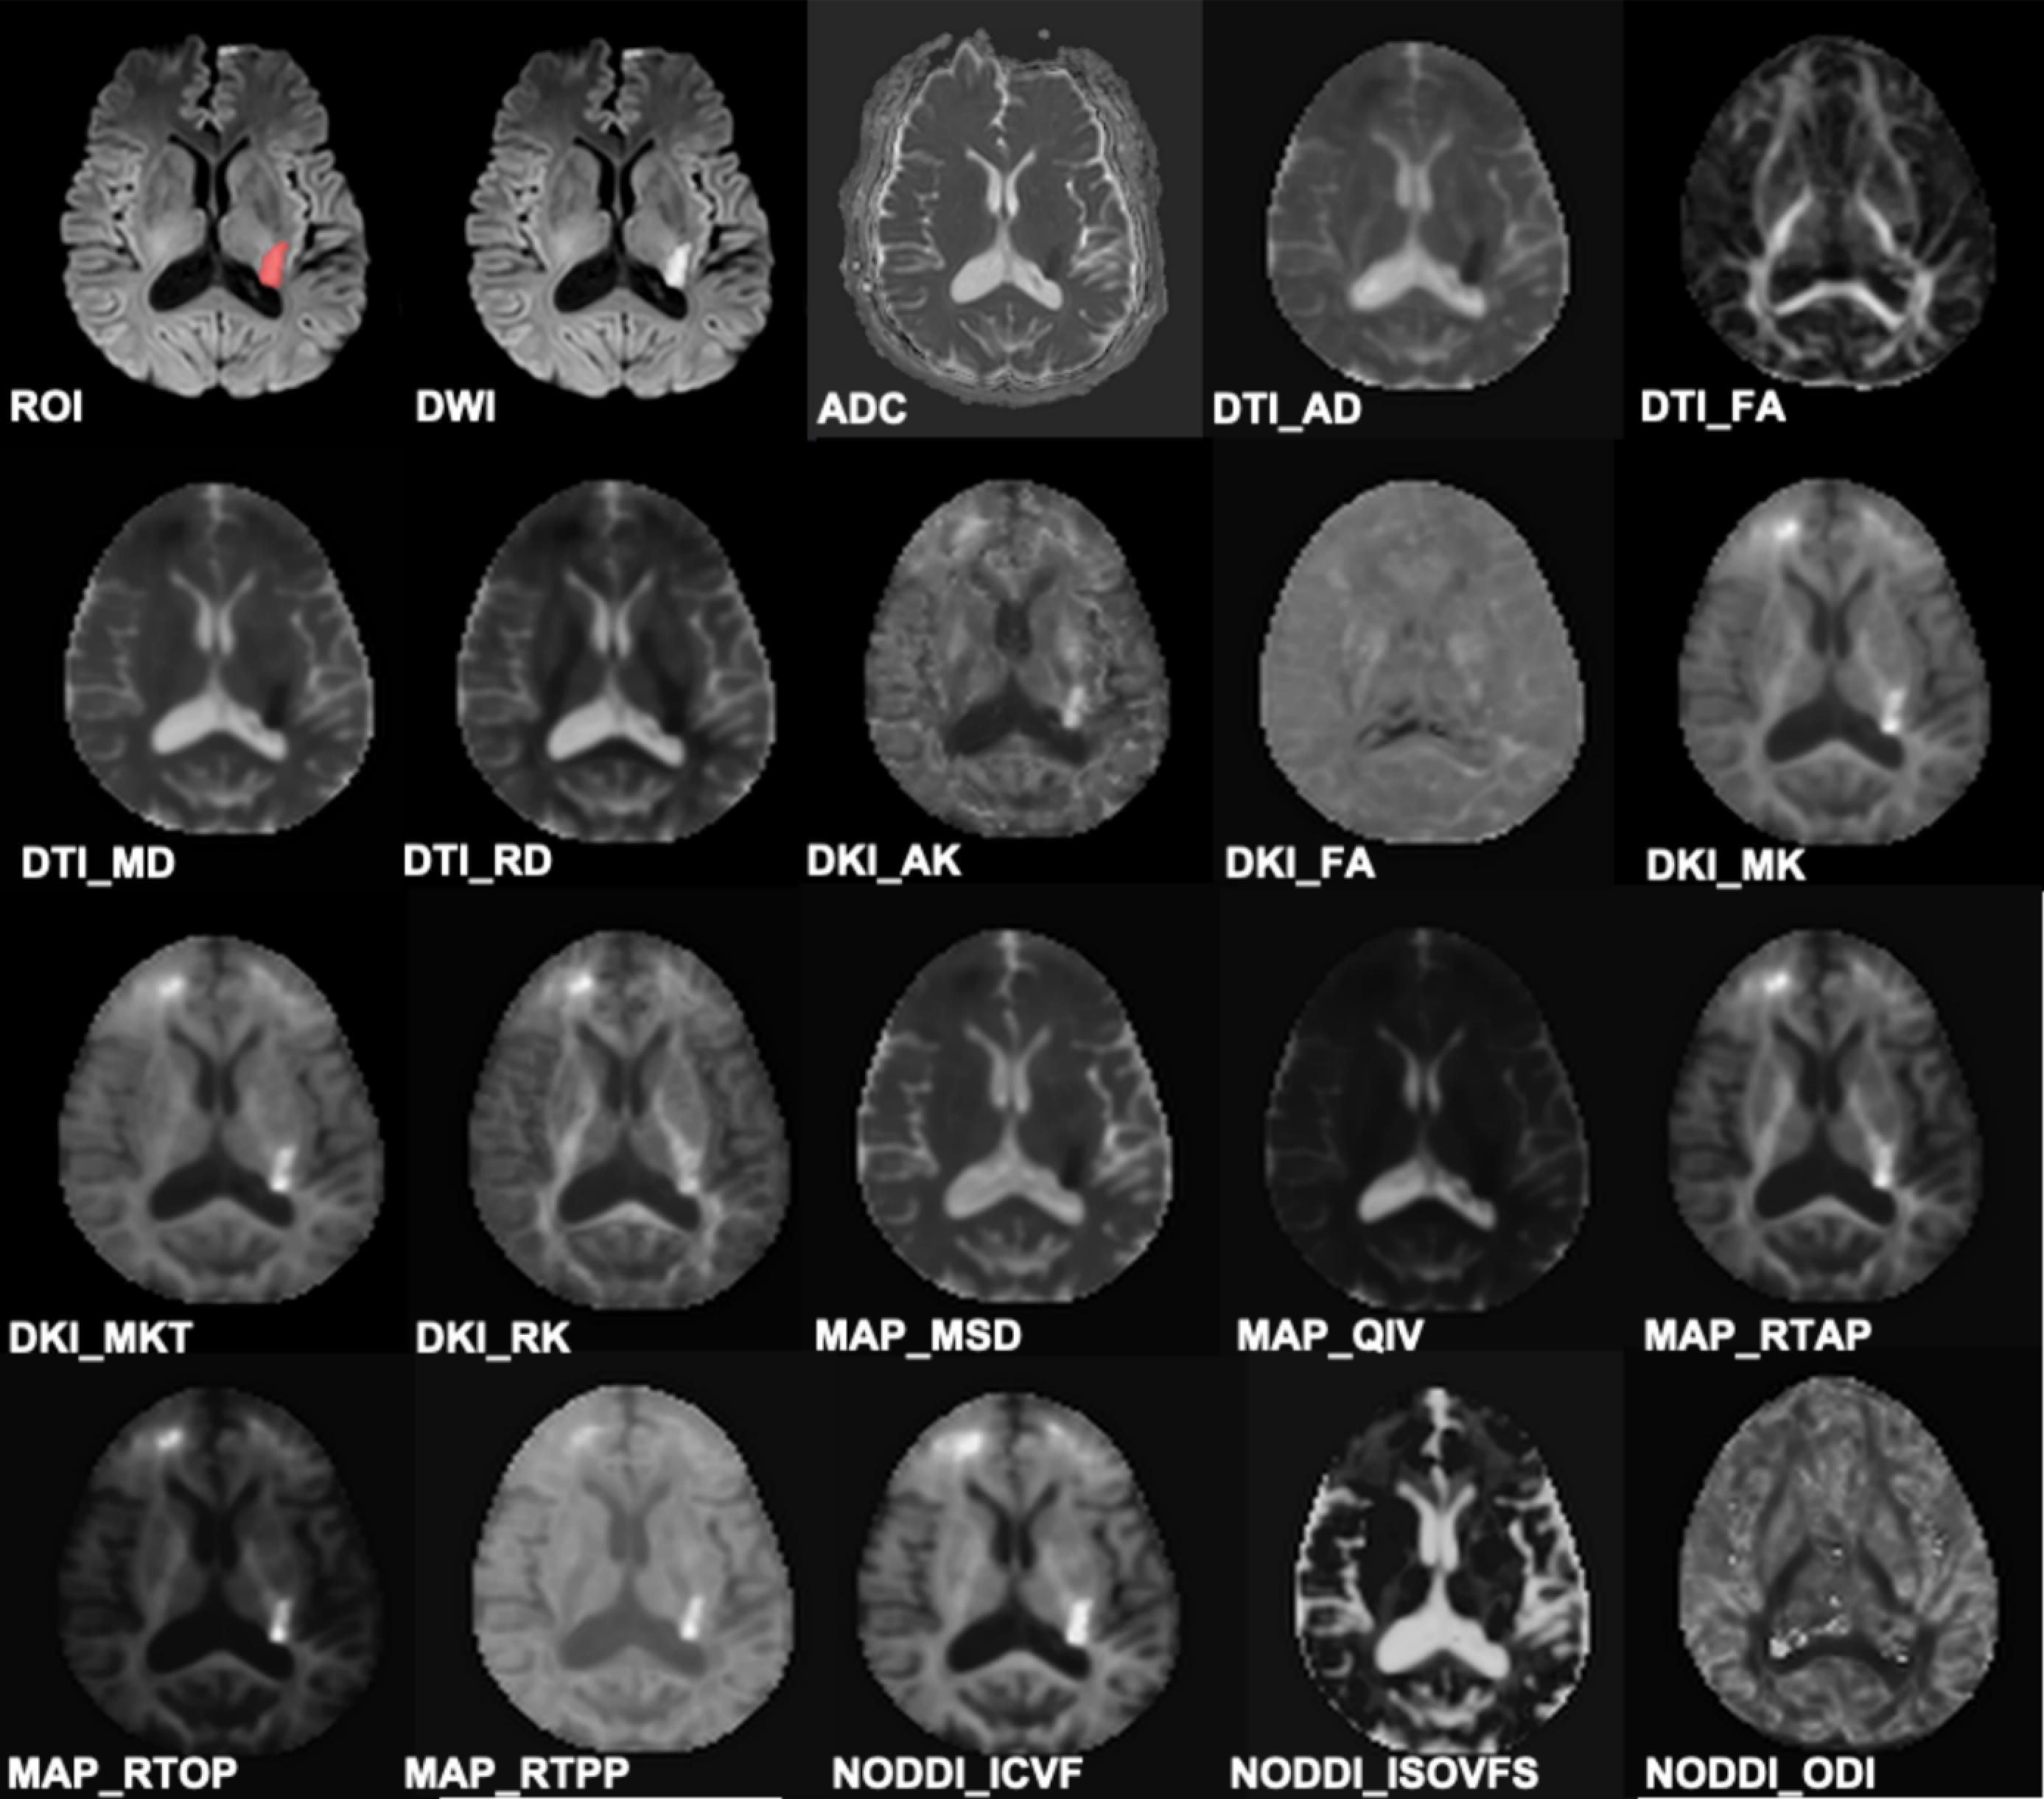
Figure 1 An example of ROI delineation. A 68-year-old male with confirmed acute ischemic stroke within 2 days.
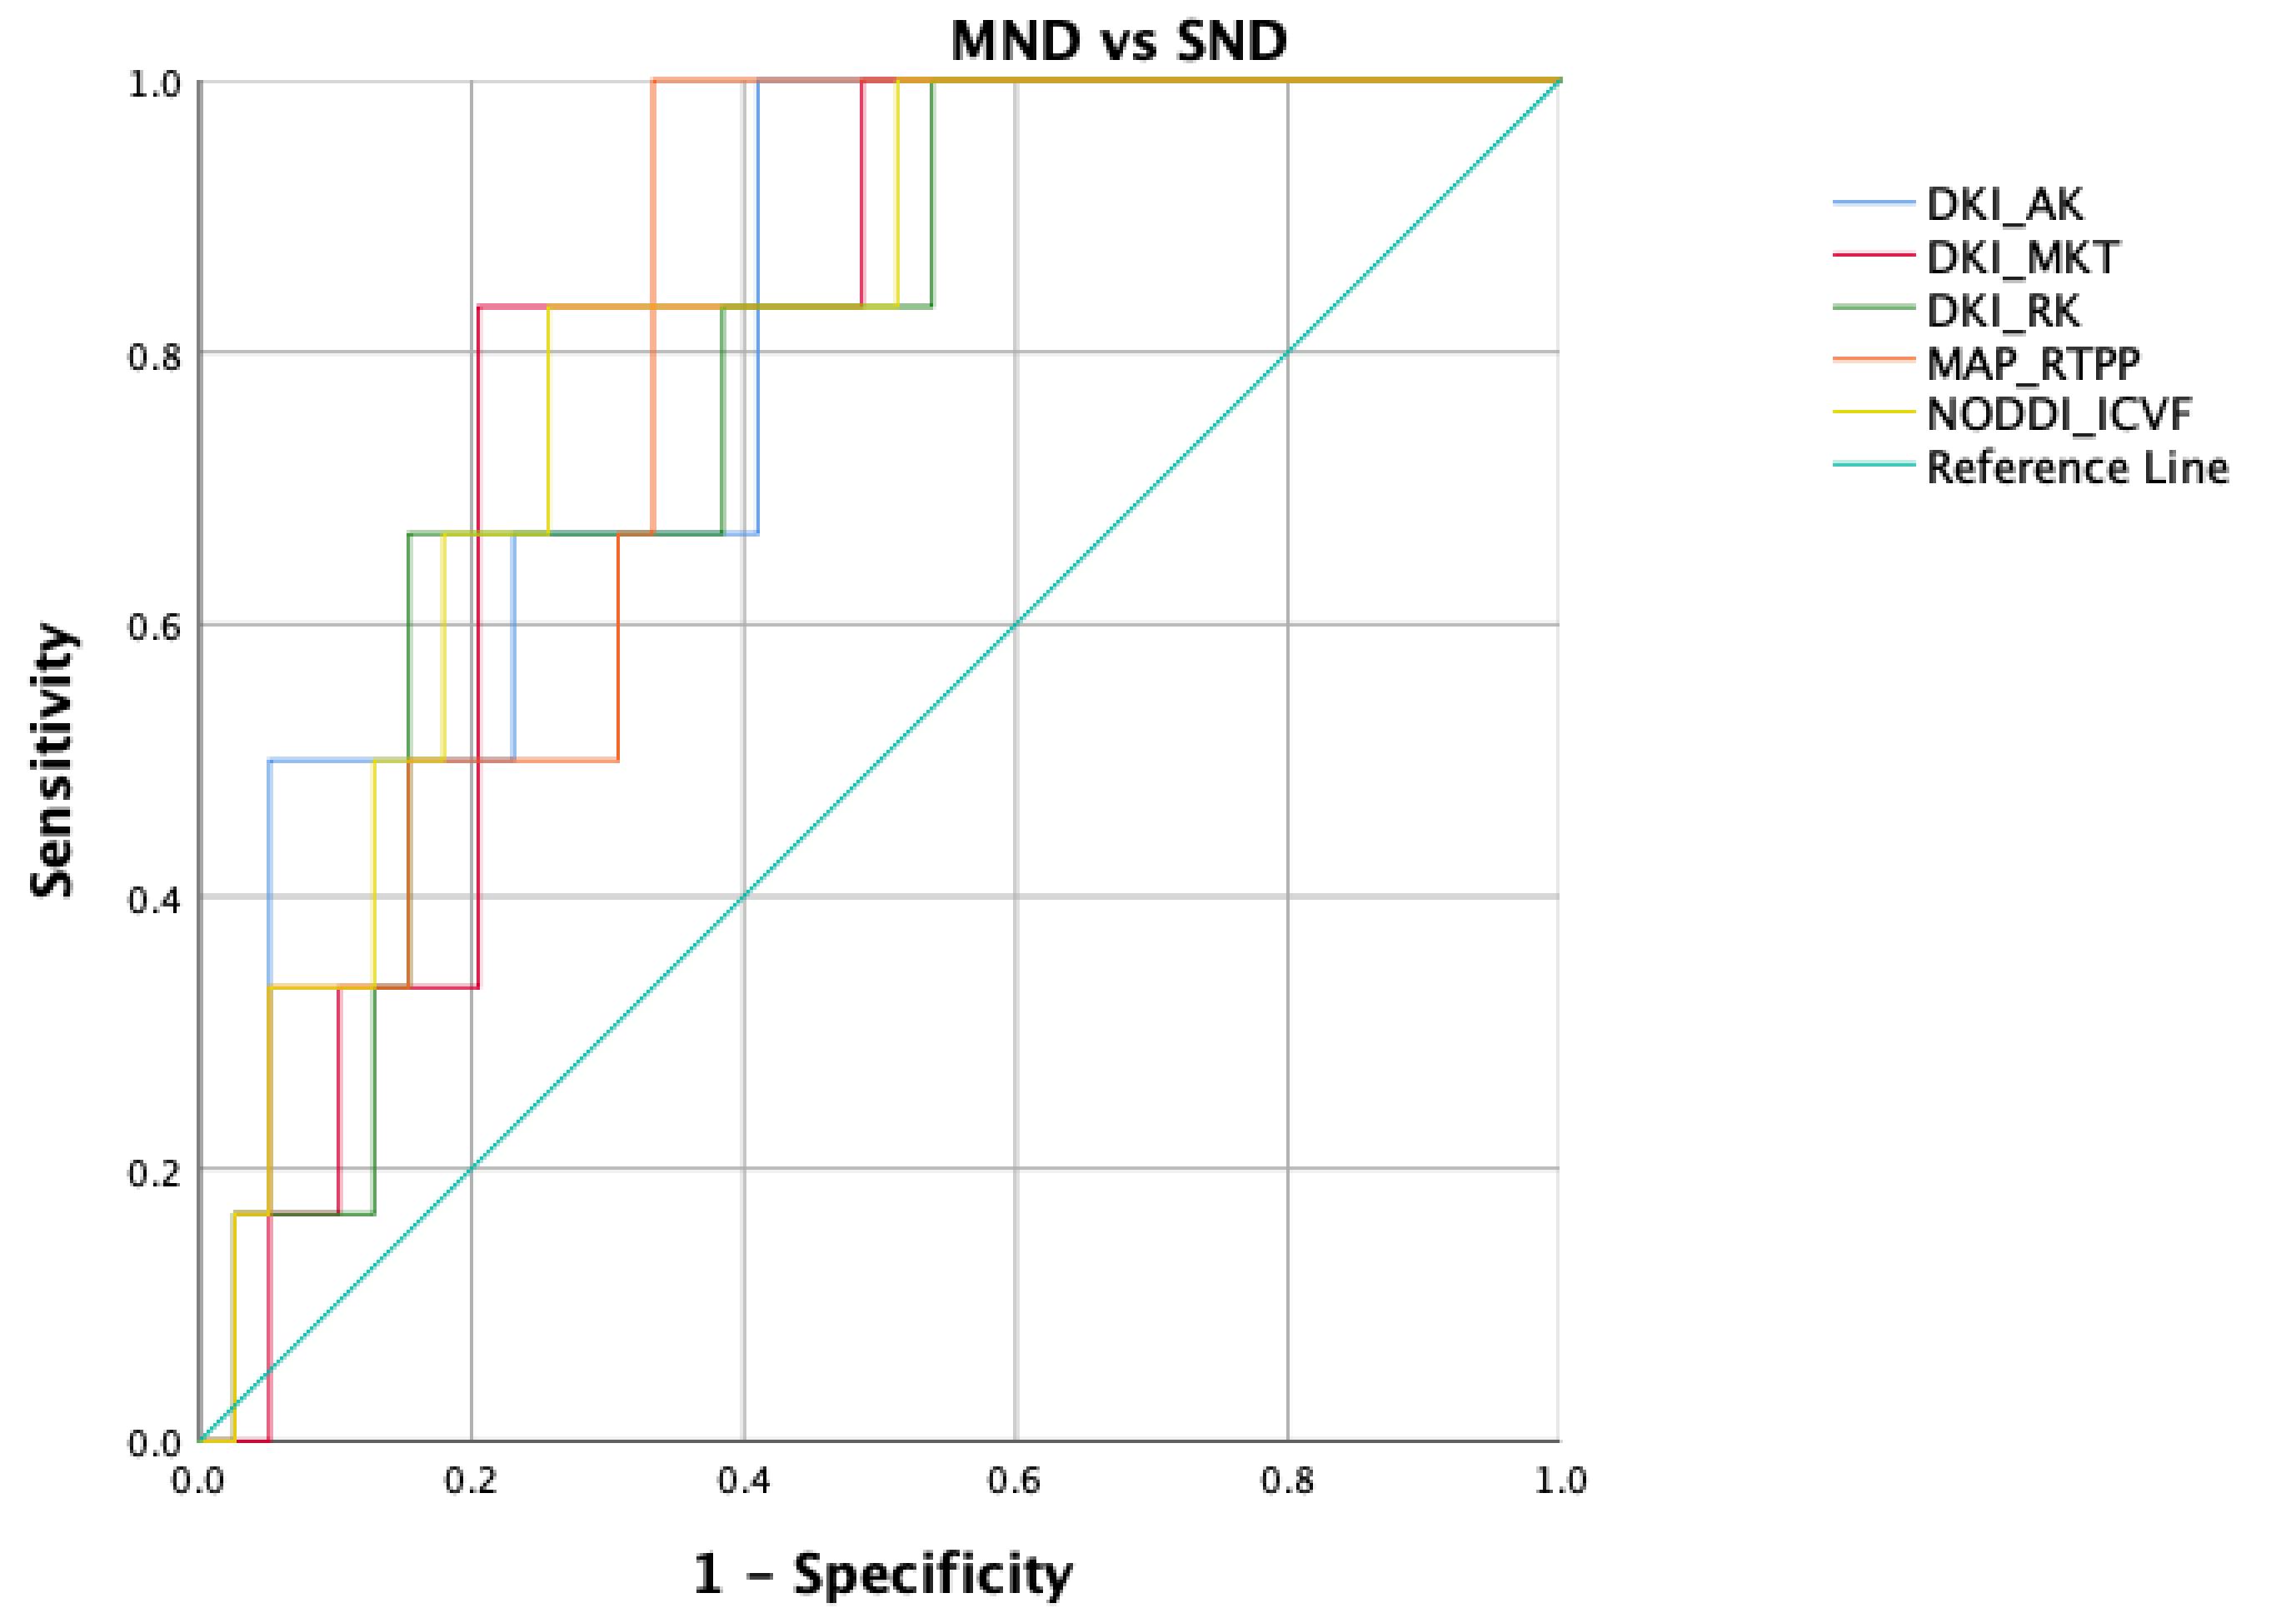
Figure 2 ROC curves of diffusion spectrum imaging quantitative parameters in predicting neural functions at discharge