2099
Progressive Lactic Acidosis is Associated with Infarct Growth Volume in Acute Ischemic Stroke: A Longitudinal 3D MRSI Study1School of Biomedical Engineering, Shanghai Jiao Tong University, Shanghai, China, 2Radiology Department, The Fifth People's Hospital of Shanghai, Fudan University, Shanghai, China, 3Beckman Institute for Advanced Science and Technology, University of Illinois at Urbana-Champaign, Urbana, IL, United States, 4Department of Electrical and Computer Engineering, University of Illinois at Urbana-Champaign, Urbana, IL, United States, 5National Center for Supercomputing Applications, University of Illinois at Urbana-Champaign, Urbana, IL, United States, 6Siemens Medical Solutions USA, Inc., Urbana, IL, United States, 7Department of Biomedical Engineering, Case Western Reserve University, Cleveland, OH, United States
Synopsis
Keywords: Stroke, Spectroscopy
Imaging lactic acidosis is of significance for injury assessment in acute stroke. In this study, we investigated the progression of lactate, along with the concomitant changes in N-acetylaspartate and creatine concentrations, and its relationship to infarct growth using high-resolution MRSI data acquired from a longitudinal cohort of 42 ischemic stroke patients. The results showed that the progression in lactate level was predictive of infarct growth volume from acute to subacute stroke. Our study might provide a useful biomarker for lactic acidosis and tissue injury assessment in ischemic stroke.
Introduction
Lactic acidosis, the excessive lactic acid accumulation due to the shortage in oxygen supply, serves as a sensitive metabolic indicator of injury progression in cerebral ischemia.1-3 During acute ischemic stroke, lactic acidosis could be significantly exacerbated by the recurrence of spreading depolarization, directly leading to excessive cellular Ca2+ accumulation, cytotoxic edema, and tissue damage.4-6 Therefore, imaging brain tissue lactic acidosis is of great importance to identify the penumbra zone and to guide therapeutic intervention in acute stroke.7,8 Previous work has evaluated the tissue lactic acidosis using optical imaging, PET, amide proton transfer (APT) MRI, and hyperpolarized [1-13C]pyruvate MRI .9-12 But their clinical applications have been limited due to the requirements for fluorescence or radioactive tracers,9,10 low spatial resolution,11 long scan time,9-11 or lack of specificity for tissue acidosis.12 Recently, a fast high-resolution 3D 1H-MRSI technology, known as SPICE (SPectroscopic Imaging by exploiting spatiospectral CorrElation), has enabled whole-brain mapping of multiple neurometabolites at 2×3×3 mm3 nominal resolution in an 8-min scan on acute stroke patients. From the SPICE data, lactate could be quantitatively measured as a biomarker of anaerobic glycolysis and tissue acidosis.13-17 In this study, we used SPICE to investigate the progression of lactic acidosis, along with the concomitant changes in N-acetylaspartate (NAA) and creatine (Cr) concentrations, as indexes for tissue neuronal/glial cell loss, and their relationship with infarct growth from acute to subacute ischemic stroke in a cohort of 42 ischemic stroke patients.Methods
Forty-two acute ischemic stroke patients were recruited within 48 h of symptom onset. Twenty-three patients received follow-up MRI scanning at 4 - 12 days after the initial scan. The study was approved by the IRB of Shanghai Fifth People’s Hospital, China. The image acquisition protocols included high-resolution 3D MRSI using SPICE sequence (2.0 × 3.0 × 3.0 mm3, FOV = 240 × 240 × 72 mm3, TE/TR = 1.6/160 ms), diffusion-weighted imaging (DWI) ( 1.3 × 1.3 × 4.0 mm3, FOV = 240 mm, b = 0 and b = 1000 s/mm2, TE/TR = 64/5200 ms), T2-weighted Fluid-Attenuated Inversion Recovery (FLAIR) imaging (0.5 × 0.5 × 2 mm3, FOV = 240 mm, TE/TR = 89/9000 ms), and 3D MPRAGE imaging (1.0 × 1.0 × 1.0 mm3, FOV = 256 mm, TE/TR = 2.13/2400 ms, TI = 1100 ms). All the scans were performed on a 3T scanner (MAGNETOM Skyra, Siemens Healthcare, Germany).Lactate, NAA, and Cr maps were obtained using the standard processing pipeline of SPICE.14-17 The lactate signal was successfully separated from the macromolecular signals via a subspace-based approach, exploiting their different spectral characteristics.16,18 Regions of interest (ROIs) include infarct core, i.e., tissue present in both the acute lesion and the final infarct, and infarct growth, i.e., tissue present in the final infarct but not in the acute lesion.13 The neurometabolites concentrations were normalized over the sum of contralateral NAA, Cr and Cho signals for statistical analysis. Paired t-tests were used to compare the biomarkers from acute to subacute stages. The changes in neurometabolites in association with infarct growth volume and other biomarkers were evaluated using Pearson correlation and linear regression analyses.19
Results
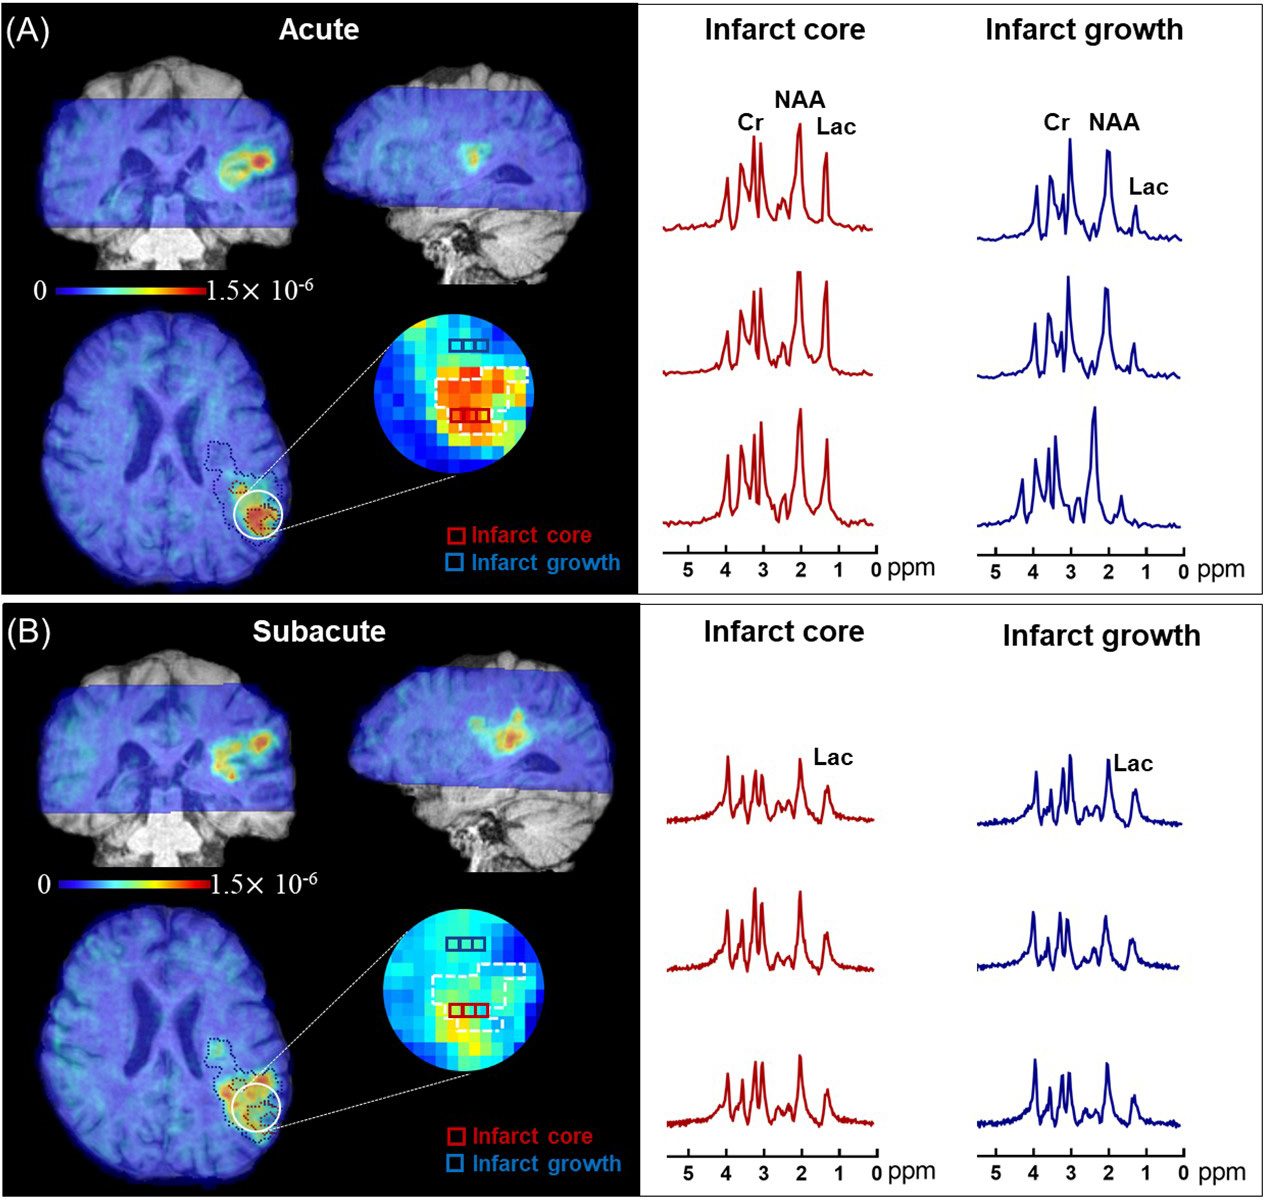
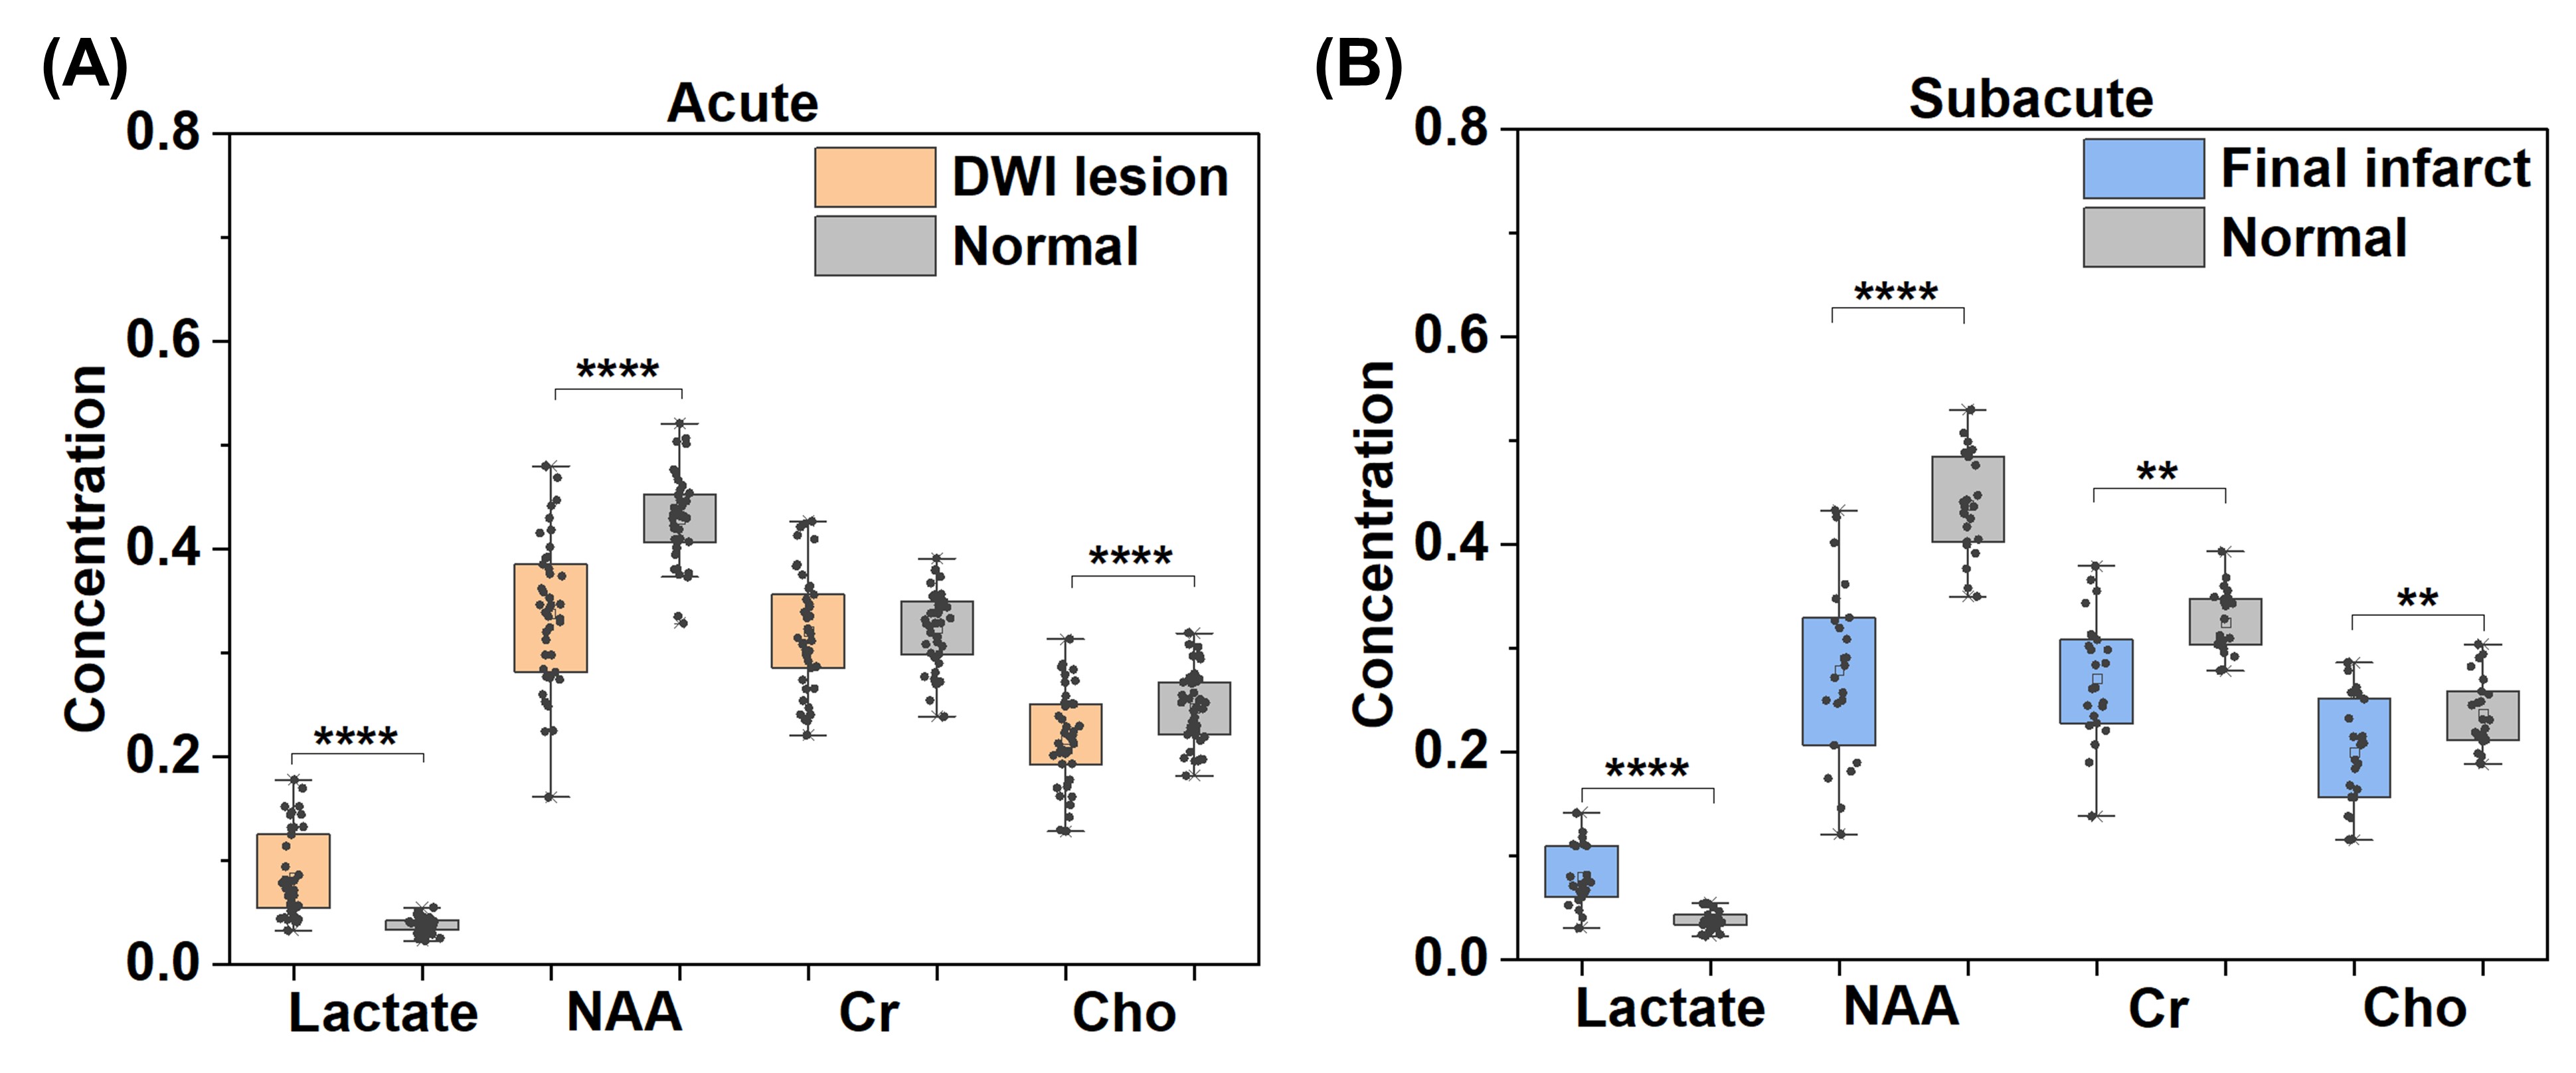
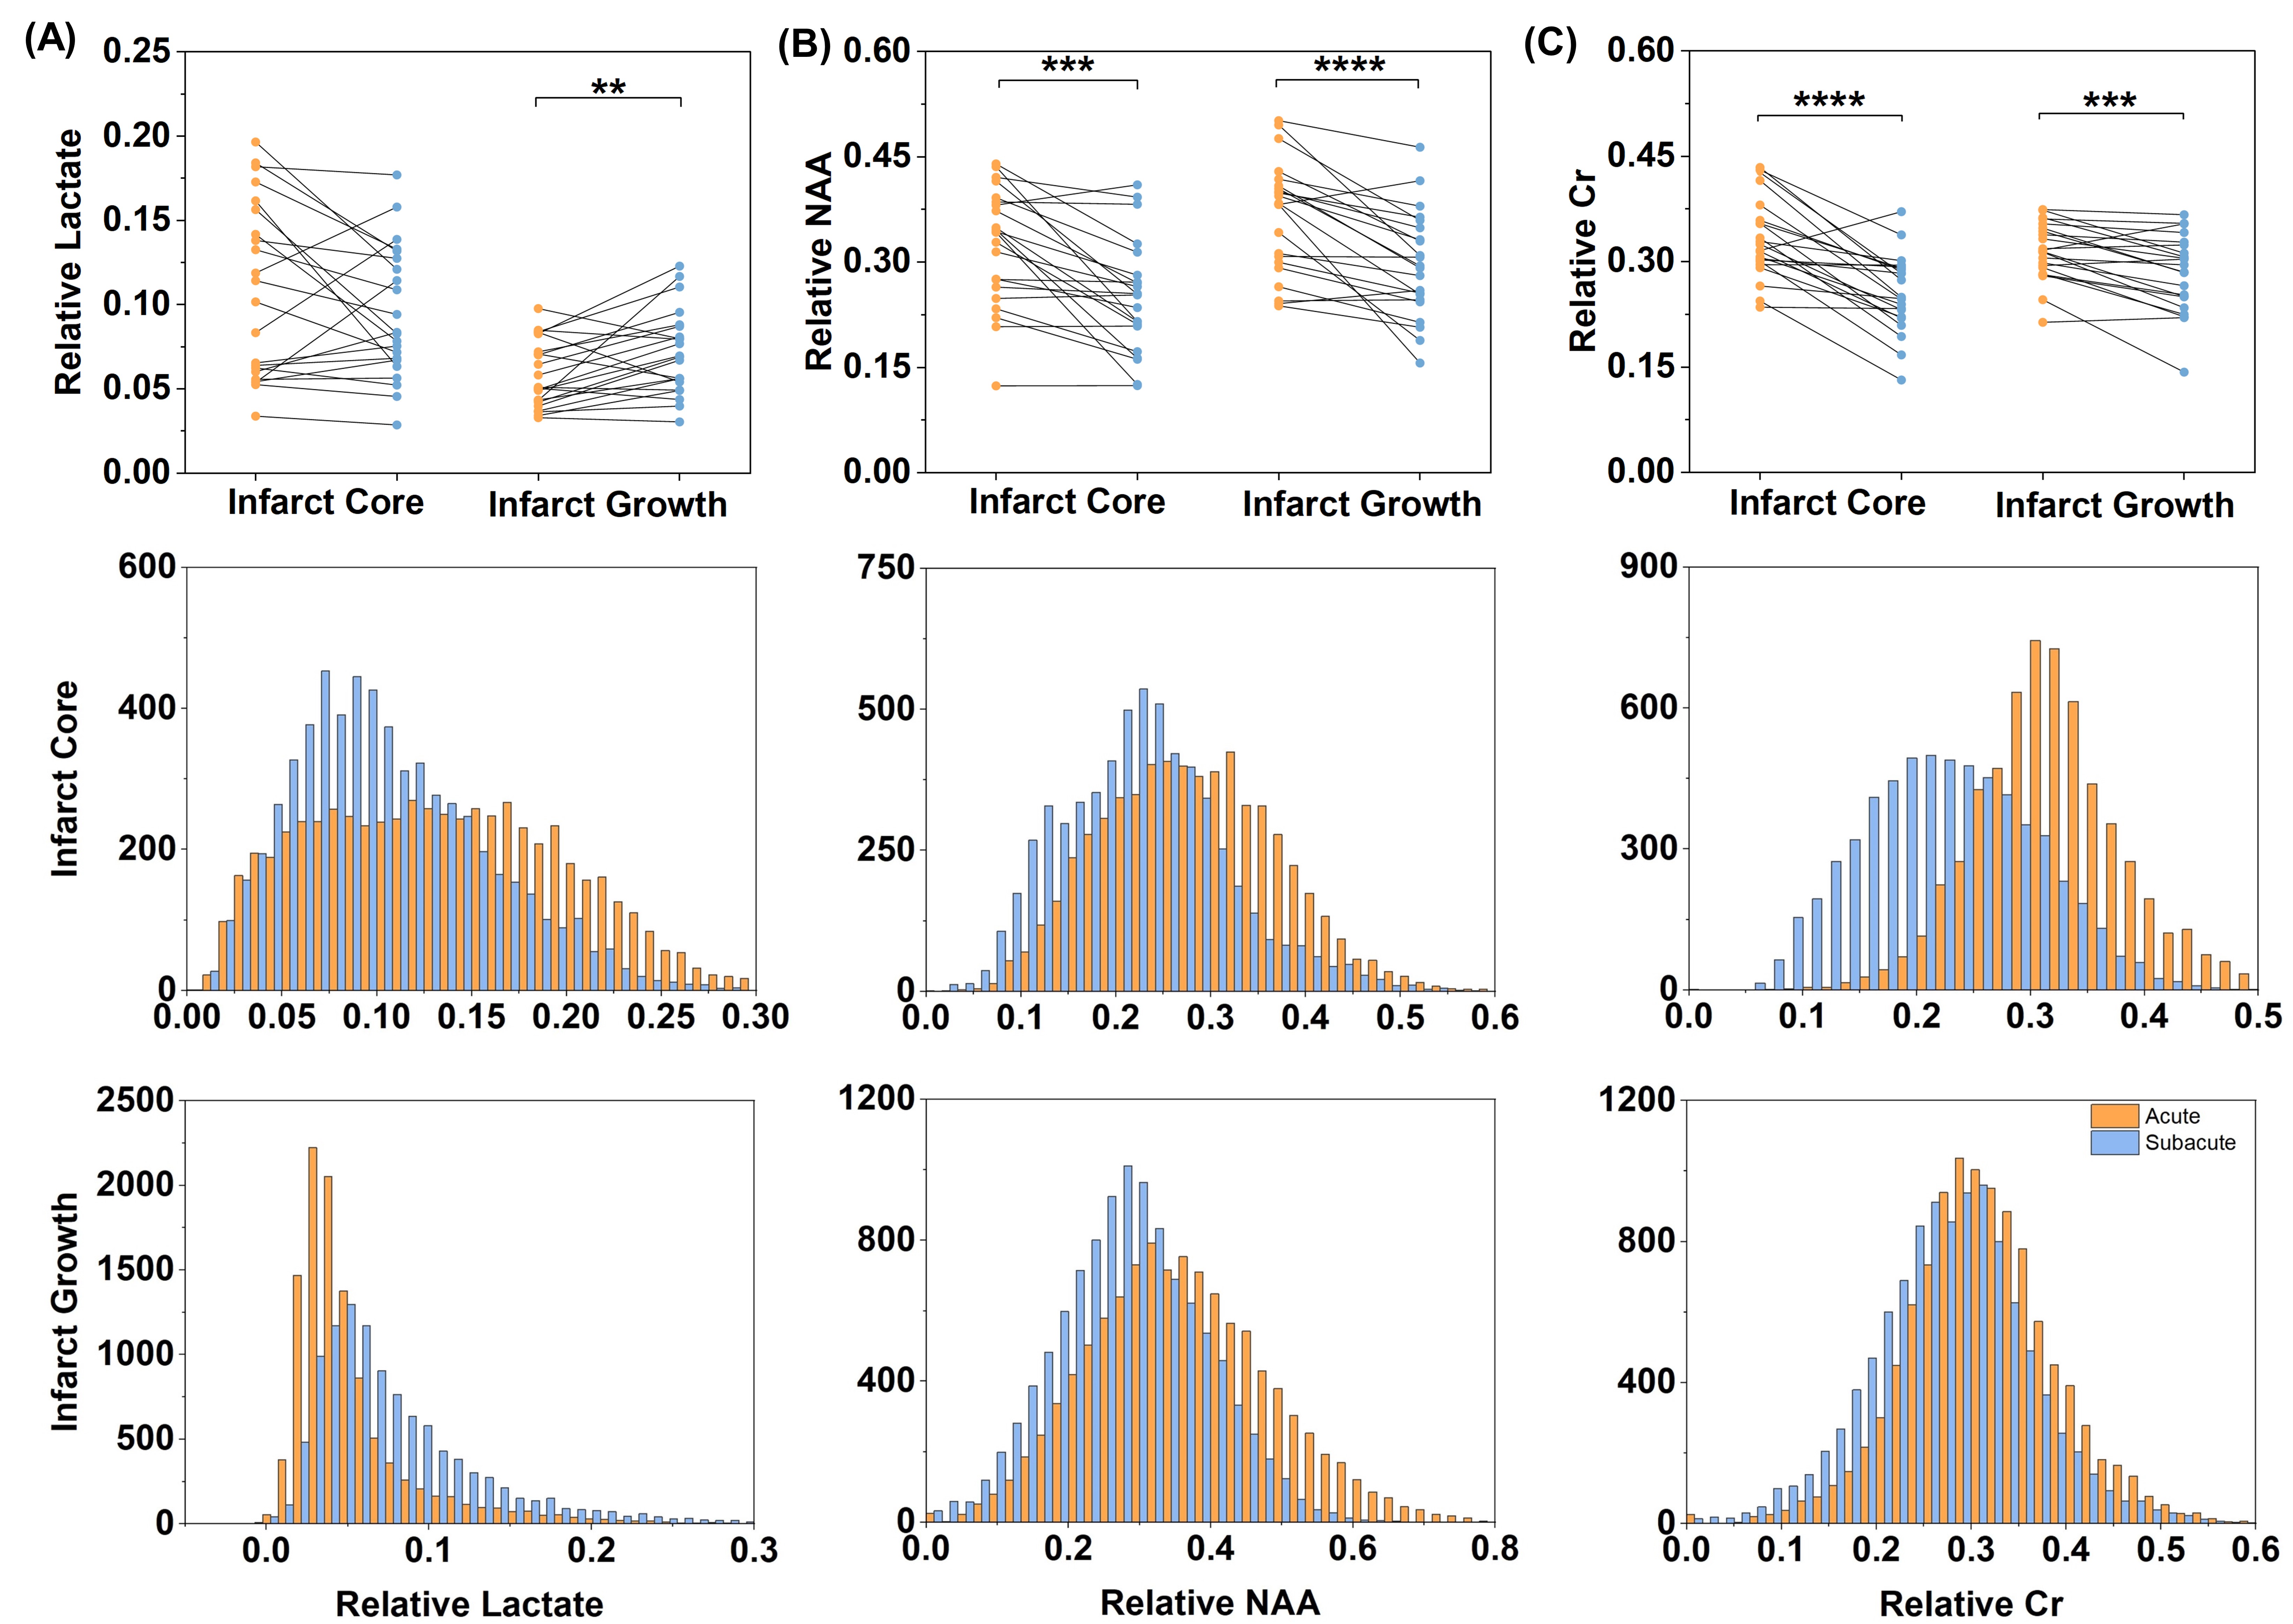
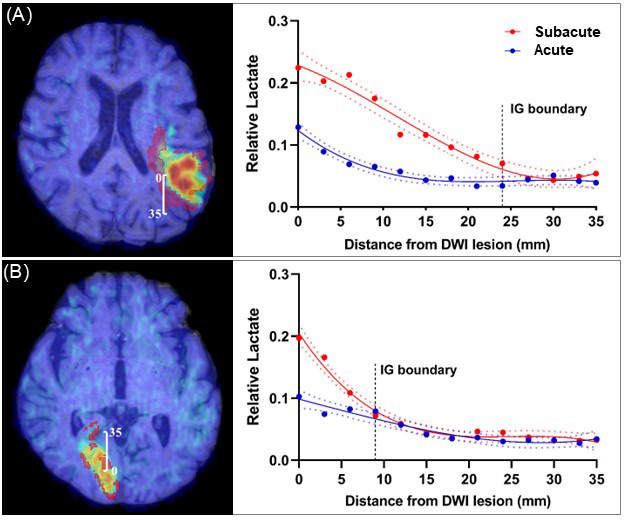
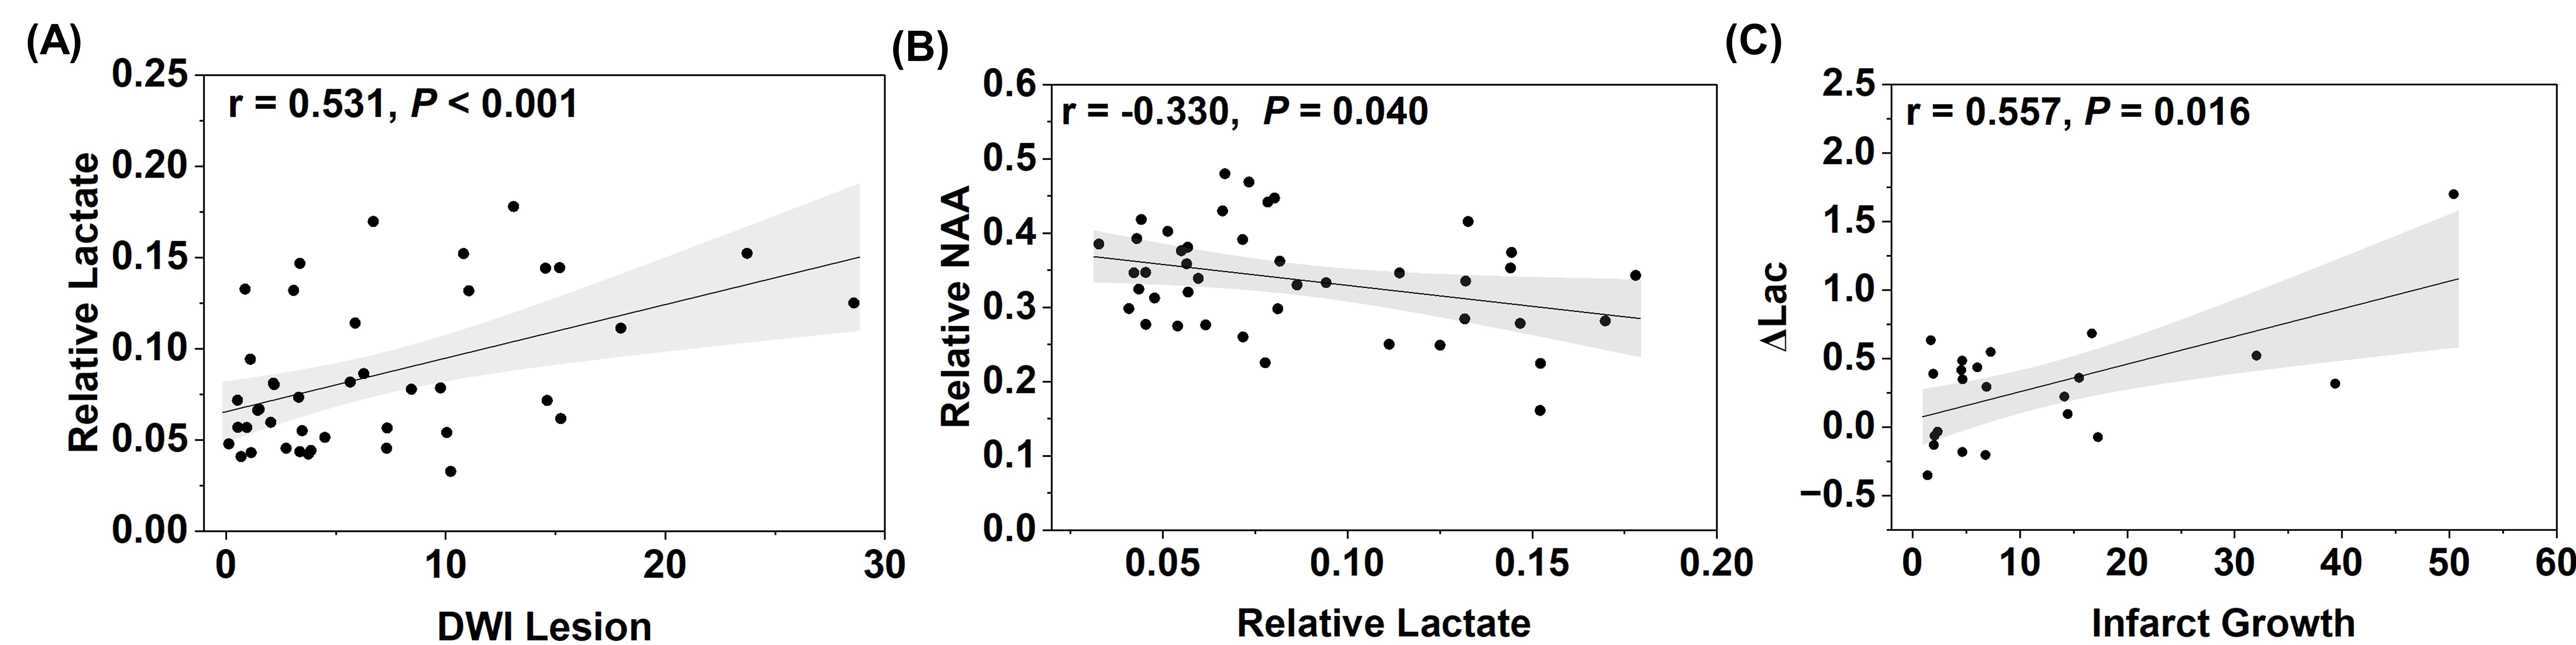
Fig. 1 shows representative triplanar lactate maps obtained from an ischemic stroke patient at acute (13h) and subacute (8d) stages, respectively. Representative MRSI spectra were sampled from infarct core and infarct growth regions. The comparisons of neurometabolites within the DWI lesion versus contralateral tissue, and within the final infarct versus contralateral tissue are shown in Fig. 2, demonstrating elevation in lactate and reduction in NAA in both acute and subacute stages. The progressive changes of lactate, NAA, and Cr in both ROIs for all the patients are shown in Fig. 3, at both voxel-level and subject-level. The lactate concentration in infarct growth significantly increased from acute to subacute stage (P < 0.01). NAA and creatine decreased from acute to subacute stages in both regions (P < 0.001 for all). The spatial profiles of lactate across acute and subacute lesions are shown in Fig. 4 for patients with a large (15.5 mL) and a small (4.6 mL) infarct growth volume, respectively. A spatially coupled lactate elevation was observed, in line with the correlation analysis results which showed significant correlation between infarct growth volume and lactate increase (r = 0.557, P = 0.016, Fig. 5). Linear regression analyses showed the predictive biomarkers for acute lactate concentration included patient glucose level (P = 0.025) and lesion volume (P = 0.003). The increase in lactate level served as the predictive biomarker for infarct growth volume (P = 0.002).Conclusion
We investigated the progression of lactic acidosis in association with infarct growth from acute to subacute ischemic stroke using fast high-resolution 3D 1H-MRSI. Our results showed the potential of lactate increase for predicting infarct growth volume, which may lay a foundation for further investigation of temporal dynamics of lactic acidosis to help design therapeutic intervention for stroke patients.Acknowledgements
This work was supported by Shanghai Pilot Program for Basic Research—Shanghai Jiao Tong University (21TQ1400203), the National Natural Science Foundation of China (81871083), and Key Program of Multidisciplinary Cross Research Foundation of Shanghai Jiao Tong University (YG2021ZD28, YG2022QN035,YG2021QN40).References
1. Huang YZ, McNamara JO. Ischemic stroke: “Acidotoxicity” is a perpetrator. Cell. 2004;118:665–666
2. Rehncrona S, Rosen I, Siesjo BK. Brain lactic acidosis and ischemic cell damage: 1. Biochemistry and neurophysiology. J Cereb Blood Flow Metab. 1981;1:297–311
3. Kalimo H, Rehncrona S, Soderfeldt B, Olsson Y, Siesjo BK. Brain lactic acidosis and ischemic cell damage: 2. Histopathology. J Cereb Blood Flow Metab. 1981;1:313–327
4. Li M, Inoue K, Branigan D, et al. Acid-sensing ion channels in acidosis-induced injury of human brain neurons. J Cereb Blood Flow Metab. 2010;30:1247–1260
5. COSBID, Dohmen C, Sakowitz OW, et al. Spreading depolarizations occur in human ischemic stroke with high incidence. Ann Neurol. 2008;63:720–728
6. Zha X, Xiong Z-G, Simon RP. pH and proton-sensitive receptors in brain ischemia. J Cereb Blood Flow Metab. 2022; 42:1349–1363
7. Leigh R, Knutsson L, Zhou J, van Zijl PCM. Imaging the physiological evolution of the ischemic penumbra in acute ischemic stroke. J Cereb Blood Flow Metab. 2018; 38:1500–1516
8. Heiss W-D. The Ischemic Penumbra: Correlates in Imaging and Implications for Treatment of Ischemic Stroke. Cerebrovascular Diseases. 2011;32:307–320
9. Kelmanson V I, Shokhina AG, Kotova DA, et al. In vivo dynamics of acidosis and oxidative stress in the acute phase of an ischemic stroke in a rodent model. Redox Biol. 2021;48
10. Senda M, Alpert NM, Mackay BC, et al. Evaluation of the 11CO2 positron emission tomographic method for measuring brain pH. II. Quantitative pH mapping in patients with ischemic cerebrovascular diseases. J Cereb Blood Flow Metab. 1989;9:859–873
11. Bogh N, Olin RB, Hansen ES, et al. Metabolic MRI with hyperpolarized [1-C-13]pyruvate separates benign oligemia from infarcting penumbra in porcine stroke. J Cereb Blood Flow Metab. 2021;41:2916–2927
12. Heo H-Y, Tee YK, Harston G, Leigh R, Chappell MA. Amide proton transfer imaging in stroke. NMR Biomed 2022; n/a:e4734
13. Li Y, Wang T, Zhang T, et al. Fast high-resolution metabolic imaging of acute stroke with 3D magnetic resonance spectroscopy. Brain. 2020;143:3225–3233
14. Liang ZP. Spatiotemporal imaging with partially separable functions.In: Proceedings of the 4 IEEE International Symposium on Biomedical Imaging: From Nano to Macro. 2007:988-991.
15. Lam F, Ma C, Clifford B, Johnson CL, Liang Z-P. High-Resolution H-1-MRSI of the Brain Using SPICE: Data Acquisition and Image Reconstruction. Magn Reson Med 2016;76:1059–1070
16. Ma C, Lam F, Johnson CL, Liang Z-P. Removal of Nuisance Signals from Limited and Sparse H-1 MRSI Data Using a Union-of-Subspaces Model. Magn Reson Med. 2016;75:488–497
17. Li Y, Lam F, Clifford B, Liang Z-P. A Subspace Approach to Spectral Quantification for MR Spectroscopic Imaging. IEEE Trans Biomed Eng. 2017;64:2486–2489
18. Guo R, Zhao Y, Li Y, Li Y, Liang Z-P. Simultaneous metabolic and functional imaging of the brain using SPICE. Magn Reson Med. 2019;82:1993–2002
19. Zou KH, Tuncali K, Silverman SG. Correlation and simple linear regression. Radiology. 2003;227:617–622
Figures