2098
T2 Mapping in Hemorrhagic and Ischemic Stroke using Standard Clinical Images1Department of Biomedical Engineering, University of Alberta, Edmonton, AB, Canada, 2Division of Neurology, Department of Medicine, University of Alberta, Edmonton, AB, Canada, 3Department of Radiology and Diagnostic Imaging, University of Alberta, Edmonton, AB, Canada
Synopsis
Keywords: Stroke, Brain
T2 mapping can provide a route to monitor both iron changes in hemorrhage and water changes in ischemic stroke. Our aim is to investigate the value of T2 mapping from standard proton density and T2-weighted fast spin echo images for hemorrhagic and ischemic stroke. Rapid T2 maps using sequence modeling were reconstructed and compared with susceptibility and apparent diffusion coefficient for 13 hemorrhages and 14 ischemic stroke lesions respectively. Quantitative T2 is highly correlated with susceptibility for hemorrhage and diffusion for ischemic stroke, providing complementary measurements of water and iron changes.Introduction
Stroke is a leading cause of disability and death worldwide1,2. Ischemic and hemorrhagic stroke are the two major types of stroke. Ischemic stroke is typically monitored with diffusion-weighted imaging (DWI) which can depict early stages of ischemia including cellular swelling3–5. Hemorrhagic stroke is typically monitored with iron-sensitive imaging like susceptibility-weighted imaging or quantitative susceptibility mapping (QSM)6–10. T2 mapping provides a route to monitor both iron changes in hemorrhage and water changes in ischemic stroke11–14. However, T2 mapping sequences are rarely included in clinical protocols due to long acquisition times. With appropriate modeling, accurate T2 mapping is possible using only standard proton density (PD) and transverse relaxation (T2)-weighted fast spin echo (FSE) images that may be part of standard protocols15, enabling rapidly computed T2 maps to be produced on the image console for stroke evaluation16.Purpose
To investigate the value of T2 mapping from standard PD and T2-weighted FSE for ischemic and hemorrhagic stroke.Methods
Patient information:23 patients(11M/12F, age:71±11 years) were scanned at 3T. Nine patients with 13 intracerebral hemorrhages diagnosed by CT received a follow-up MRI scan from day 2 to day 30 after symptom onset. Fourteen patients with ischemic stroke lesions received MRI scans from <24 hours to 30 days after symptom onset.
Sequences:
T2 mapping used a 2D dual-echo FSE protocol with TE1=10ms, TE2=93ms, TR=2600ms, resolution=0.9x0.9x3.5mm3, 3 concatenations, flip angle=1650, slices=44, and acquisition time=2mins, and a rapid B1+ map with TE=2.2ms,TR=19.3s, resolution=1.3x1.3x3.0mm3, flip angle=50and acquisition time=39s. QSM used a 3D single echo GRE sequence with parameters as TE=20ms, TR=27ms, resolution=0.9x0.9x1.5mm3, flip angle=150, slices=80, acquisition time=4mins and 54s and first order gradient moment nulling. To measure Apparent diffusion coefficient (ADC), 2D EPI was used with TE=54ms, TR=2600ms, resolution=0.75x0.75x5mm3 with in-plane interpolation, slices=24, b=1000s/mm2 with 12 monopolar gradient directions and acquisition time=59s. All but 2 patients were also scanned with a higher resolution scan with similar parameters except: TE=57ms, TR=7900ms, resolution=0.75x0.75x1.5mm3 with in-plane interpolation and acquisition time=4 mins. The higher resolution scan, when available, was used for comparison with T2 maps.
Data Analysis:
T2 maps were compared to QSM in hemorrhage and to ADC in ischemic stroke. In all cases, T2 maps were generated using sequence modeling that accounted for stimulated echoes and a fast mapping reconstruction technique as previously described16. QSM for the hemorrhages was computed using the superposition method17 as described in the previous paper18. All computation was performed in MATLAB R2019A. ADC maps were directly generated by the scanner software.
Images were registered using SPM and ROI volumes were manually drawn on QSM for hemorrhages and ADC for ischemic stroke using ITK-SNAP3.8.019. The mean value over those volumes were measured on QSM, ADC, T2maps and T2-weighted images for further analysis. Statistical analysis was conducted using R4.2.2. Q-Q plot and Shapiro-Wilk’s test was performed to test normality of the dataset. Pearson correlation and Spearman’s correlation was used to study the correlation between variables as appropriate.
Results
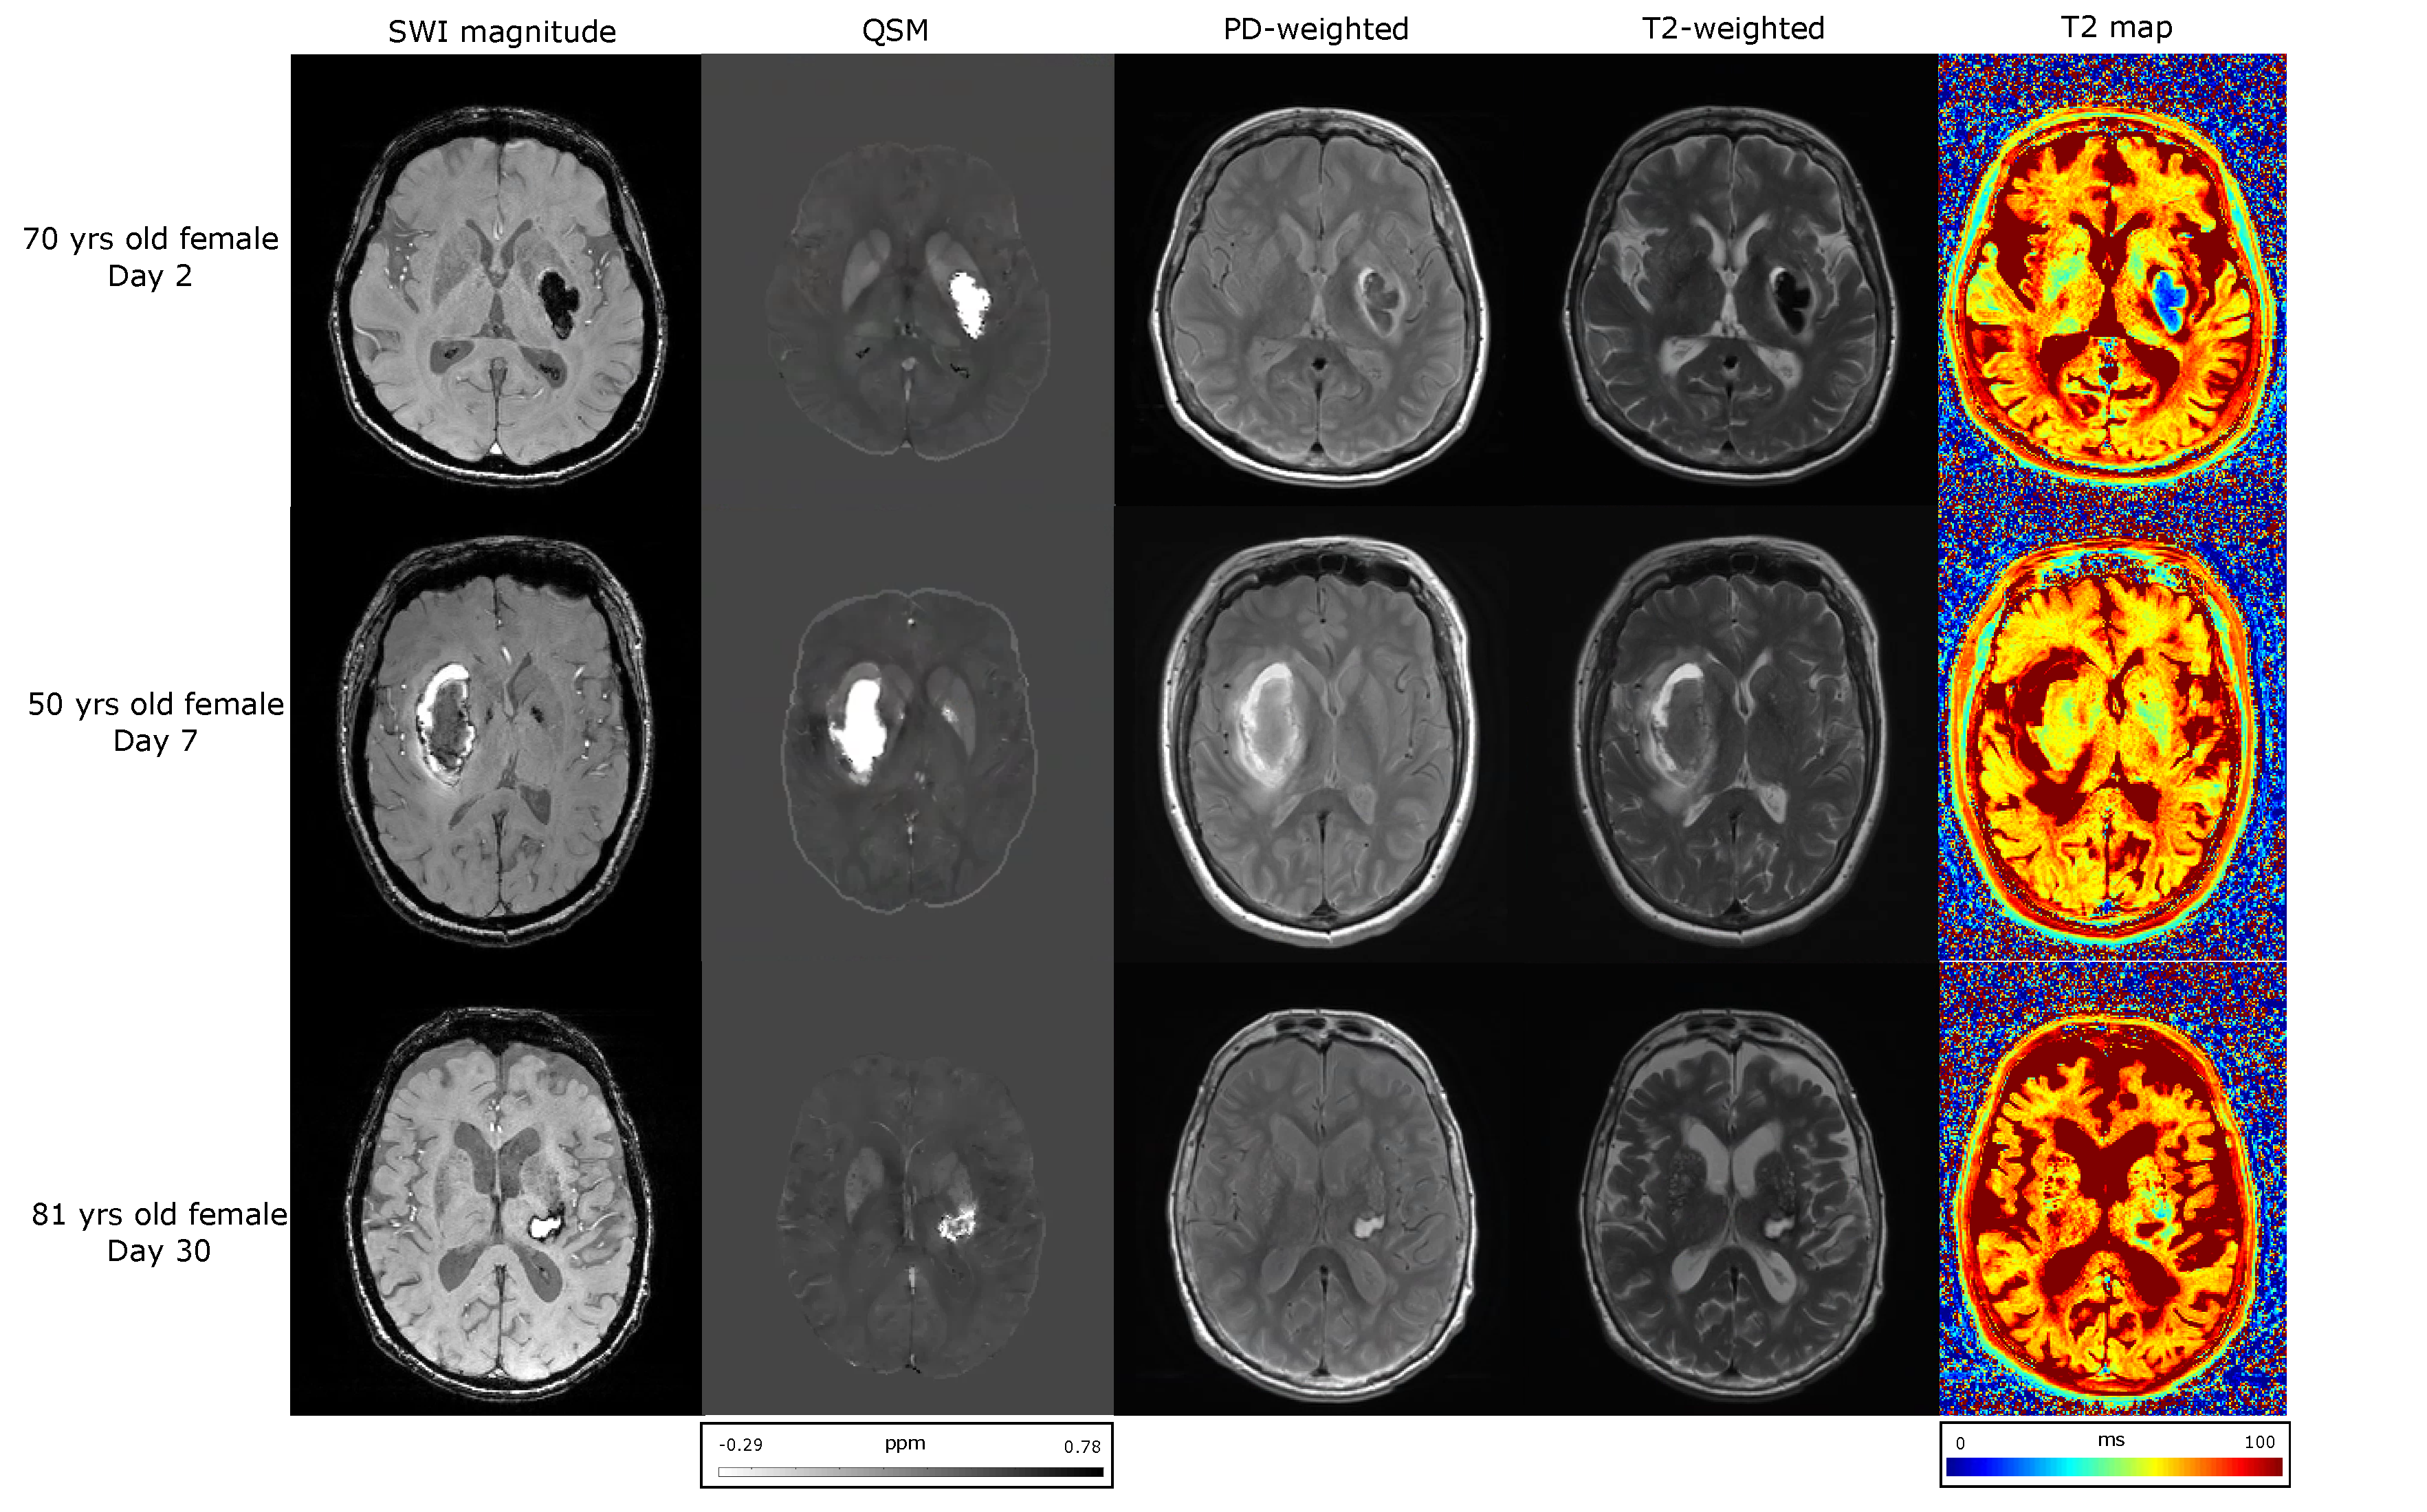
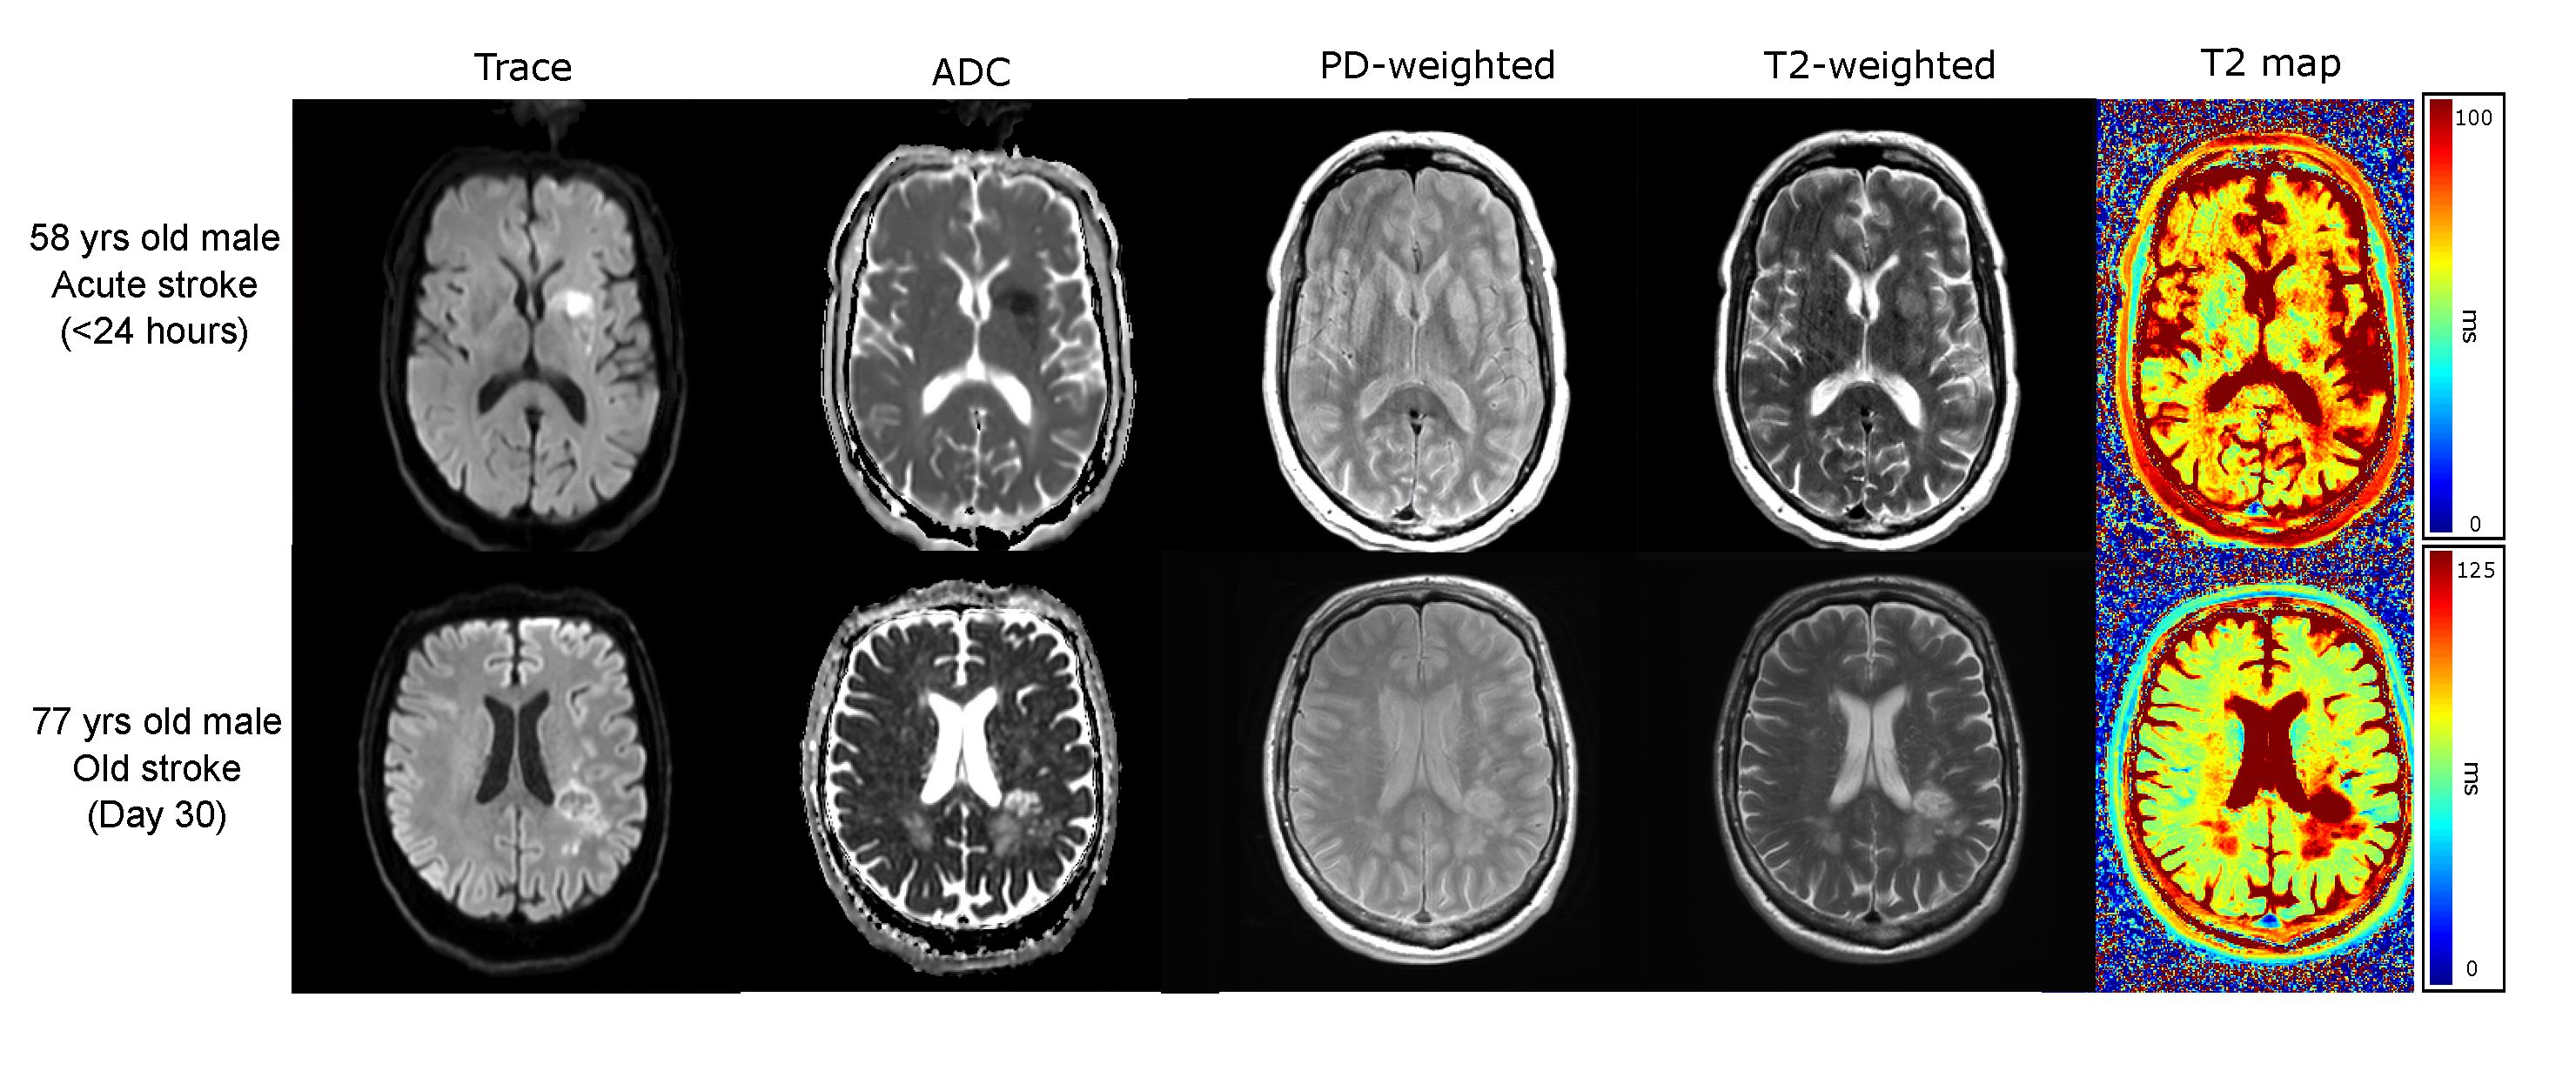
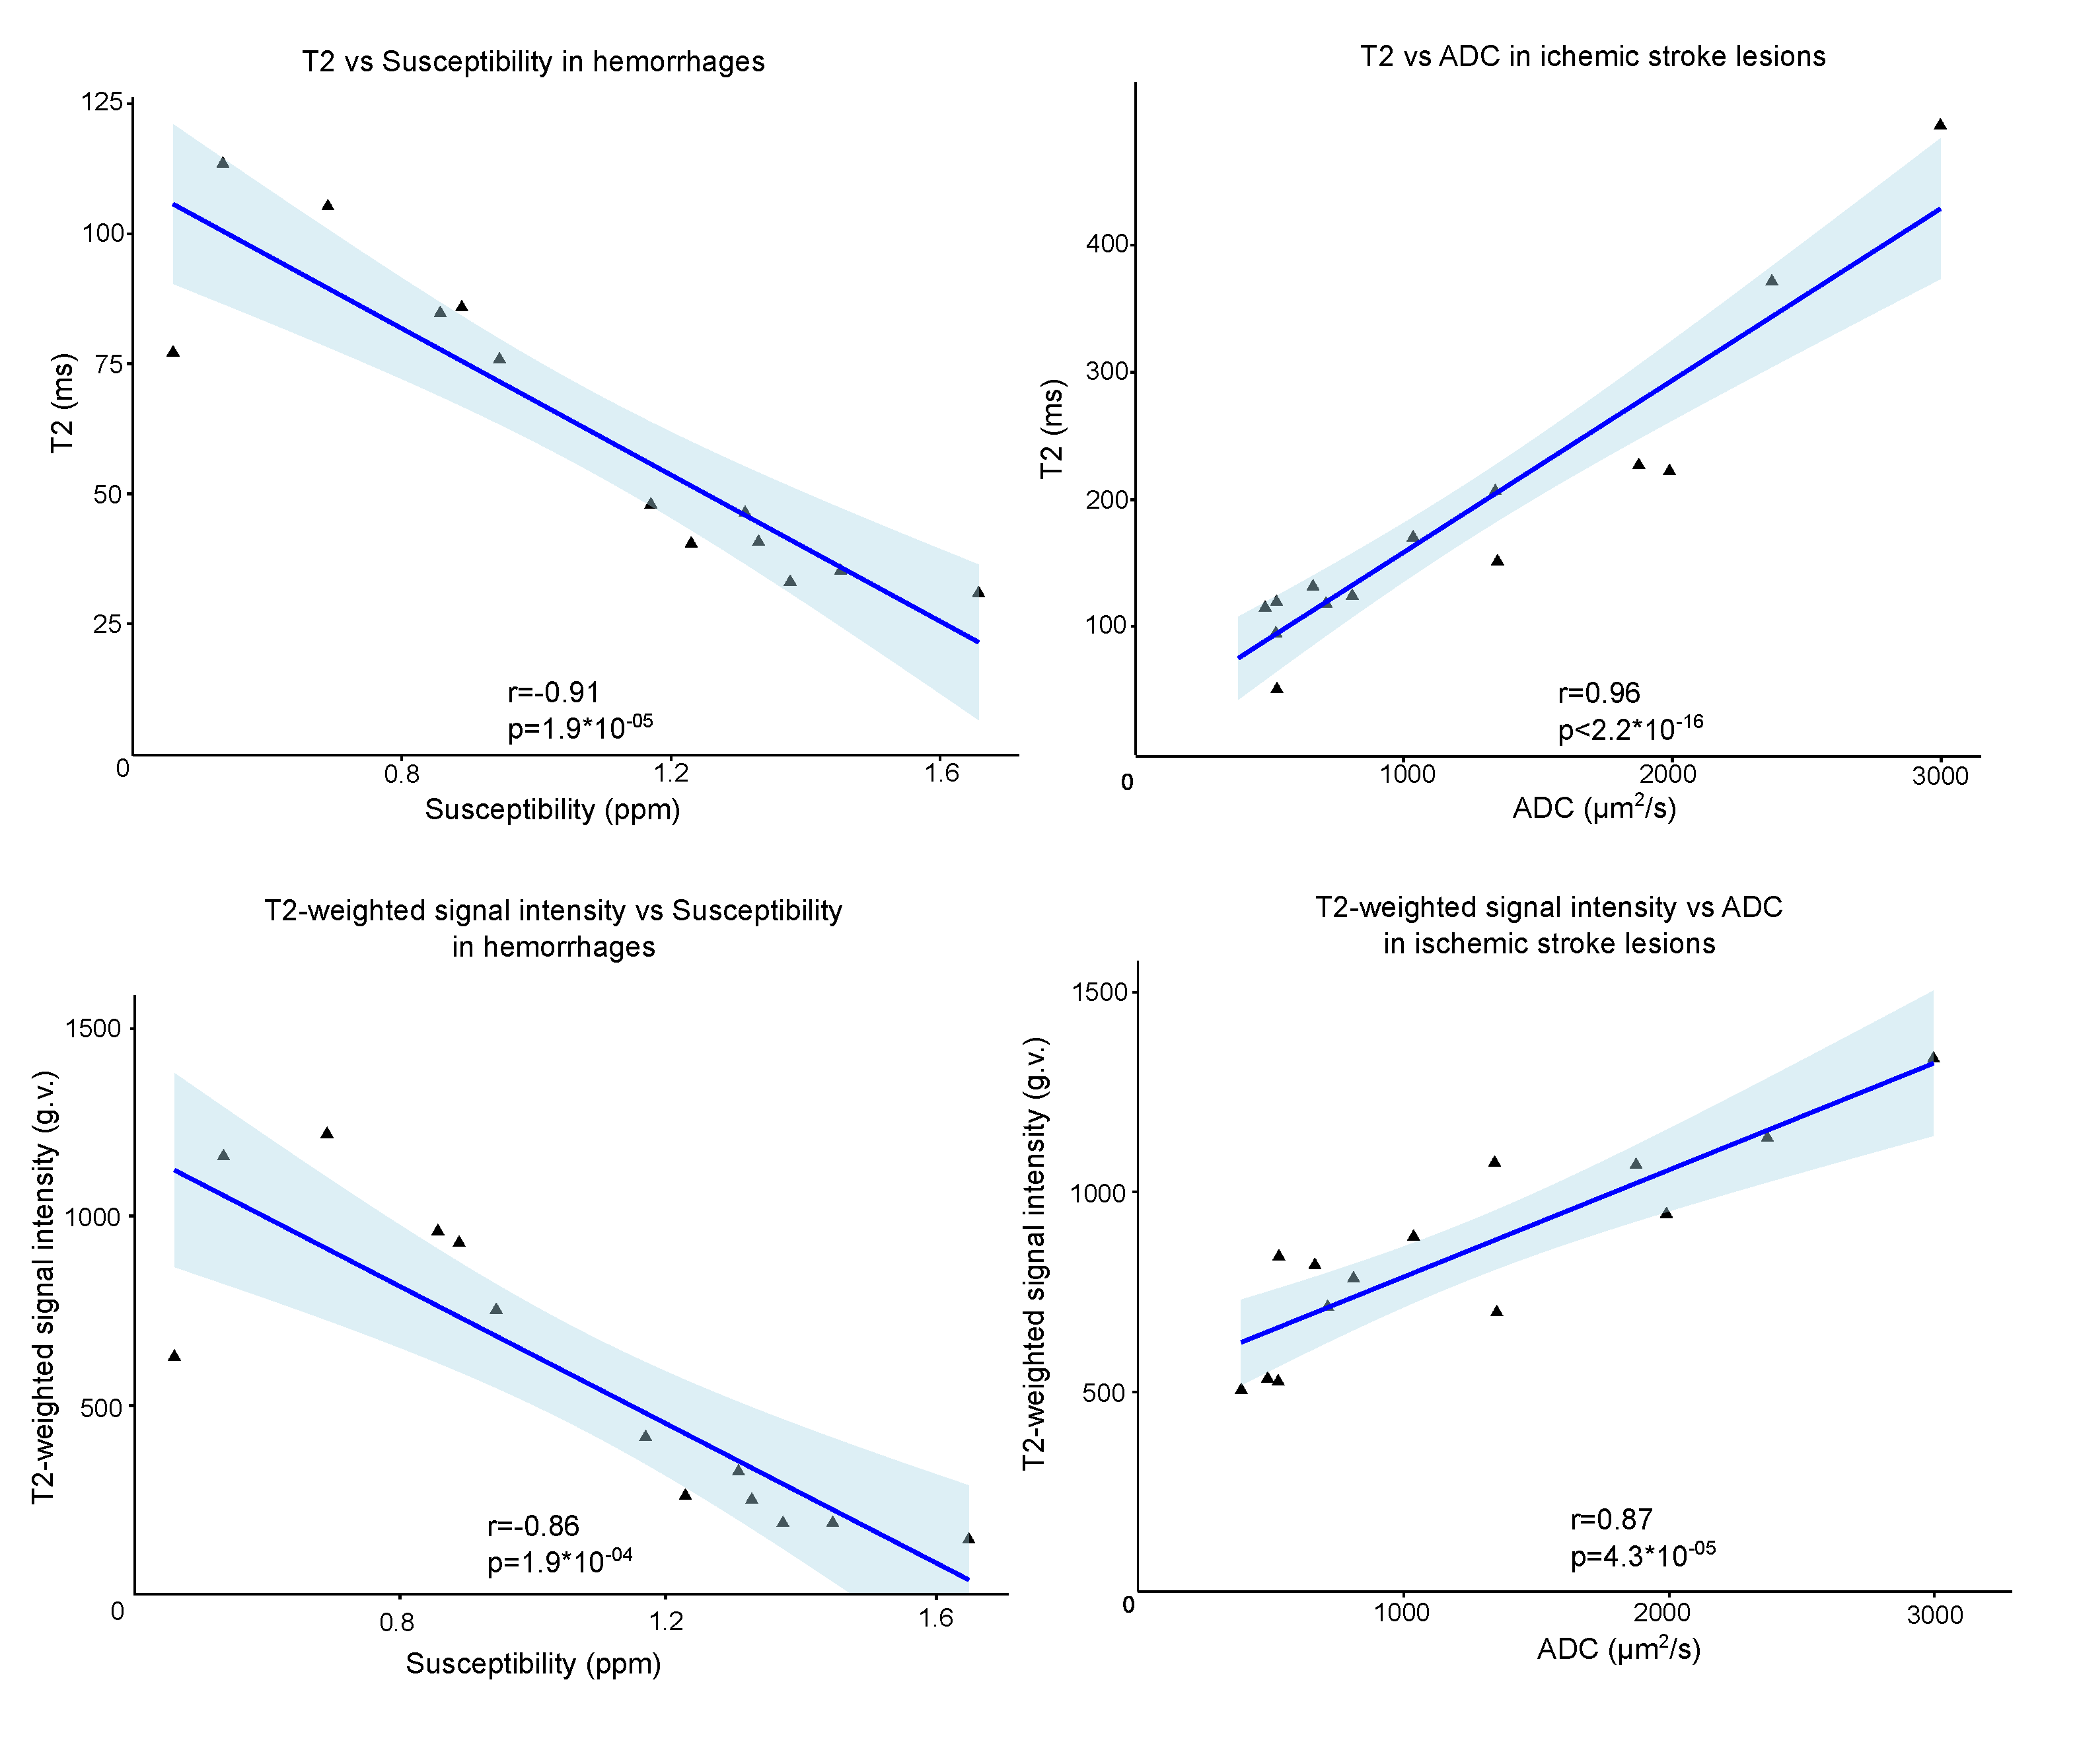
Figures 1 and 2 demonstrate T2 maps and other images in patients with hemorrhage and ischemic stroke respectively at different times from symptom onset. Figure 3 shows the correlation of T2 and T2-weighted signal intensity with susceptibility and ADC in hemorrhage and stroke patients. Figure 4 shows the time evolution in susceptibility, T2 and T2-weighted signal intensity for hemorrhages.Discussion
If PD-weighted and T2-weighted images along with B1+ estimates are acquired for stroke studies; fast T2 maps can be computed. T2 maps in hemorrhage varied from ~30-110ms, while ischemic lesions ranged from ~70-500ms. Longer T2s in ischemic stroke can be related to increased fluid buildup and the lack of strong iron content. Hemorrhage T2s were reduced by the presence of iron. T2 values showed a strong negative correlation(r=-0.91) with susceptibility for hemorrhage which follows from the known iron sensitivity of T2 mapping. T2 values also had a strong positive correlation(r=0.96) with ADC for ischemic stroke lesions following the known trend of increasing T2 with increasing water content. The dual and opposing sensitivities of T2 mapping to water and iron content can be confounding; but since ischemic lesions are dominated by water content changes and hemorrhage is dominated by iron content, the T2 map provides high correlation with both iron-sensitive susceptibility and water-sensitive ADC.Computation of QSM causes some erosion of the brain at the edge; however, for T2 maps the entire brain information can be obtained. In addition, areas near air-tissue interfaces like the sinuses are all well-visualized on T2 maps via spin echo refocusing, while QSM and ADC can suffer distortions in this region.
Conclusion
T2 maps obtained from standard clinical images provided quantitative T2 measurements for hemorrhagic and ischemic stroke that highly correlate with susceptibility and diffusion respectively. Hence, T2 mapping can be used as a complementary technique for studying hemorrhagic and ischemic stroke lesions along with standard methods.Acknowledgements
Grant support was provided by the Canadian Institutes of Health Research (CIHR).References
1. Feigin VL, Lawes CMM, Bennett DA, Barker-Collo SL, Parag V. Worldwide stroke incidence and early case fatality reported in 56 population-based studies: a systematic review. Lancet Neurol. 2009;8(4):355-369. doi:10.1016/S1474-4422(09)70025-0
2. van Asch CJ, Luitse MJ, Rinkel GJ, van der Tweel I, Algra A, Klijn CJ. Incidence, case fatality, and functional outcome of intracerebral haemorrhage over time, according to age, sex, and ethnic origin: a systematic review and meta-analysis. Lancet Neurol. 2010;9(2):167-176. doi:10.1016/S1474-4422(09)70340-0
3. Rosso C, Colliot O, Pires C, et al. Early ADC changes in motor structures predict outcome of acute stroke better than lesion volume. J Neuroradiol. 2011;38(2):105-112. doi:10.1016/j.neurad.2010.05.001
4. Lampinen B, Lätt J, Wasselius J, van Westen D, Nilsson M. Time dependence in diffusion MRI predicts tissue outcome in ischemic stroke patients. Magn Reson Med. 2021;86(2):754-764. doi:10.1002/mrm.28743
5. Sah RG, d’Esterre CD, Hill MD, et al. Diffusion-Weighted MRI Stroke Volume Following Recanalization Treatment is Threshold-Dependent. Clin Neuroradiol. 2019;29(1):135-141. doi:10.1007/s00062-017-0634-4
6. Liu S, Buch S, Chen Y, et al. Susceptibility-weighted imaging: current status and future directions. NMR Biomed. 2017;30(4). doi:10.1002/nbm.3552
7. Kullnig PE, Rauscher A, Witoszynskyj S, et al. Detection of multiple intracranial hemorrhages in a child with acute lymphocytic leukemia (ALL) by susceptibility weighted imaging (SWI). Radiol Case Rep. 2007;2(4):135. doi:10.2484/rcr.v2i4.135
8. Sun H, Klahr AC, Kate M, et al. Quantitative Susceptibility Mapping for Following Intracranial Hemorrhage. Radiology. 2018;288(3):830-839. doi:10.1148/radiol.2018171918
9. Chang S, Zhang J, Liu T, et al. Quantitative Susceptibility Mapping of Intracerebral Hemorrhages at Various Stages. J Magn Reson Imaging JMRI. 2016;44(2):420-425. doi:10.1002/jmri.25143
10. Wang S, Lou M, Liu T, Cui D, Chen X, Wang Y. Hematoma volume measurement in gradient echo MRI using quantitative susceptibility mapping. Stroke. 2013;44(8):2315-2317. doi:10.1161/STROKEAHA.113.001638
11. Duchaussoy T, Budzik JF, Norberciak L, Colas L, Pasquini M, Verclytte S. Synthetic T2 mapping is correlated with time from stroke onset: a future tool in wake-up stroke management? Eur Radiol. 2019;29(12):7019-7026. doi:10.1007/s00330-019-06270-0
12. Siemonsen S, Löbel U, Sedlacik J, et al. Elevated T2-values in MRI of stroke patients shortly after symptom onset do not predict irreversible tissue infarction. Brain J Neurol. 2012;135(Pt 6):1981-1989. doi:10.1093/brain/aws079
13. Siemonsen S, Mouridsen K, Holst B, et al. Quantitative t2 values predict time from symptom onset in acute stroke patients. Stroke. 2009;40(5):1612-1616. doi:10.1161/STROKEAHA.108.542548
14. Ozsunar Y, Grant PE, Huisman TAGM, et al. Evolution of Water Diffusion and Anisotropy in Hyperacute Stroke: Significant Correlation between Fractional Anisotropy and T2. AJNR Am J Neuroradiol. 2004;25(5):699-705.
15. McPhee KC, Wilman AH. T2 quantification from only proton density and T2-weighted MRI by modelling actual refocusing angles. NeuroImage. 2015;118:642-650. doi:10.1016/j.neuroimage.2015.05.079
16. Snyder J, Seres P, Stobbe RW, et al. Inline dual-echo T2 quantification in brain using a fast mapping reconstruction technique. NMR Biomed. Published online August 7, 2022:e4811. doi:10.1002/nbm.4811
17. Sun H, Kate M, Gioia LC, Emery DJ, Butcher K, Wilman AH. Quantitative susceptibility mapping using a superposed dipole inversion method: Application to intracranial hemorrhage. Magn Reson Med. 2016;76(3):781-791. doi:10.1002/mrm.25919
18. De A, Sun H, Emery DJ, Butcher KS, Wilman AH. Rapid quantitative susceptibility mapping of intracerebral hemorrhage. J Magn Reson Imaging JMRI. 2020;51(3):712-718. doi:10.1002/jmri.26850
19. Yushkevich PA, Piven J, Hazlett HC, et al. User-guided 3D active contour segmentation of anatomical structures: significantly improved efficiency and reliability. NeuroImage. 2006;31(3):1116-1128. doi:10.1016/j.neuroimage.2006.01.015
Figures