2097
Diffuse dural sinus hyperintensities on arterial spin labeling reflects reduced cerebral metabolic rate of oxygen in sickle cell anemia patients1Neurology, Vanderbilt University Medical Center, Nashville, TN, United States, 2Vanderbilt Brain Institute, Vanderbilt University, Nashville, TN, United States, 3Radiology, Vanderbilt University Medical Center, Nashville, TN, United States, 4Pediatric Neurology, Vanderbilt University Medical Center, Nashville, TN, United States
Synopsis
Keywords: Stroke, Stroke
Sickle cell anemia (SCA) patients have elevated cerebral blood flow and flow velocities to partially compensate for reduced blood oxygen content; this phenomenon may result in inefficient oxygen delivery to tissue due to accelerated red cell capillary transit. Pseudo-continuous arterial spin labeling (pCASL) and T2-relaxation-under-sping-tagging (TRUST) MRI methods were used to assess arterial-to-venous transit artifacts and oxygen metabolism in 150 SCA participants. Patients with diffuse dural sinus hyperintensities on pCASL had 22.7% lower cerebral metabolic rates of oxygen compared to their counterparts; however, values remained within a normal range of 2.91±0.69 ml O2/100g/min and were not associated with infarct history.Introduction
The overall goal of this work is to evaluate dural sinus hyperintensities on pseudo-continuous arterial spin labeling (pCASL) images, indicative of reduced arterial-to-venous transit, to test fundamental hypotheses regarding the impact of accelerated red cell capillary transit and oxygen metabolism in sickle cell anemia (SCA) patients. SCA is a genetically inherited blood disorder characterized by production of hemoglobin-S (HbS) and corresponding increased rates of hemolysis and ischemic stroke1. The increased hemolysis rate leads to anemia and reduced blood oxygen content, which can be partially or completely compensated for through autoregulatory increases in cerebral blood flow (CBF)2,3. Such hyperemia can be associated with high flow velocities and corresponding rapid cerebral arterio-venous transit times. When this effect is severe, red blood cells spend less time within the capillaries which may lead to reduced oxygen offloading. This capillary shunting effect can be visualized as dural sinus hyperintensities on pCASL and has been shown to correlate with elevated cerebral flow velocities4. However, it remains unknown whether this altered water exchange visible on pCASL relates to aberrant metabolism or infarct history. To understand this possibility, we evaluated hematocrit, blood oxygenation, and clinical indicators of condition severity in sequence with pCASL and T2-relaxation-under-spin-tagging (TRUST) MRI5 to test the hypothesis that dural sinus intensity on pCASL relates to reduced cerebral metabolic rates of oxygen (CMRO2). We additionally assessed whether CMRO2 and/or dural sinus intensity predicts history of silent cerebral infarct (SCI) or overt stroke.Methods
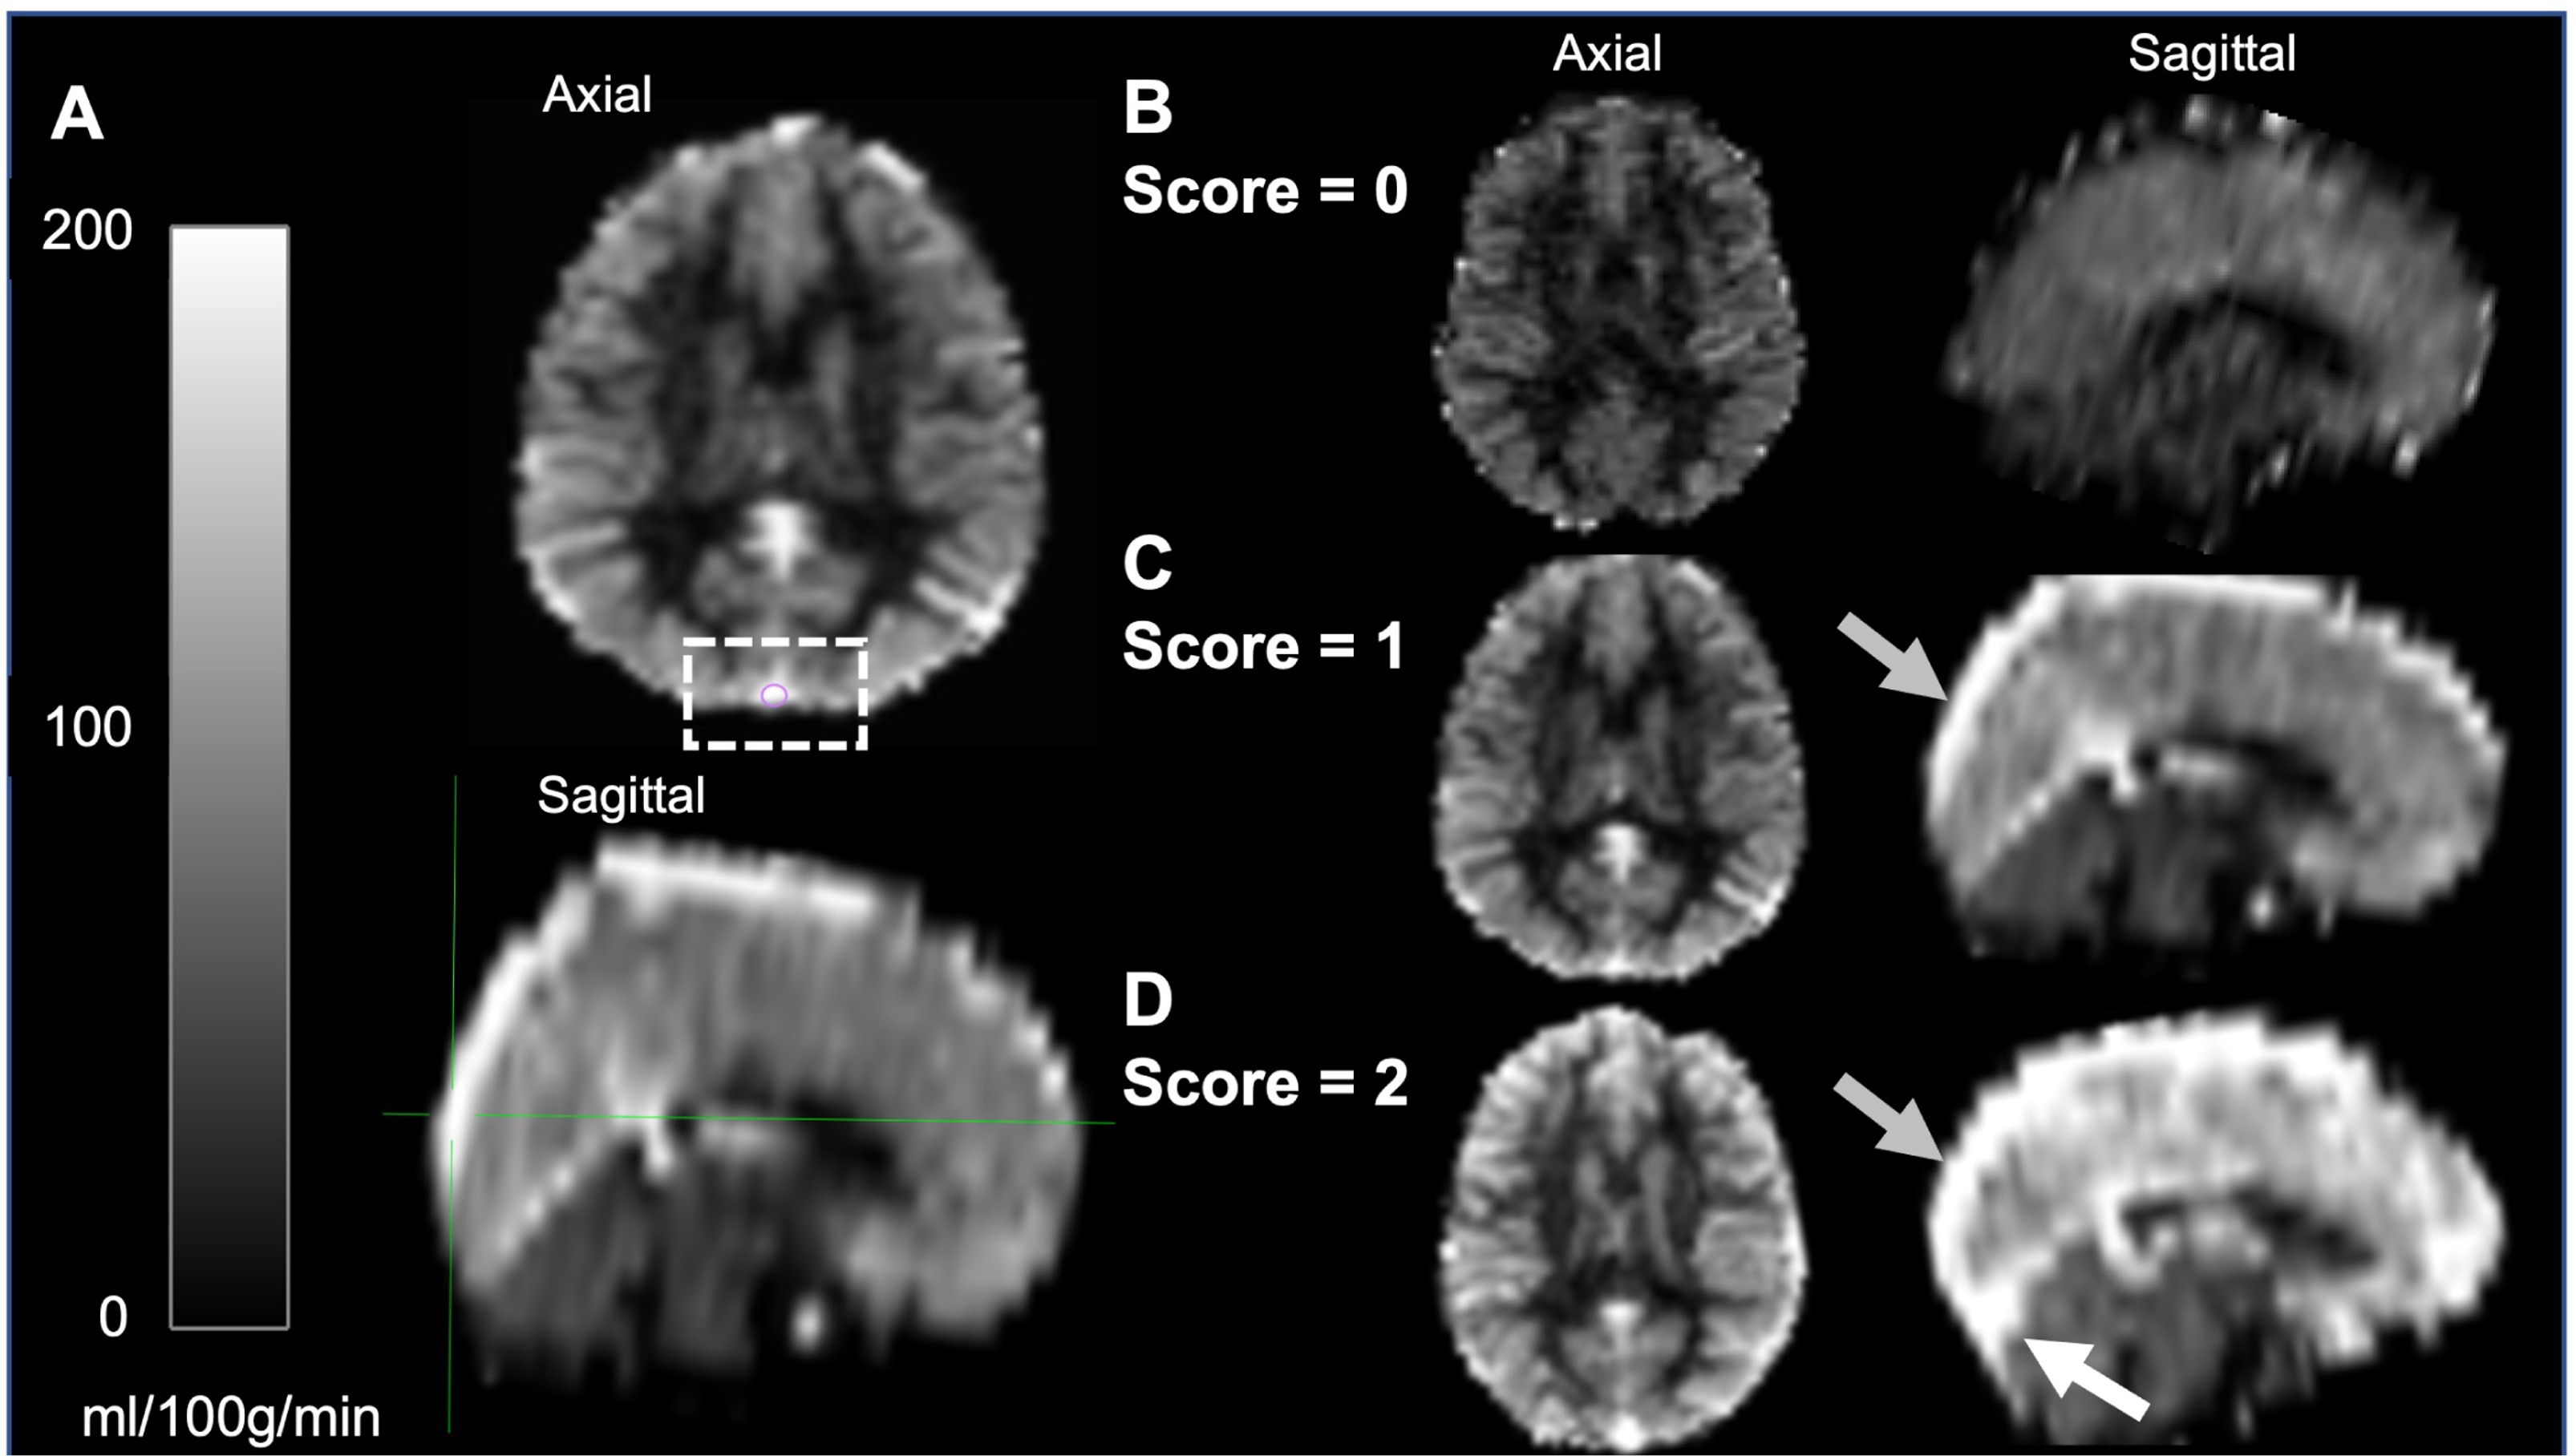
SCA participants, defined as phenotype hemoglobin SS or Sβ0-thalassemia, were recruited from comprehensive sickle cell disease clinics and provided informed, written consent. Acquisition. MRI data were acquired at 3T (Philips). Total hemoglobin (Hb) and Hb-S fraction were measured via venipuncture and arterial oxygen saturation (Ya) obtained from pulse oximetry at the time of imaging. 2D pCASL data (label delay=1900 ms; slice acquisition time=23 ms; spatial resolution=3x3x7 mm) were acquired for CBF quantification and capillary shunting assessment. TRUST data (𝜏CPMG=10 ms; effective echo time=0, 40, 80, and 160 ms; TR/TE=1978/3.6 ms; averages=3; slice thickness=5 mm) were acquired twice per session for OEF quantification. Analysis. pCASL data were corrected for motion and baseline drift, normalized by the equilibrium magnetization (M0), and CBF values were quantified using the final component of a three-stage kinetic model (SCA labeling efficiency=0.72; bolus arrival time=1.02s, T1, tissue=1.209s) based on calibration work in SCA6,7. Blood T1 was calculated based on measured Hb. Gray matter CBF values were extracted in native space. Capillary shunting scores were categorically scored based on venous hyperintensity signal (VHS) on perfusion maps in the major dural venous sinuses (0=no venous hyperintensity; 1=focal hyperintensity; 2=diffuse hyperintensity extending supratentorially to the level of the torcula; Figure 1)4. TRUST data were pair-wise subtracted and used to quantify venous blood water T2 in the superior sagittal sinus, which was converted to venous oxygen saturation (Yv). OEF was calculated as (Ya–Yv)/Ya and CMRO2 according to:$$CMRO_2=CBF*[Hb]*1.34*Y_a*OEF$$
where [Hb] is total hemoglobin and 1.34 ml/g is the oxygen carrying capacity of Hb. Statistical testing. To test the primary hypothesis that dural sinus intensity on pCASL relates to reduced CMRO2, ANOVA and Student’s t-tests were used to test for significant differences between VHS groups. To test the secondary hypothesis of CMRO2 and/or shunting severity predicting history of SCI or overt stroke, multiple linear regressions were used with previous SCI or overt stroke as the dependent variable and CMRO2, shunting score, and age the independent variables.
Results
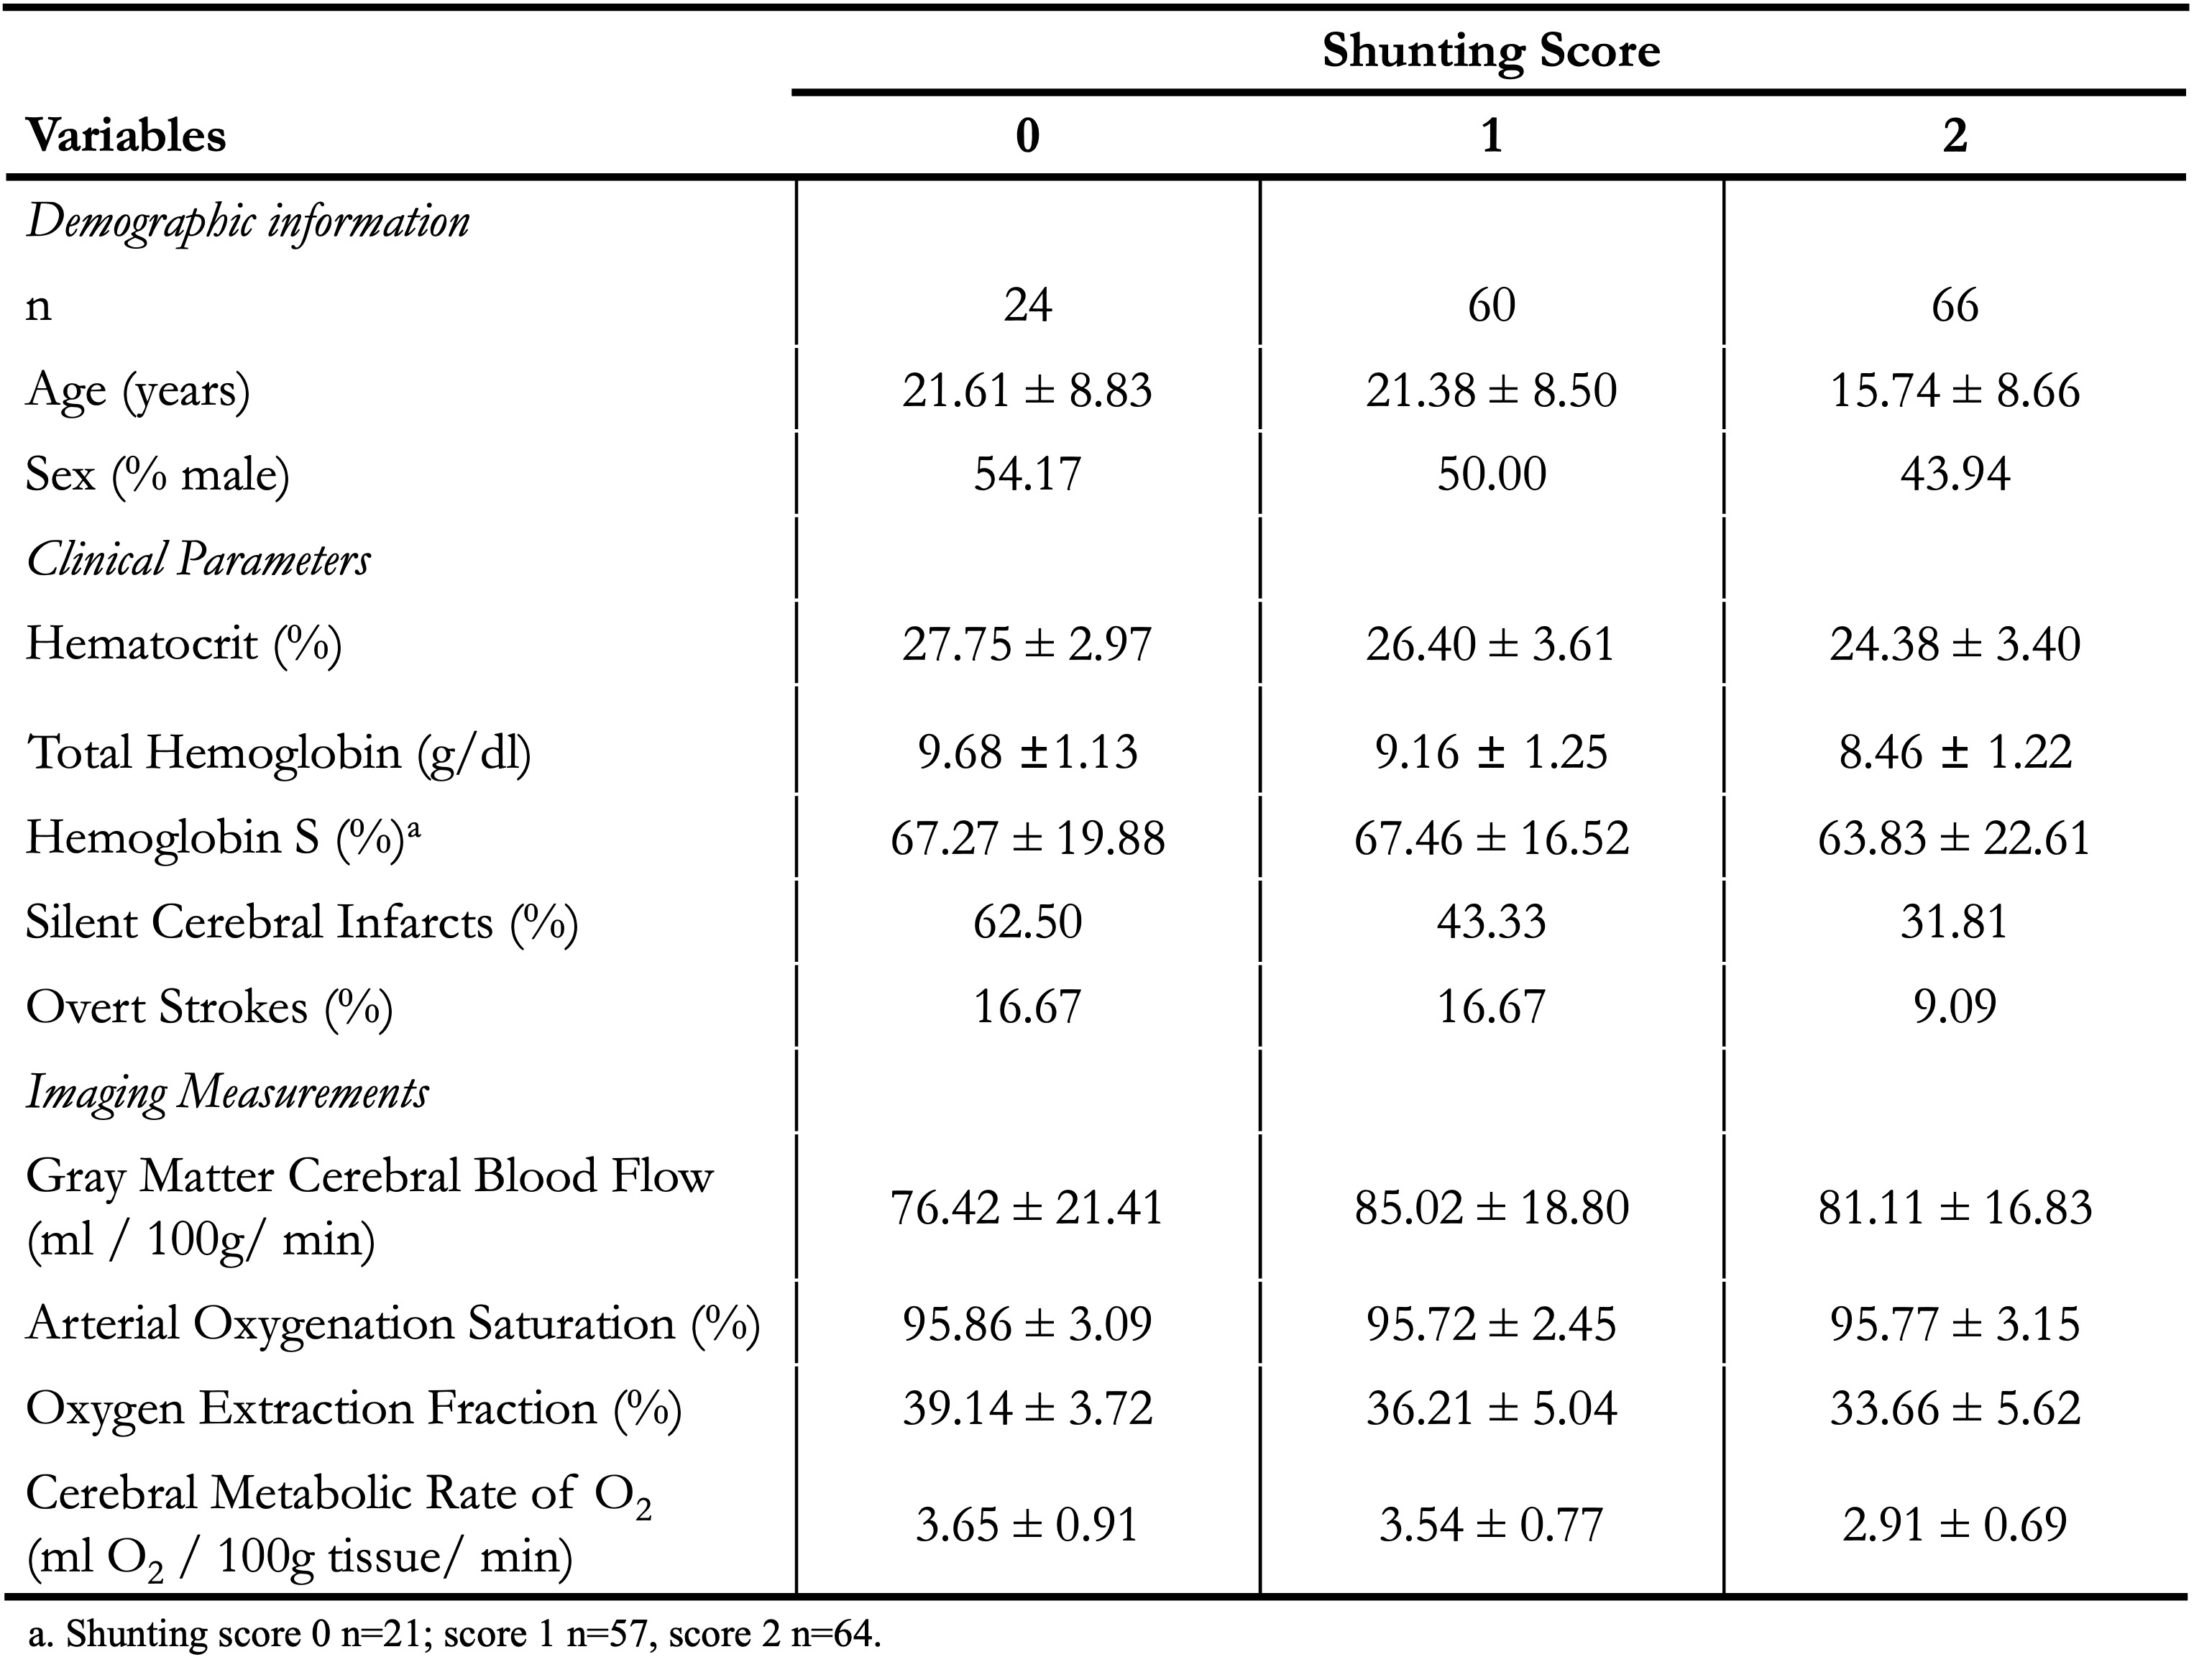
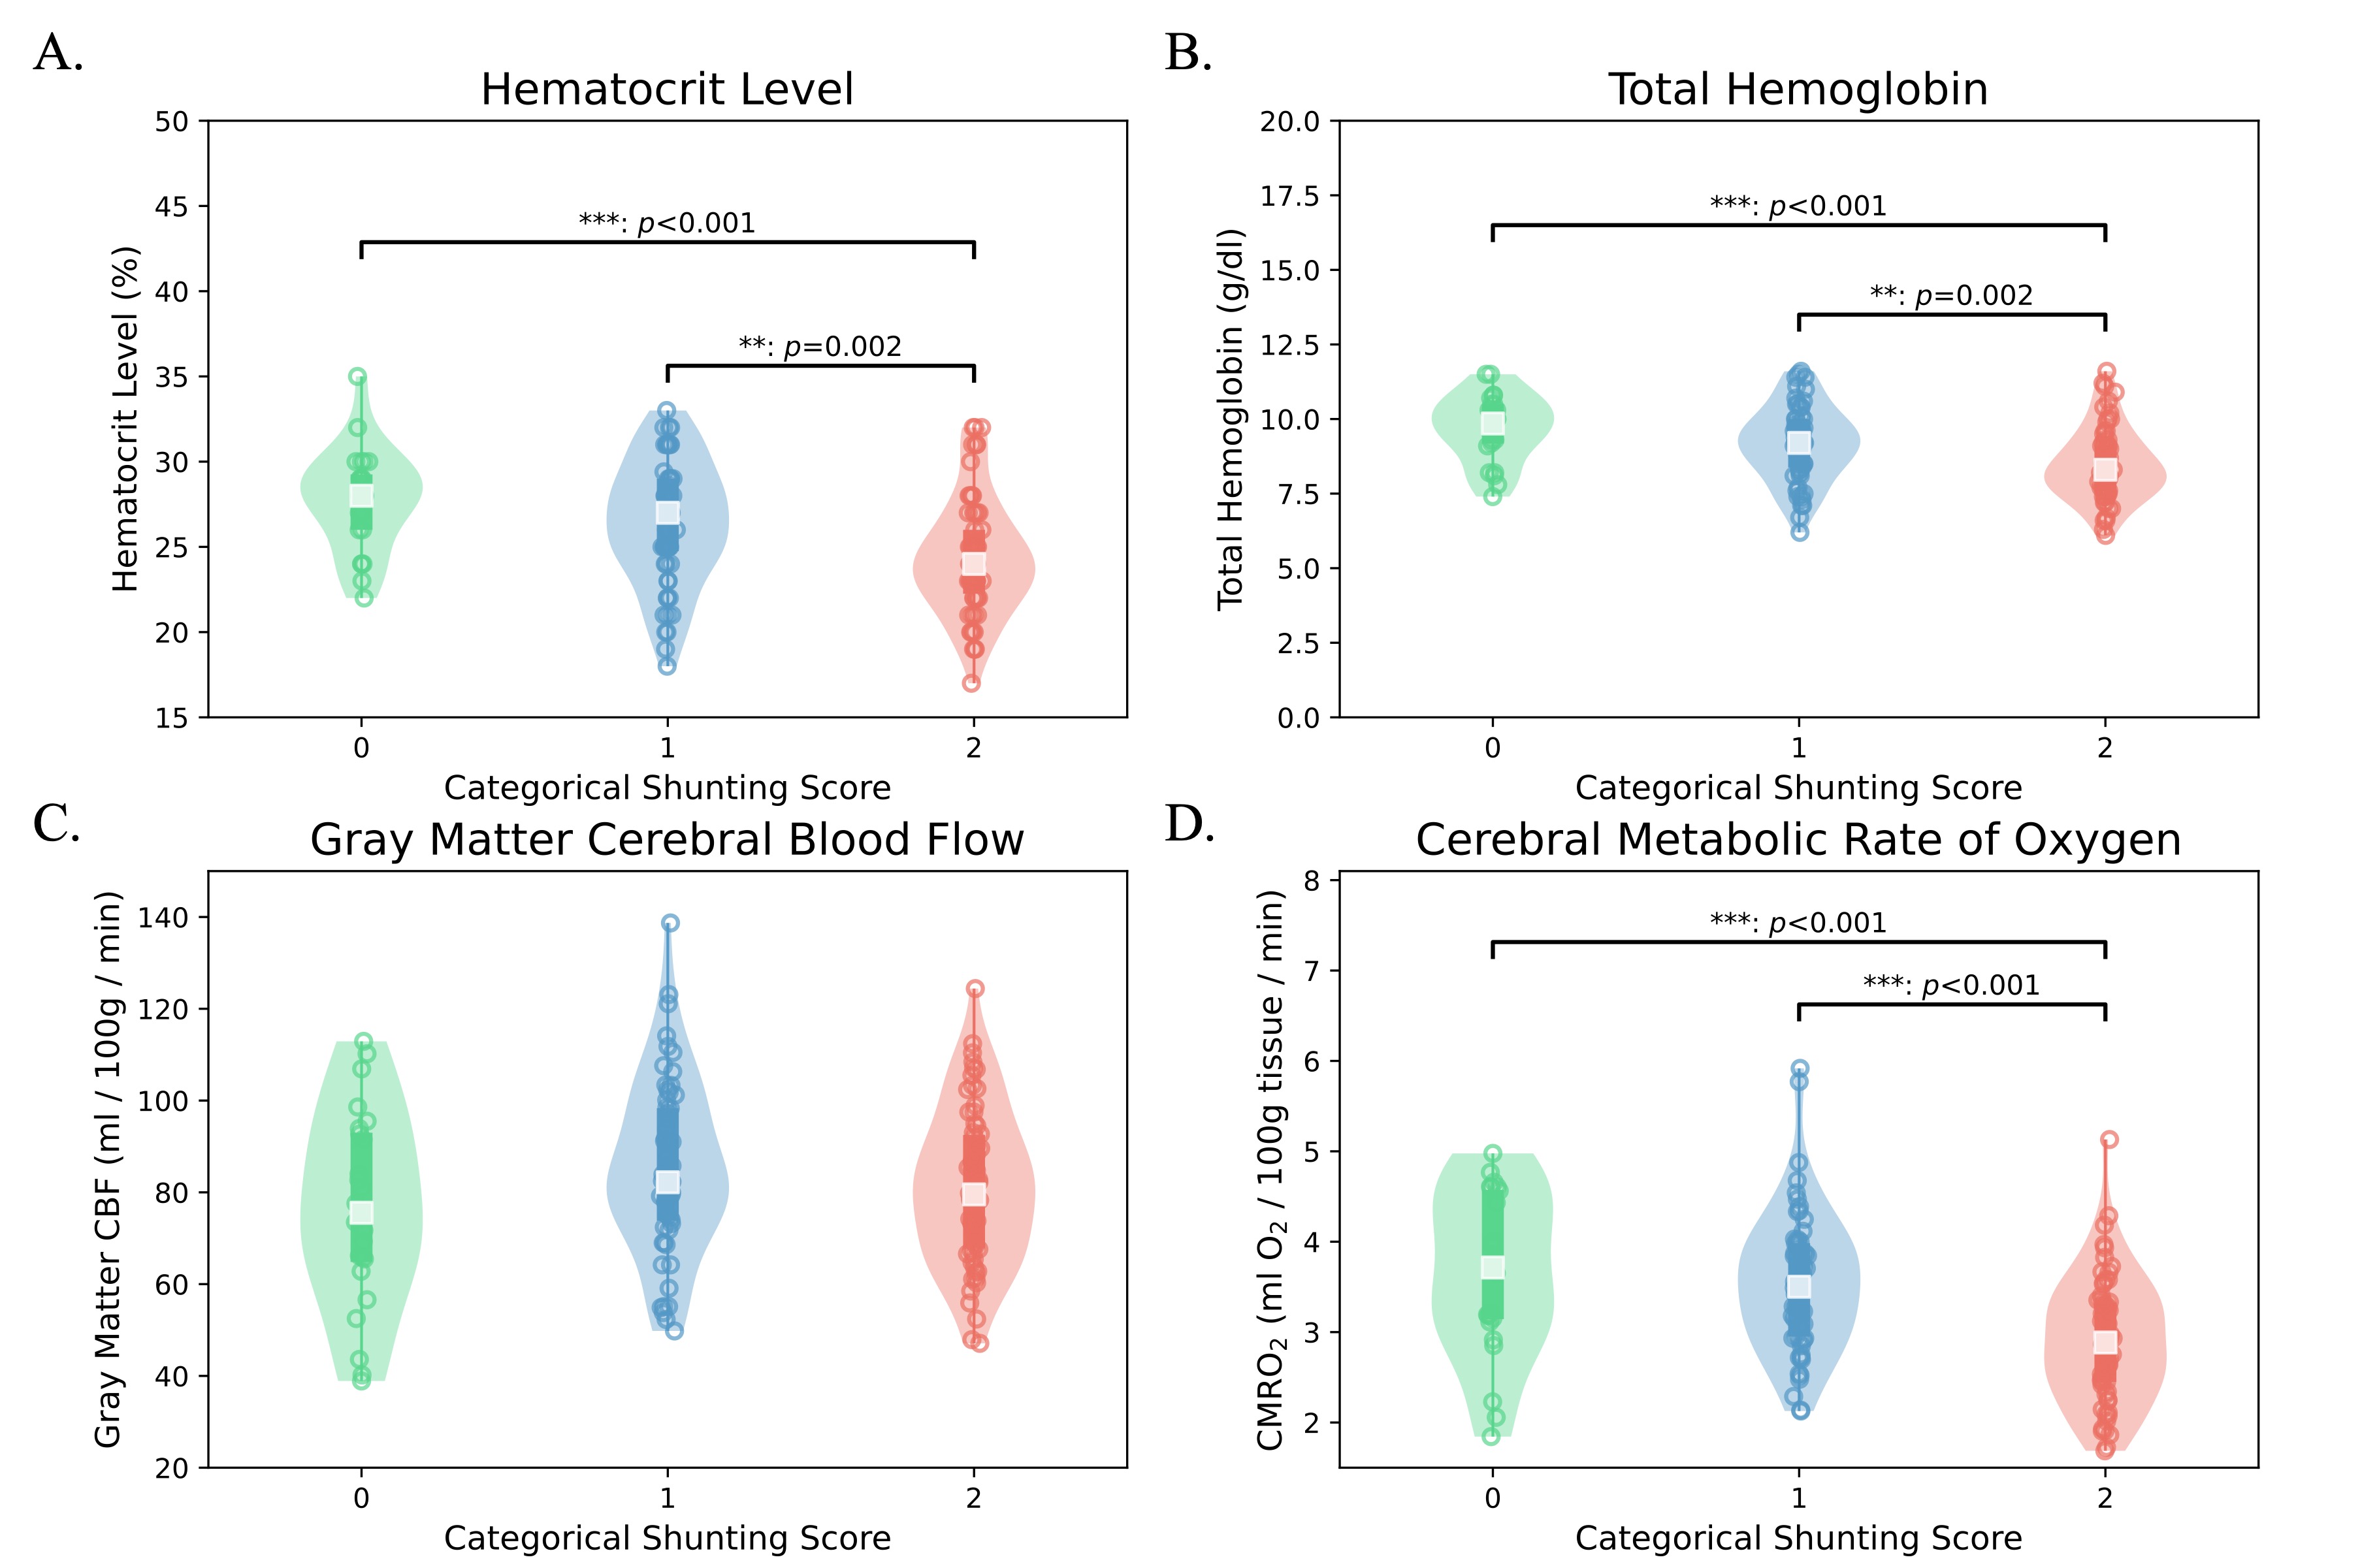
Table 1 summarizes patient demographics, clinical parameters, and imaging results for 150 SCA patients. Participants included adults and children (mean age=18.92±8.99 years), and were on either hydroxyurea or transfusion treatment. There were significant differences between the three groups in hematocrit (F=10.47; p<0.001; Fig. 2A), total hemoglobin levels (F=10.54; p<0.001; Fig. 2B), and CMRO2 (F=14.37; p<0.001; Fig. 2D). These differences were mainly driven by reductions of the above values in the cohort with diffuse hyperintensities (VHS=2). Subsequent Student’s t-tests revealed significant decreases of CMRO2 in VHS=2 compared to VHS=0 (t=4.13; p<0.001) and VHS=1(t=4.90; p<0.001). Multiple linear regressions revealed that age (β=0.012; p=0.011) predicted prior SCI; and no independent variable predicted prior overt stroke.Discussion
We evaluated how dural sinus hyperintensities present on pCASL data in SCA patients relate to CMRO2 and clinical indicators of disease severity. SCA patients with diffuse dural hyperintensities (VHS=2) had significantly lower CMRO2 than patients with little to no hyperintensities (VHS=0-1), suggesting that the capillary shunting effect seen may indeed reflect slightly reduced metabolism secondary to accelerated capillary transit; however, CMRO2 values across all VHS categories were in an approximately healthy range of 2.9-3.7 ml O2/100g/min. The presence of this feature was not associated with prior history of stroke or SCI. Additionally, the cohort with the most conspicuous dural sinus hyperintensities did not have the highest CBF, suggesting that this phenomenon is not a simple product of hyperemia. Ongoing work is focused on evaluating how quantitative measures of arterial circulation times in SCA relate to prospective infarct development.Conclusion
The CMRO2 was significantly lower in sickle cell anemia patients with diffuse dural sinus hyperintensities on arterial spin labeling; however, this value remained in an approximately healthy range and was not associated with increased silent or overt stroke history.Acknowledgements
No acknowledgement found.References
1. DeBaun MR, Armstrong FD, McKinstry RC, Ware RE, Vichinsky E, Kirkham FJ. Silent cerebral infarcts: a review on a prevalent and progressive cause of neurologic injury in sickle cell anemia. Blood. 2012;119(20):4587-4596. doi:10.1182/BLOOD-2011-02-272682
2. Ford AL, Ragan DK, Fellah S, et al. Silent infarcts in sickle cell disease occur in the border zone region and are associated with low cerebral blood flow. Blood. 2018;132(16):1714-1723. doi:10.1182/BLOOD-2018-04-841247
3. Jordan LC, Gindville MC, Scott AO, et al. Non-invasive imaging of oxygen extraction fraction in adults with sickle cell anaemia. Brain. 2016;139(Pt 3):738-750. doi:10.1093/BRAIN/AWV397
4. Juttukonda MR, Donahue MJ, Davis LT, et al. Preliminary evidence for cerebral capillary shunting in adults with sickle cell anemia. J Cereb Blood Flow Metab. 2019;39(6):1099-1110. doi:10.1177/0271678X17746808
5. Lu H, Ge Y. Quantitative evaluation of oxygenation in venous vessels using T2-Relaxation-Under-Spin-Tagging MRI. Magn Reson Med. 2008;60(2):357-363. doi:10.1002/MRM.21627
6. Buxton RB, Frank LR, Wong EC, Siewert B, Warach S, Edelman RR. A general kinetic model for quantitative perfusion imaging with arterial spin labeling. Magn Reson Med. 1998;40(3):383-396. doi:10.1002/MRM.1910400308
7. Juttukonda MR, Jordan LC, Gindville MC, et al. Cerebral hemodynamics and pseudo-continuous arterial spin labeling considerations in adults with sickle cell anemia. NMR Biomed. 2017;30(2). doi:10.1002/NBM.3681
Figures