2094
Brain abnormalities in systemic lupus erythematosus using an advanced multi-parametric MR imaging method of MULTIPLEX: a feasibility study1Department of Medical Imaging Center, Nanfang Hospital, Southern Medical University, Guangzhou, China, 2MR Collaboration, Central Research Institute, United Imaging Healthcare, Shanghai, China
Synopsis
Keywords: Head & Neck/ENT, Brain, Systemic lupus erythematosus
Quantitative MRI can measure a variety of physiological tissue parameters, such as longitudinal T1 value, transverse T2 value and proton density, iron content and fat content. We applied an advanced multi-parametric MR imaging technique of MULTIPLEX that provides the maps of T1, T2*, proton density and quantitative susceptibility mapping, to investigate the brain abnormalities in systemic lupus erythematosus (SLE). We found that the MULTIPLEX could provide comprehensive and quantitative assessment of SLE-related regions captured in multiple MRI parameters, which might assist in our understanding of the neuropathological mechanism of SLE.
Introduction
Systemic lupus erythematosus (SLE) is a mainly female inflammatory autoimmune disorder that can affect the central nervous system and cognitive functions in up to 80% of patients1. Quantitative MRI can measure a variety of physiological tissue parameters in human brain, such as longitudinal T1 value, transverse T2 value and proton density (PD), iron content and fat content. Due to the long scanning time and other reasons, conventional methods for measuring T1, T2 and PD values had limited clinical applicability2,3. Synthetic MRI is a derivative of quantitative MRI, including the MAGnetic resonance imaging compilation (MAGiC), MULTI-parametric MR imaging with fLEXible design (MULTIPLEX) and multiple dynamic multiple echo (MDME). It is able to get a variety of different contrast images and quantitative maps from one scan, which greatly reduces the scanning time and provide more quantitative information for disease diagnosis4. MULTIPLEX is a single-scan 3D multi-parametric MR imaging method, offering multiple sets of parametric maps including T1, T2*, PD and quantitative susceptibility mapping (QSM) with a scanning time of 7:15 minutes5. This study aimed to investigate its feasibility for the evaluation of brain abnormalities in SLE.Methods
We consecutively recruited 20 SLE patients (age: 29.6 ± 8.7 years, disease duration: 23.4 ± 26.3 years) and 25 healthy control (HC) subjects who underwent MULTIPLEX acquisition in a 3T MRI system (uMR 780, United Imaging Healthcare, Shanghai, China). First, we explored the feasibility of MULTIPLEX (7:15 minutes scan time) for its use in clinical routine imaging, focusing on image reconstruction, parameter estimation, and contrast-weighted image synthesis. Second, according to the automated anatomical labeling (AAL) atlas, the ROI-based analysis was conducted to extract quatitative parameters using histogram analysis and then identify abnormal T1, T2*, proton density maps and QSM values in the ten SLE-related regions including the precentral gyrus (PreCG), superior frontal gyri (SFG), middle frontal gyri (MFG), inferior parietal lobe (IPL), median cingulate and paracingulate gyri (MCG), posterior cingulate gyrus (PCG), middle temporal gyrus (MTG), Lingual gyrus (LING), fusiform gyrus (FFG) and hippocampus, obtained from our previous studies6,7. The flowchart of the study is illustrated in Figure 1.Results
The demographic characteristics and clinical assessment of all participants were summarized in Table 1. All image reconstruction and processing were automatically performed using in-house C++ programs on the ADEPT (United Imaging Healthcare, Shanghai, China) platform. The MULTIPLEX produced T1, T2*, PD maps and susceptibility-weighted images and the corresponding quantitative maps (1×1×1 mm3 voxel size) without any extra scan time. The ROI-based analysis revealed significantly decreased kurtosis and skewness of T1 in hippocampus, skewness of QSM in SFG, skewness of T2* in MFG and increased kurtosis of T2* in MFG, mean of T2* in IPL in SLE patients, compared to HC (all p values < 0.05, after false discovery rate correction; Figure 2). Moreover, the diagnostic performance of these six quantitative parameters was listed in Table 2, using the ROC analysis.Discussion & Conclusion
In brief, our study preliminarily revealed that multi-regional quantitative parameters using the MULTIPLEX technique identified brain abnormalities in SLE patients and showed their potential value in SLE diagnosis.Owing to the objective quantification of tissue properties and obvious reduction of the scanning time, simultaneous relaxometry techniques including synthetic MRI and MR fingerprinting (MRF) have seen a recent explosion of interest, to map multiple relaxation parameters in tissues8. They exhibited high reliability and repeatability in the quantification of relaxation parameters for standardized phantoms and in vivo. What’s more important, they showed potential clinical feasibility and applicability in some previous studies9,10. Ryu et al. found that routine clinical use of synthetic MRI can be feasible for neuroimaging in daily practice because of the acceptable overall image quality and conspicuity of anatomical details9. Another study proved that synthetic MR imaging can be an alternative to conventional MR imaging for generating diagnostic PD-, T1-, and T2-weighted images in patients with multiple sclerosis and controls while additionally delivering fast and robust volumetric measurements suitable for multiple sclerosis studies10. With a dual-repetition time, dual flip angle, and multi-echo gradient echo-based design, the MULTIPLEX can offer multiple sets of parametric maps including T1, T2*, PD and QSM5. In our study, multiparametric and multiregional abnormalities were identified using the MULTIPLEX in SLE patients, which might shed light on our understanding of different imaging manifestations.
In conclusion, MULTIPLEX could provide comprehensive and quantitative assessment of SLE-related regions captured in multiple MR imaging parameters. It has potential to assist in SLE diagnosis and better understanding of the neuropathological mechanism of SLE.
Acknowledgements
This work was supported by the National Natural Science Foundation of China (grant number 81701639).References
1. Kaul A, Gordon C, Crow MK, et al. Systemic lupus erythematosus. Nat Rev Dis Primers. 2016;2:16039.
2. Bydder GM, Young IR. MR imaging: clinical use of the inversion recovery sequence. J Comput Assist Tomogr. 1985;9:659-675.
3. Taylor AJ, Salerno M, Dharmakumar R, Jerosch-Herold M. T1 Mapping Basic Techniques and Clinical Applications. Jacc-Cardiovascular Imaging. 2016;9:67-81.
4. Tanenbaum LN, Tsiouris AJ, Johnson AN, et al. Synthetic MRI for Clinical Neuroimaging: Results of the Magnetic Resonance Image Compilation (MAGiC) Prospective, Multicenter, Multireader Trial. American Journal of Neuroradiology. 2017;38:1103-1110.
5. Ye Y, Lyu J, Hu Y, et al. MULTI-parametric MR imaging with fLEXible design (MULTIPLEX). Magn Reson Med. 2022;87:658-73.
6. Zhao L, Tan X, Wang J, et al. Brain white matter structural networks in patients with non-neuropsychiatric systemic lupus erythematosus. Brain Imaging Behav. 2018;12(1):142-155.
7. Niu C, Tan X, Liu X, et al. Cortical thickness reductions associate with abnormal resting-state functional connectivity in non-neuropsychiatric systemic lupus erythematosus. Brain Imaging Behav. 2018;12(3):674-684.
8. Ma D, Gulani V, Seiberlich N, et al. Magnetic resonance fingerprinting. Nature. 2013;495:187-192.
9. Ryu KH, Baek HJ, Moon JI, et al. Initial clinical experience of synthetic MRI as a routine neuroimaging protocol in daily practice: A single-center study. J Neuroradiol. 2020;47:151-160.
10. Granberg T, Uppman M, Hashim F, et al. Clinical Feasibility of Synthetic MRI in Multiple Sclerosis: A Diagnostic and Volumetric Validation Study. AJNR Am J Neuroradiol. 2016;37:1023-1029.
Figures
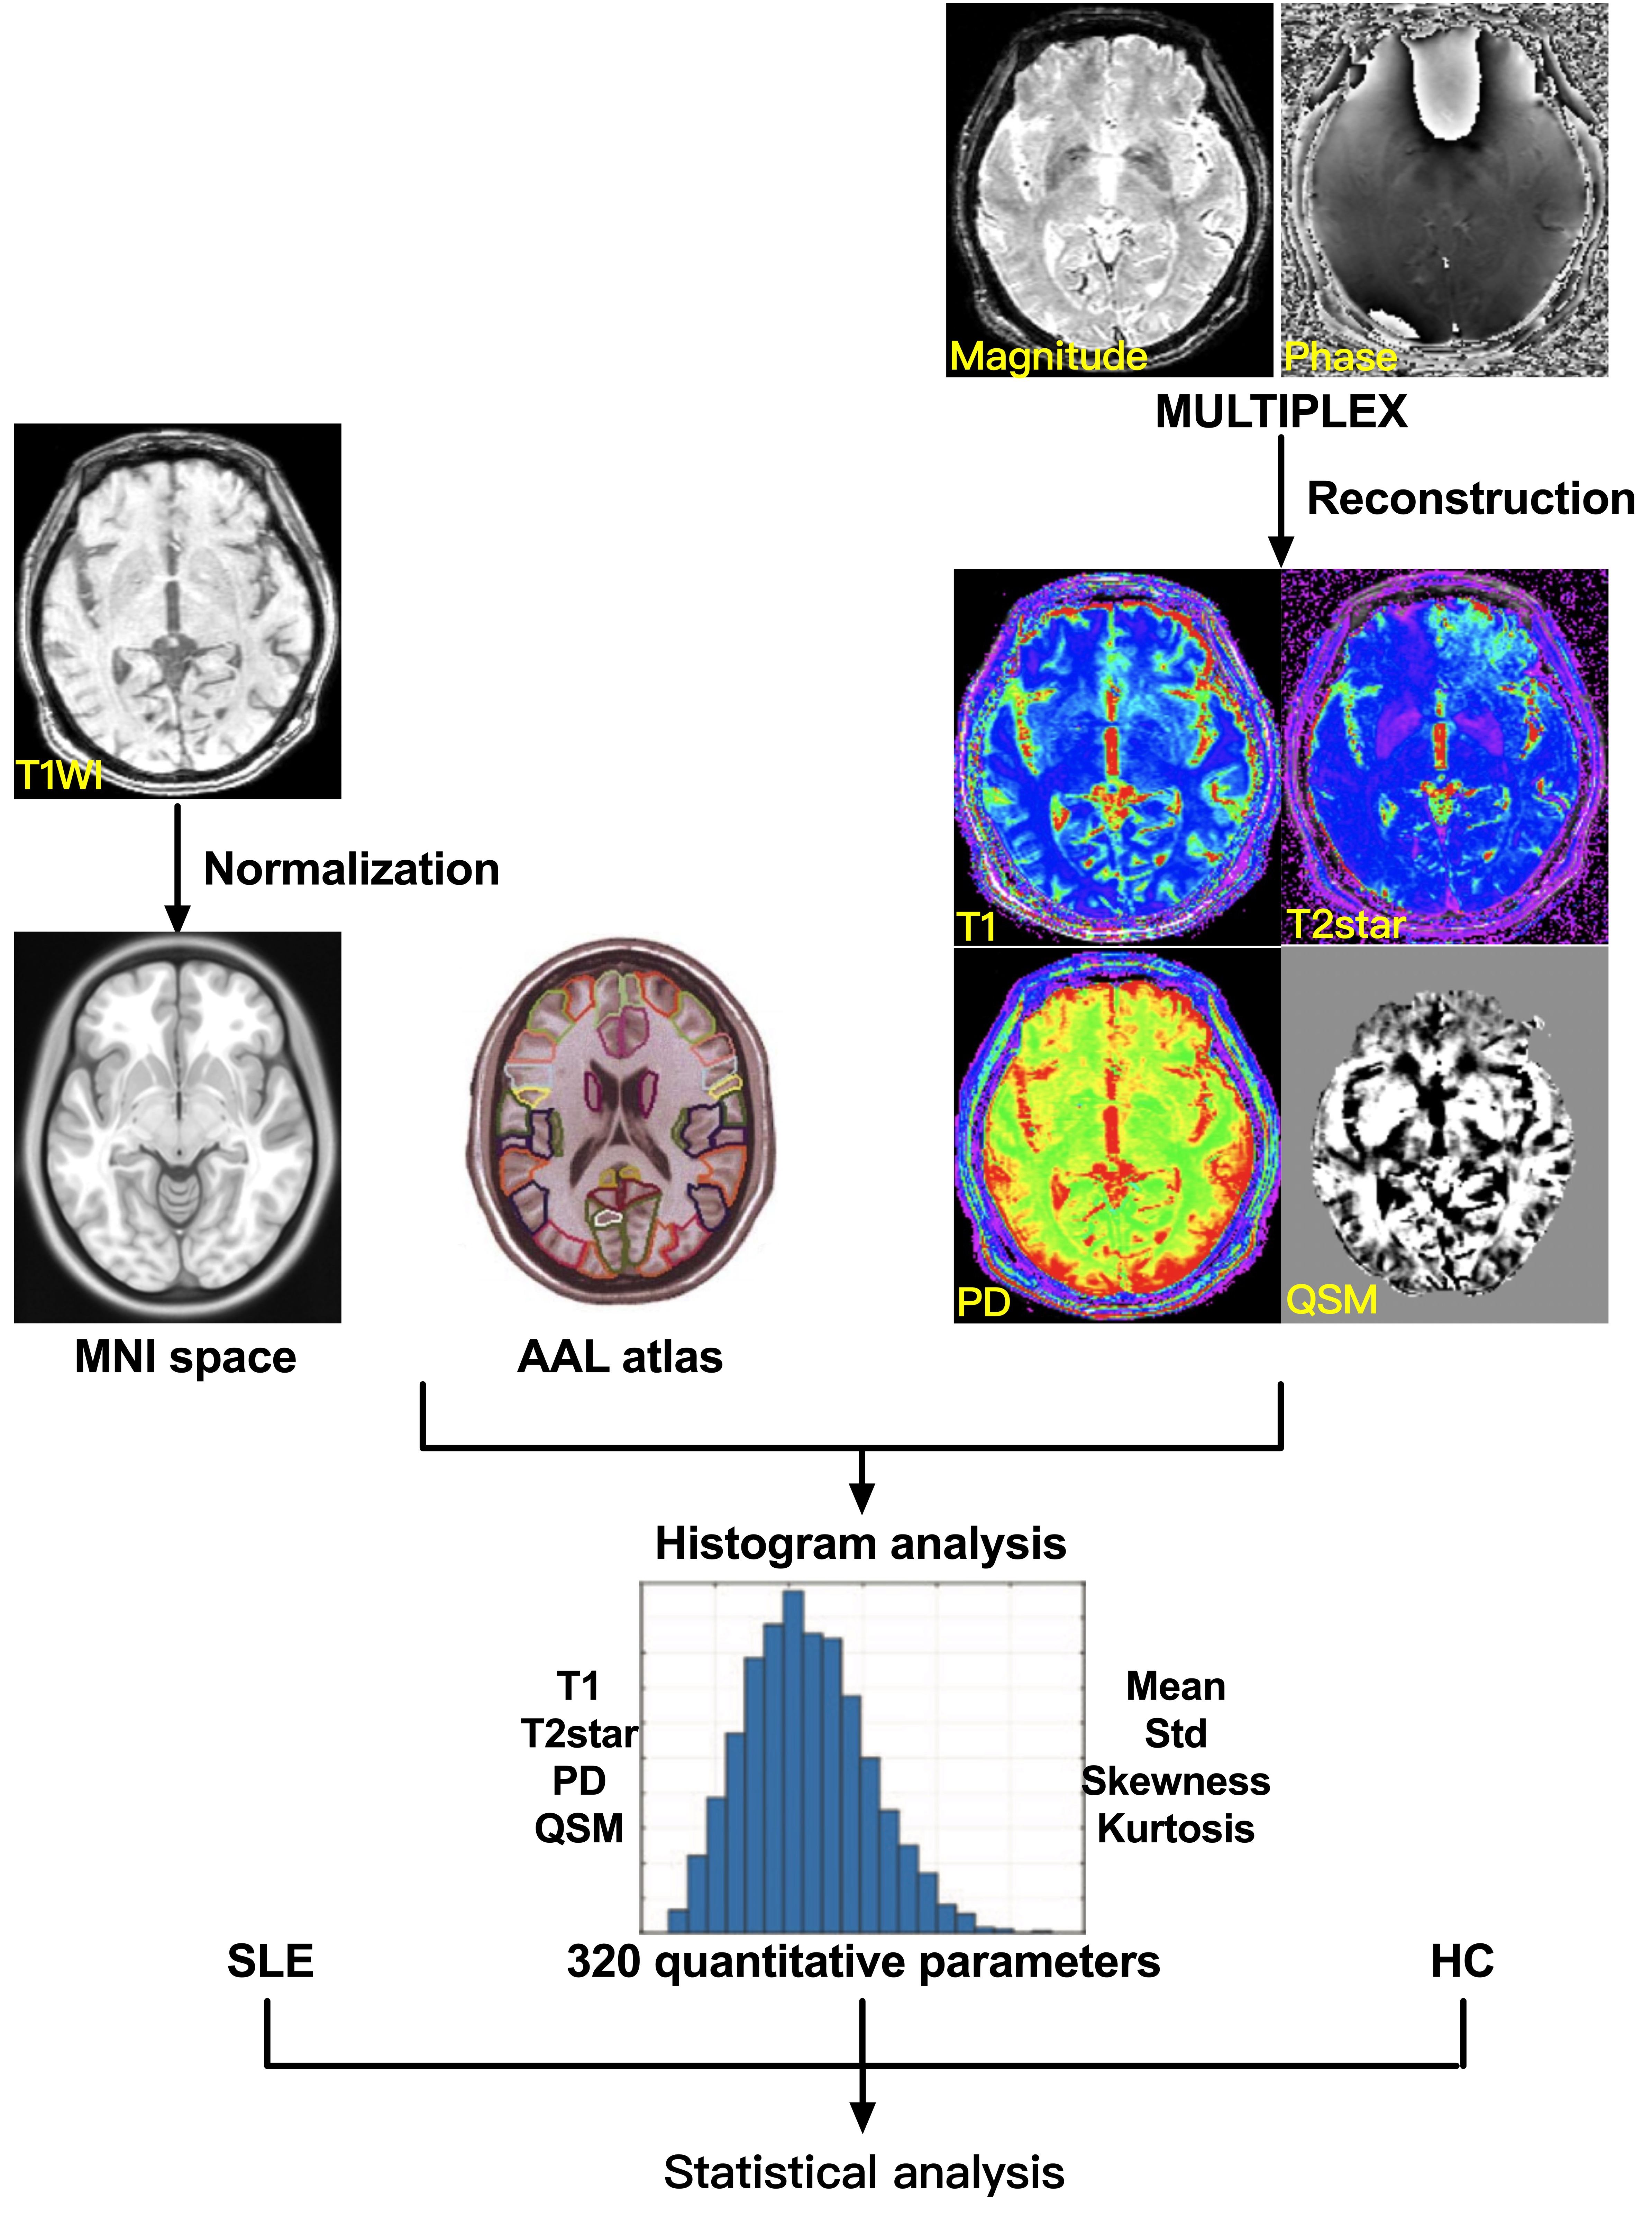
Figure 1: The flowchart of image analysis.
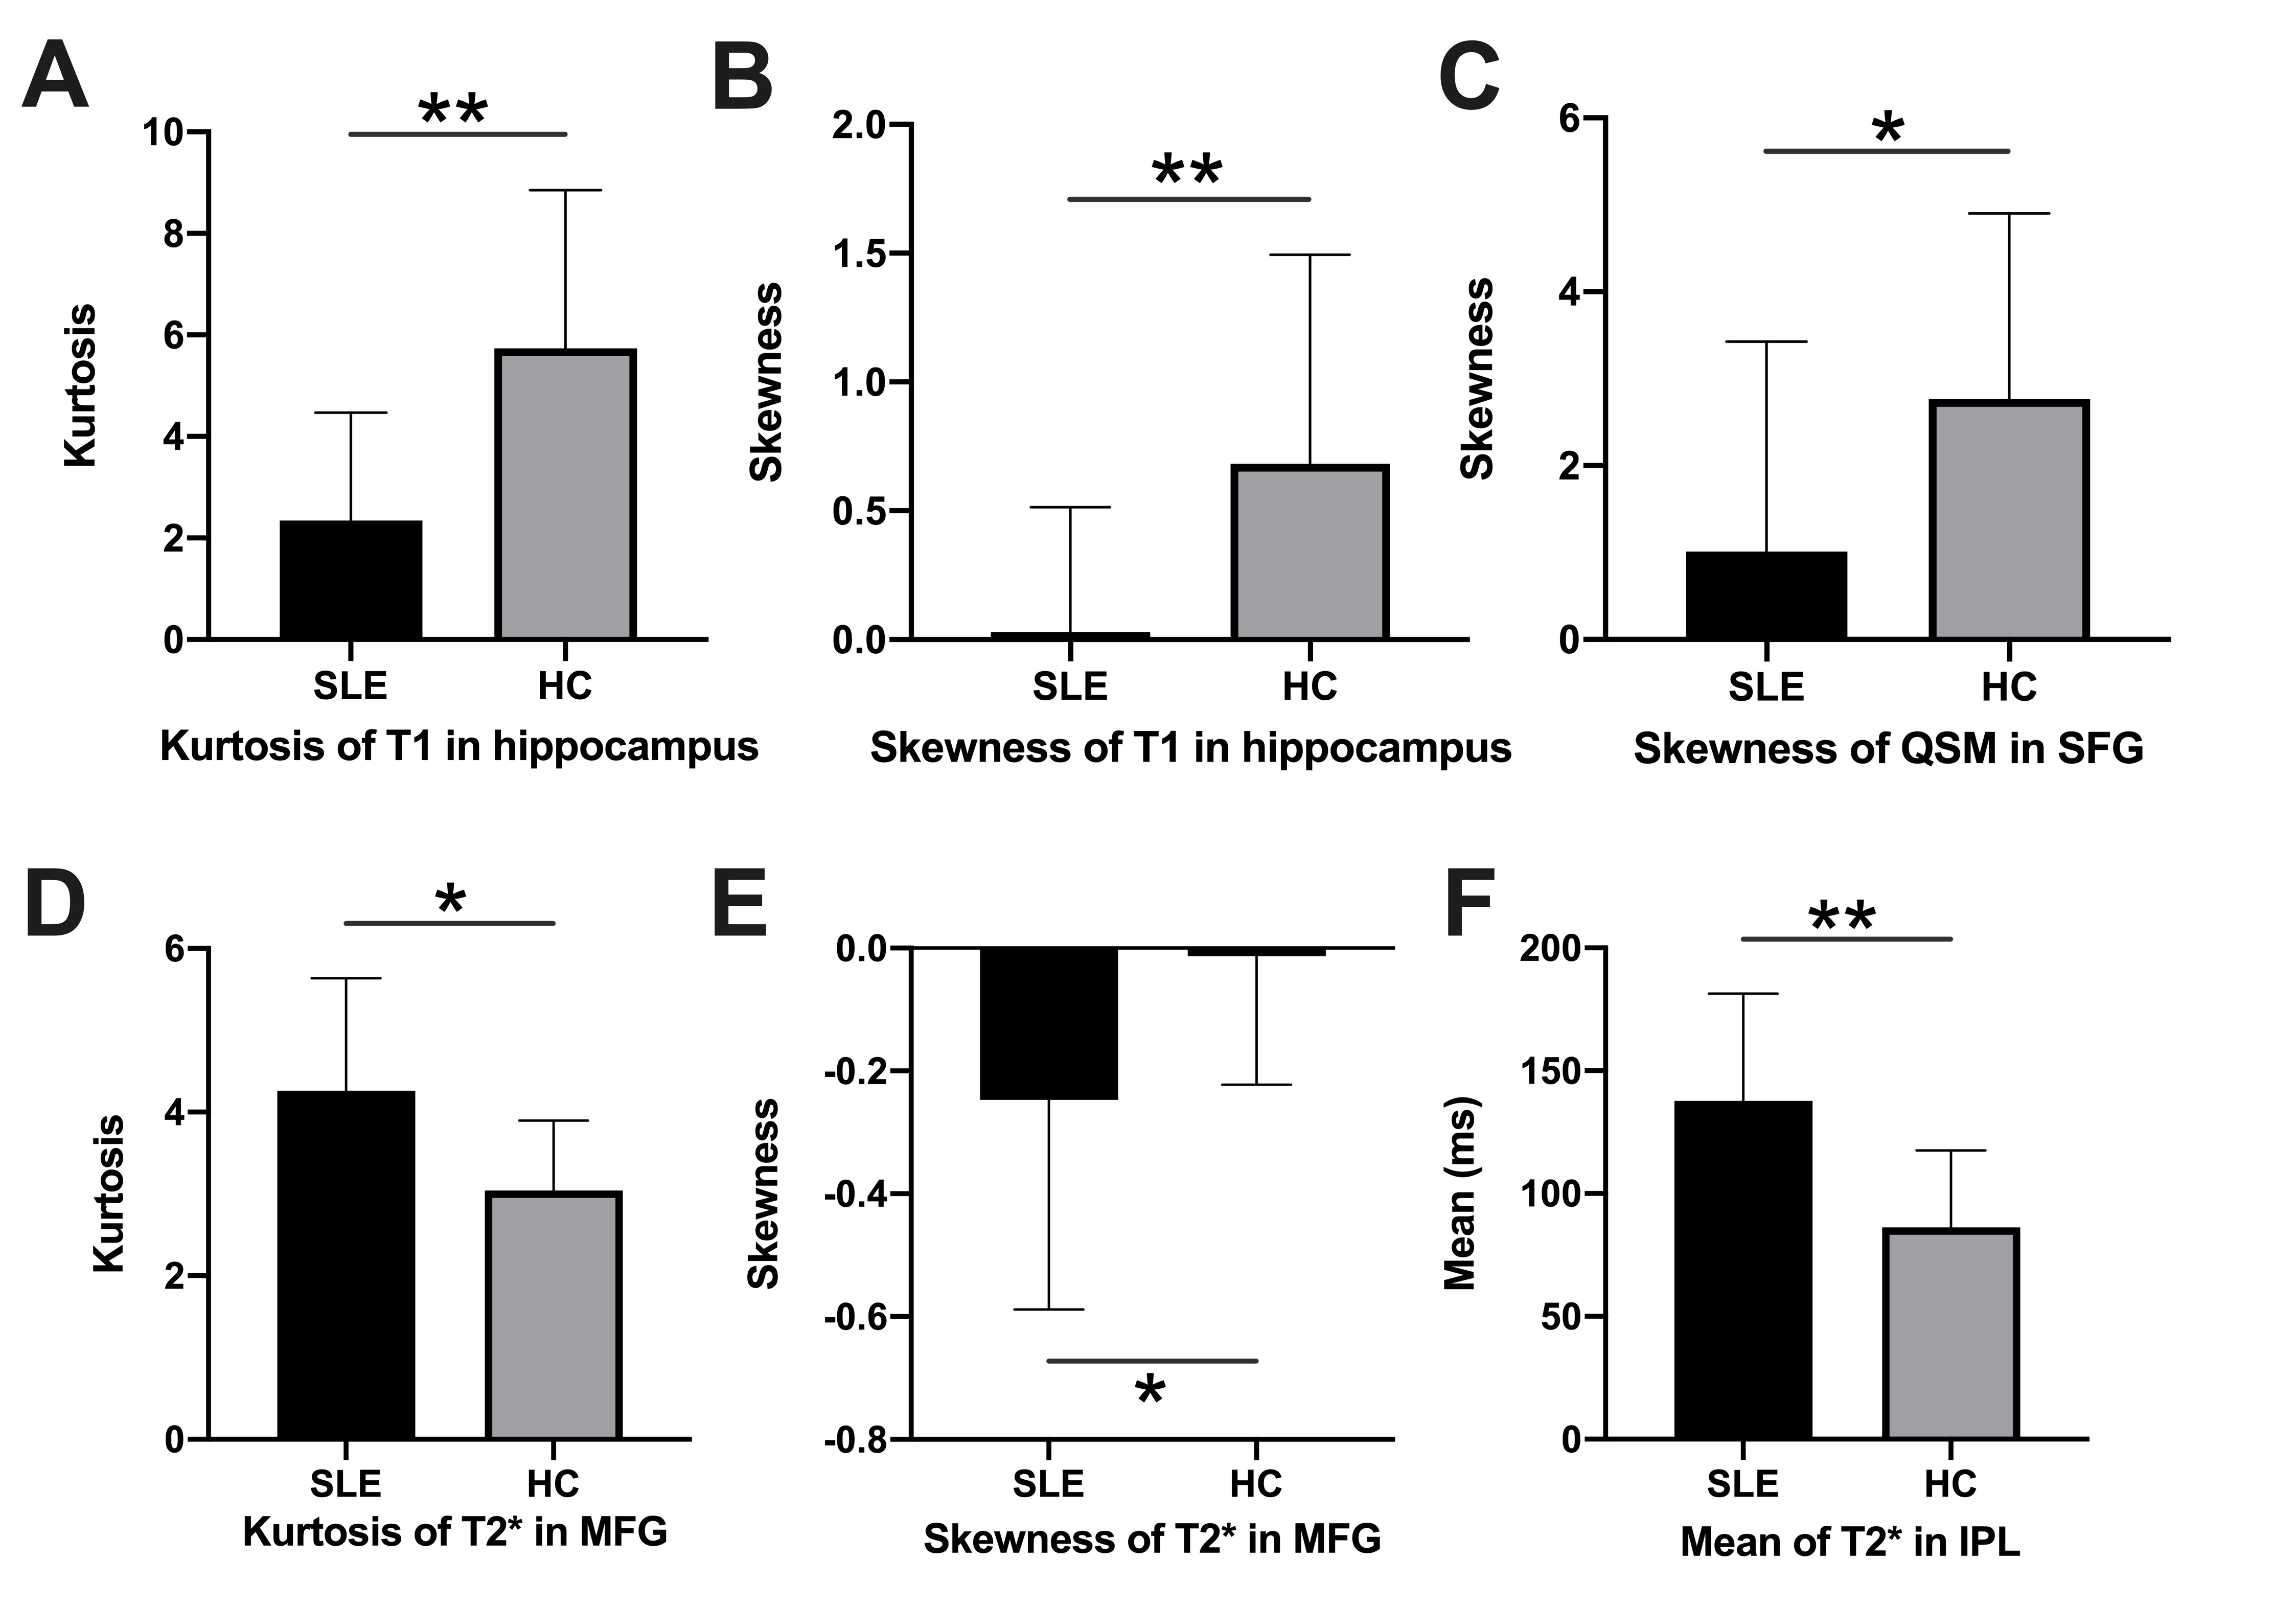
Figure 2: The comparisons of quantitative parameters between patients with systemic lupus erythematosus (SLE) and healthy controls (HC).
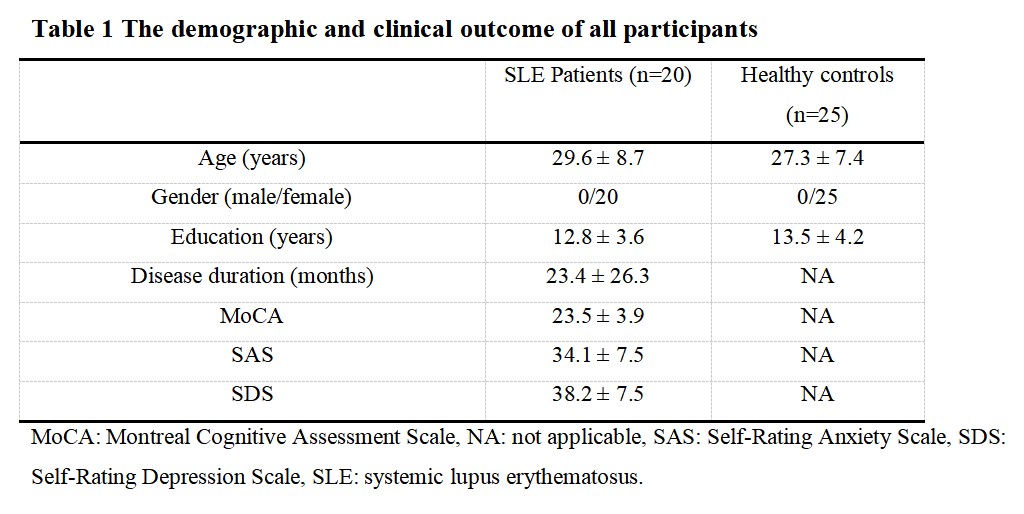
Table 1: The demographic and clinical outcome of all participants.
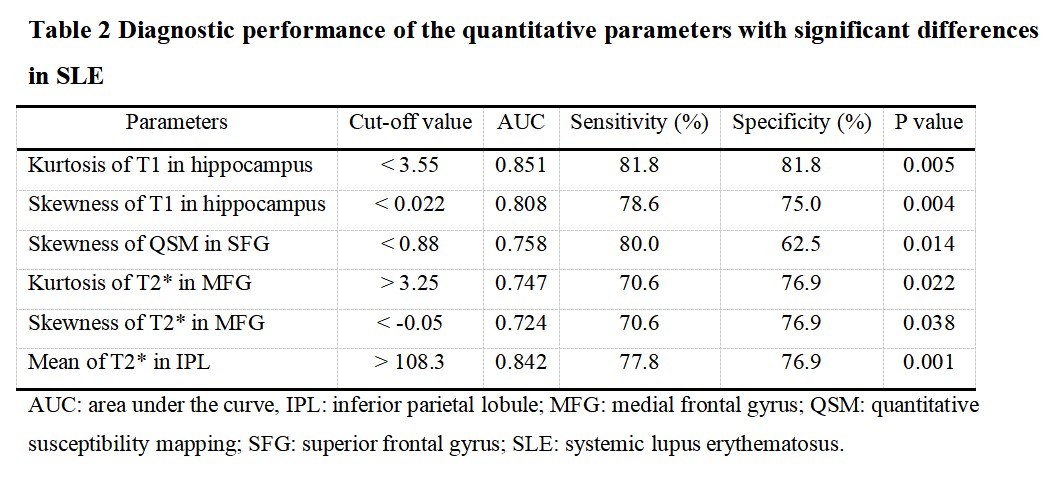
Table 2: Diagnostic performance of the quantitative parameters with significant differences in SLE.