2089
Comparison of post mortem in situ and in vivo intravoxel incoherent motion of the human brain1Institute of Forensic Medicine of the University of Basel, Department of Biomedical Engineering, Basel, Switzerland, 2Institute of Forensic Medicine of the University of Basel, Health Department Basel-Stadt, Basel, Switzerland
Synopsis
Keywords: Head & Neck/ENT, Diffusion/other diffusion imaging techniques
Performing intravoxel incoherent motion (IVIM) magnetic resonance imaging offers the possibility to differentiate various diffusion processes according to their varying molecule speeds. In this study, the IVIM parameters perfusion fraction, diffusion and pseudo-diffusion were determined in the human brain for 12 post mortem in situ and 2 in vivo cases. Our results show that the IVIM parameters decrease after death and that they are higher in gray matter than in white matter. Besides, the age at death, the core temperature of the subjects and the post mortem interval have an effect on the post mortem IVIM parameters.Introduction
By using intravoxel incoherent motion (IVIM) magnetic resonance imaging (MRI), different diffusion processes can be quantified according to varying molecule speeds. The signal decay of IVIM depends on the perfusion fraction (f) and the coefficients for diffusion (D) and pseudo-diffusion (D*) 1,2. Several models, for example the kurtosis (K) model, exist to consider the non-Gaussian behavior of the diffusion caused by tissue structures like cellular compartments or membranes 2,3,4. In this study, the effect of IVIM on human in situ post mortem (PM) diffusion parameters of the brain was analyzed and possible influencing factors were investigated to enhance the insight into the underlying properties. Furthermore, PM and in vivo IVIM parameters were compared to identify their differences.Materials and Methods
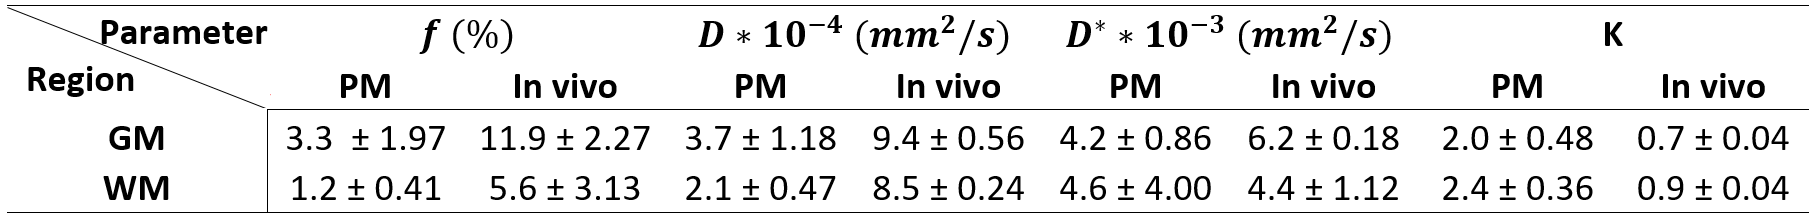
In this study, 12 deceased and 2 living subjects were included. Age at death, rectal core temperature and post mortem interval (PMI) distributions of the deceased are shown in Table 1. The PM brain scans were performed in situ and on the same 3 T MRI scanner used for the in vivo subjects. A diffusion-weighted single-shot-echo-planar imaging sequence with 6 isotropically distributed directions was acquired at 16 b-values (0, 20, 40, 60, 80, 100, 120, 140, 160, 180, 200, 500, 1000, 1500, 2000, 2500 s/mm²). The following two-step model was applied for the IVIM analysis: Firstly, D and K were determined for high b-values (> 200 s/mm²), secondly, they were kept constant in order to calculate f and D* for all b-values. The fittings were performed for white matter (WM) and gray matter (GM), separately, after automatic segmentation of these regions. For the statistical analysis of the PM cases, the Shapiro-Wilk test5 was applied to test the datasets for normality before correlations were determined with the correlation coefficient r and the p-value (significance level at p = 0.05) 6. The software MATLAB R2018 (The MathWorks, Inc., Natick, MA, United States) and FSL 6.0.0 (FMRIB Software Library, Analysis Group7) were used for analyses.Results
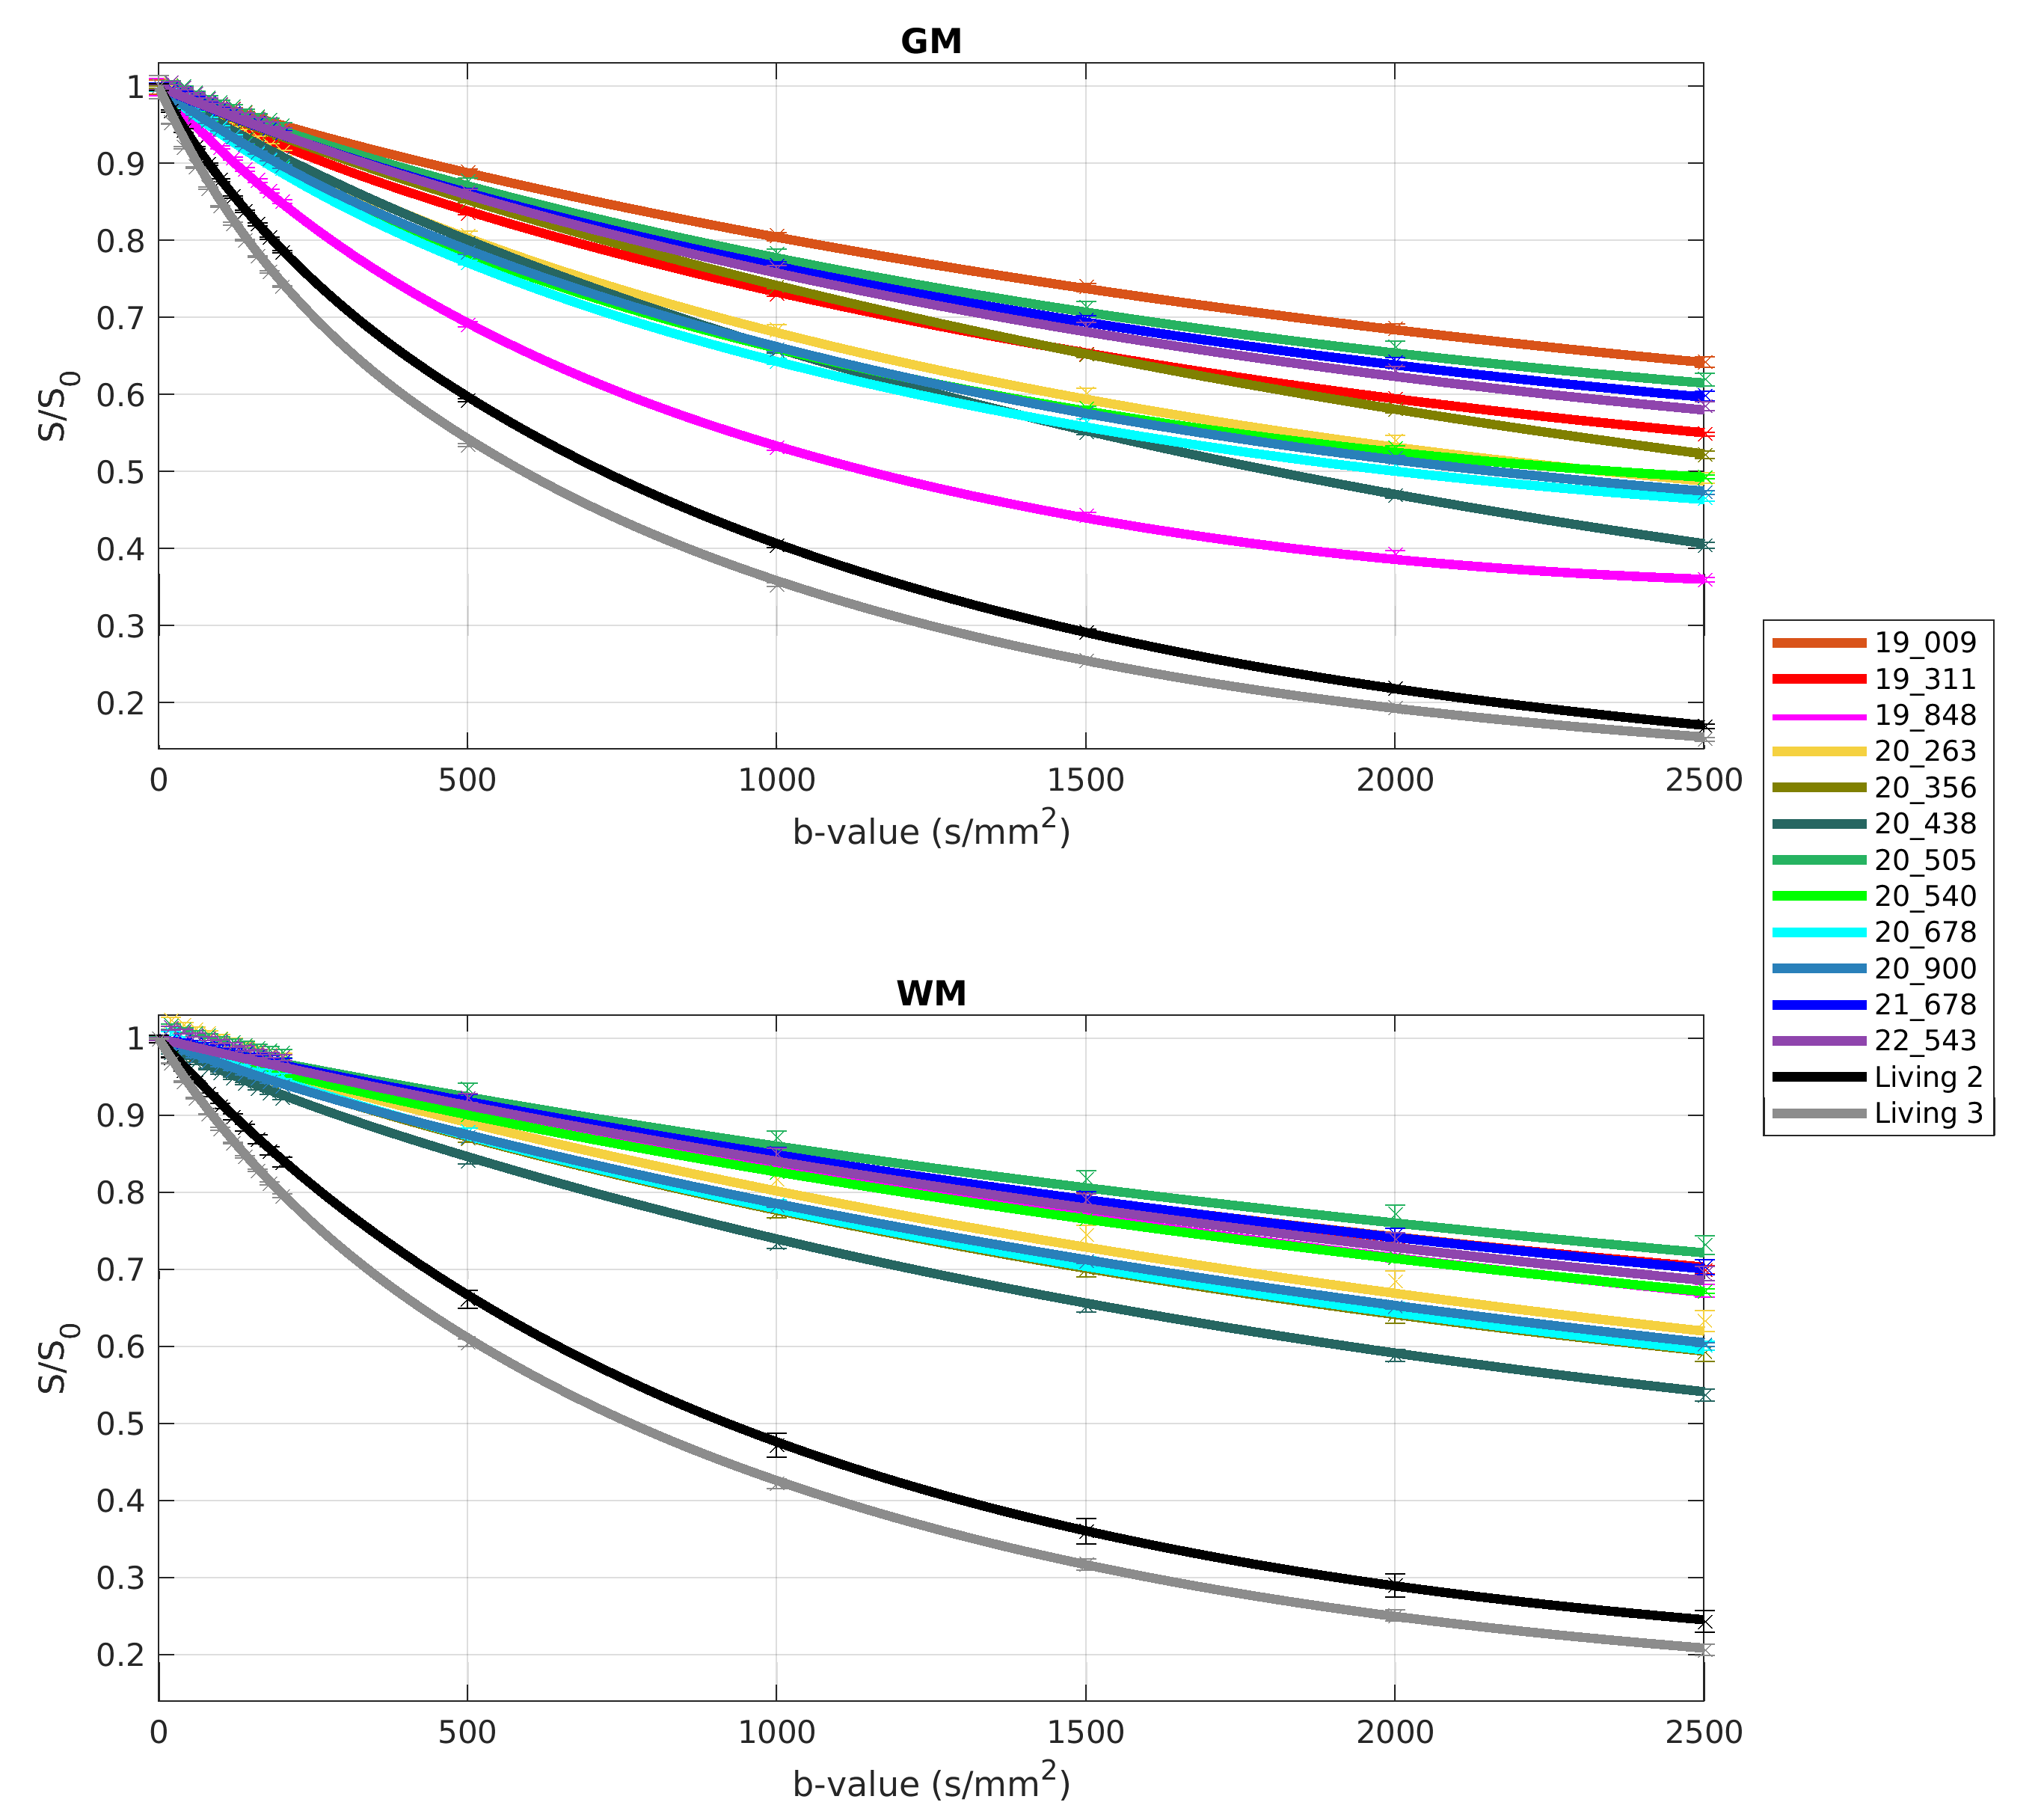
The fits for PM cases showed a slower decay than those for the living subjects in WM with good intra-group congruence and inter-group difference (see Figure 1). In GM, these separations were restricted by the fit of case PM 3, which lay between the further PM and the in vivo cases.An overview of the resulting averaged IVIM coefficients is presented in Table 2. Successful fittings with the kurtosis model were assumed as the product of D, K and b-value was less than 3 in all cases 2. For the PM cases, lower values were obtained for f and D compared to the in vivo subjects. This behavior was also found for D* in GM, while in WM, D* was similar in both groups. The values for f and D were higher in GM than in WM. The same accounted for D* for the in vivo group, while D* was similar in GM and WM for PM cases. K was higher for PM cases than in vivo and higher in WM than in GM.
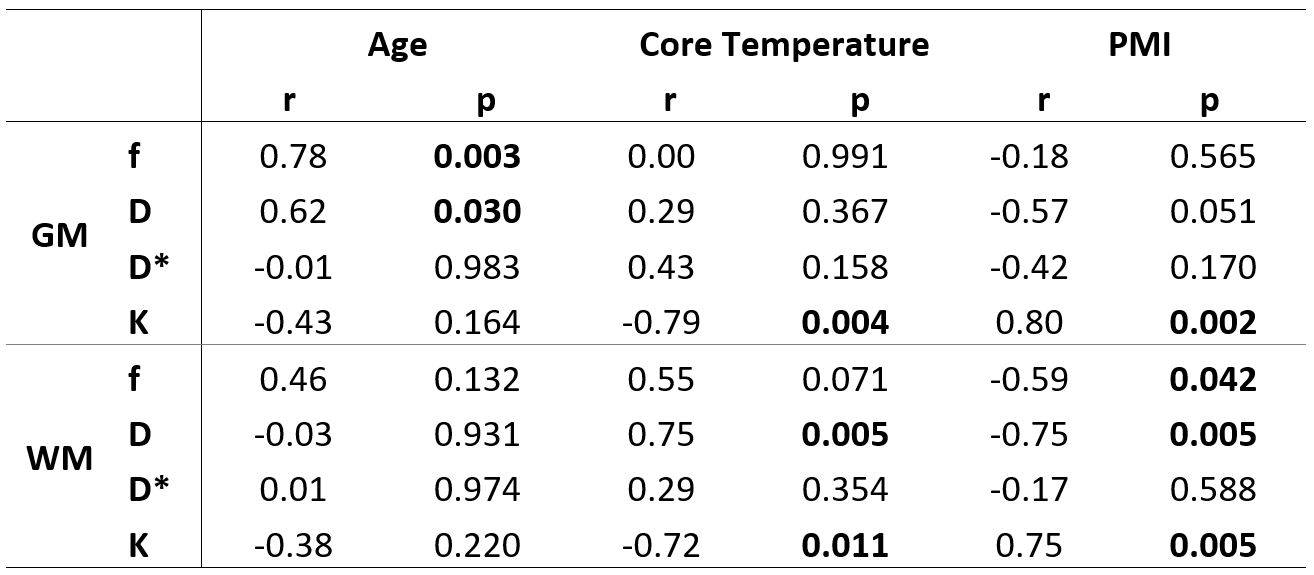
The statistical analysis of the PM cases showed statistically significant correlations between age and f in GM, age and D in GM, temperature and D in WM, PMI and f in WM and PMI and D in WM (Table 3). Besides, the correlations between temperature and K as well as PMI and K were statistically significant.
Discussion
The steeper fitting curve of case PM 3 in GM can be explained by its excessive brain atrophy, which was attested during autopsy.Although the blood flow is missing, f does not level to 0% after death. To the same conclusion came von Deuster et al.8 in a post mortem study of porcine hearts. The influence of age at death on f and D can be explained by the fact that with increasing age of adults, the brain shrinks as a natural process, which causes alterations of brain volume and mass, especially in GM 9,10. The temperature dependence of D agrees with the Einstein derivation of the Brownian motion 11,12. The degradation, which accompanies the PMI, has an effect on the glial cells and, hence, the WM, due to autolytic changes 13. D* seems to be influenced by fatal intoxications, which are accompanied by cytotoxic cerebral edema (see its high standard deviation in Table 2). As both the temperature and the PMI have an effect on K, they influence the tissue structure of the diffusion barriers 4,11,13. The resulting IVIM parameters for the in vivo subjects correspond well with the already published results 4,9.
Conclusion
The IVIM parameters of PM cases are lower than those of living subjects and higher in GM than in WM. While we were able to quantify the effect of age at death, core temperature of the subjects and PMI on the PM IVIM parameters, also the cause of death should be kept in mind as an influencing factor.Acknowledgements
No acknowledgement found.References
1. Le Bihan, D, et al. MR imaging of intravoxel incoherent motions: application to diffusion and perfusion in neurologic disorders. Radiology, 1986, 161(2), 401-407.
2. Le Bihan, D. What can we see with IVIM MRI?. NeuroImage, 2019, 187, 56-67.
3. Chabert, S, et al. Relevance of the information about the diffusion distribution in vivo given by kurtosis in q-space imaging. In Proceedings of the 12th Annual Meeting of ISMRM, Kyoto, Japan, 2004, Vol. 1238.
4. Jensen, JH, et al. Diffusional kurtosis imaging: the quantification of non‐gaussian water diffusion by means of magnetic resonance imaging. Magnetic Resonance in Medicine, 2005, 53.6: 1432-1440.
5. BenSaïda, A. Shapiro-Wilk and Shapiro-Francia normality tests. https://ch.mathworks.com/matlabcentral/fileexchange/13964-shapiro-wilk-and-shapiro-francia-normality-tests?s_tid=prof_contriblnk. MATLAB Central File Exchange, 2009.
6. Nagel, F. Point biserial correlation. https:// www.mathworks.com/matlabcentral/fileexchange/11222-point-biserial-correlation. MATLAB Central File Exchange, 2006.
7. Jenkinson, M, et al. Fsl, NeuroImage, 2012, 62 (2) 782–790.
8. von Deuster, C, et al. Verification of the intra‐voxel incoherent motion (IVIM) model in the porcine heart. In Proceedings of the 23rd Annual Meeting of ISMRM, Toronto, Canada, 2015.
9. Vieni, C, et al. Effect of intravoxel incoherent motion on diffusion parameters in normal brain. NeuroImage, 2020, 204, 116228.
10. Sungura, R, et al. The extended scope of neuroimaging and prospects in brain atrophy mitigation: a systematic review. Interdisciplinary Neurosurgery 23, 2021: 100875.
11. Berger, C, et al. Post mortem brain temperature and its influence on quantitative MRI of the brain. Magnetic Resonance Materials in Physics, Biology and Medicine 35.3, 2022: 375-387.
12. Einstein A et al. Investigations on the theory of the Brownian movement. Methuen & Co. ltd., London, 1926.
13. D’Arceuil, H, and de Crespigny, A. The effects of brain tissue decomposition on diffusion tensor imaging and tractography. NeuroImage 36.1, 2007: 64-68.
Figures