2086
Quantitative Microstructure Mapping of Head and Neck Squamous Cell Carcinoma Using Time-Dependent Diffusion MRI: A Preliminary Study1Department of Radiology, Beijing Tongren Hospital, Capital Medical University, Beijing, China, Beijing, China, 2MR collaborations, Siemens Healthcare, Beijing, China, Beijing, China, 3Siemens Healthcare GmbH,Neurology Applications Development, Erlangen, Germany, Erlangen, Germany, 4Department of Otolaryngology Head and Neck Surgery, Beijing Tongren Hospital, Capital Medical University, China, Beijing, China
Synopsis
Keywords: Head & Neck/ENT, Head & Neck/ENT
This study investigated the feasibility of IMPULSED(Imaging Microstructural Parameters Using Limited Spectrally Edited Diffusion) to evaluate cell microstructure of head and neck squamous cell carcinoma. The results showed that mean cell diameter, extracellular diffusion coefficient and intracellular volume fraction are 9.47±3.33 µm,1.95±1.04μm²/ms and 0.23±0.14% respectively and consistent with the previous pathological reports. Patients with cervical lymph node metastases had significantly smaller mean cell diameters than those without metastases. Mean cell diameter decreased with increasing cycles of immunotherapy. This suggests that IMPULSED can quantitatively characterize cell properties of tumor in head and neck squamous cell carcinoma patients.Introduction
Head and neck squamous cell carcinoma (HNSCC) accounts for 90% of head and neck tumors1. Despite advances in surgery and chemotherapy, the median overall survival of patients with recurrent or metastatic HNSCC is only 10–13 months2. In recent years, cancer immunotherapies have emerged as effective treatment options for a variety of advanced cancers including head and neck squamous cell carcinomas3. Identifying of patients who do not respond to immunotherapy at the initiation or early stage of treatment can prompt the discontinuation of ineffective therapy. However, immunotherapies have demonstrated unique response patterns such as pseudoprogression which may be misdiagnosed as progressive disease by traditional response criteria4 and lead to effective treatment discontinuation. The pseudoprogression is a result of increased cytotoxic T cell infiltration into tumors5. Therefore, non-invasive and longitudinal monitoring of T cell infiltration are important for immunotherapies effects evaluation. The concept that sufficiently large influx of tumor infiltrating T cells, which have a smaller diameter than cancer cells, will decrease the average size of cells within a volume has been validated in a mouse model of colon adenocarcinoma6. In this study, we tried to validate this concept and quantify the microstructure characterization including cell diameter by time-dependent diffusion MRI in patients with HNSCC.Method
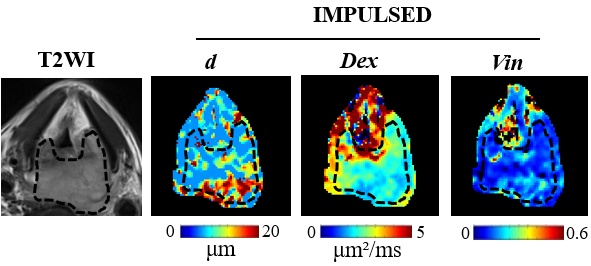
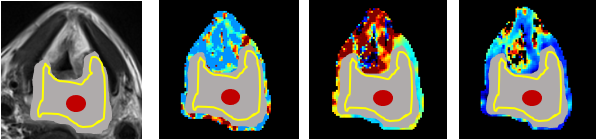
This study recruited 8 HNSCC patients including 5 hypopharyngeal carcinoma,1 nasopharyngeal carcinoma,1oropharynx carcinoma and 1 laryngeal carcinoma. Six of the eight patients had lymph node metastasis. All patients underwent MRI on a 3.0 T (MAGNETOM Prisma, Siemens Healthcare, Erlangen, Germany) before surgery. The time-dependent diffusion MRI technique requires the acquisition of diffusion MRI signals at different diffusion times to capture the time dependence in the different microstructural compositions of diffusion by using oscillatory gradient spin echo (OGSE) and pulsed gradient spin echo sequences. The parameters are as follows: TR=3000ms; TE=118ms; FOV=250 × 250 mm2; matrix=162×162, number of slices =20, slice thickness=5.0 mm. OGSE data were acquired at oscillating frequencies of 50Hz(2 cycles, b=100,200and 300sec/mm2) and 25Hz(1 cycle ,b= 250,500,750 and 1000sec/mm2), and pulsed-gradient spin-echo-at diffusion duration and separation of 8msec and 46msec, respectively(b=250,500,750,1000,1400 and 1800sec/mm2). Total scanning time was less than 15 minutes. The parameter maps of mean cell diameter(d), intracellular volume fraction(Vin), and extracellular diffusion coefficient(Dex)were generated (Fig 1). Three different regions of interest (ROI)methods were drawn on the parameter maps excluding the boundary voxels to avoid the partial volume effect: (1) the ROI was drawn on the largest tumor section area; (2) a small ROI (area range, 20 mm2) was placed at the center of the largest slice of the tumor ;(3) a hollow ROI was drawn along the edge of the largest slice of the tumor. The parameters were recorded as dCenter(dC), dEdge(dE), dLargestSlice(dLS), DexCenter(DexC), DexEdge(DexE), DexLargestSlice(DexLS), VinCenter(VinC), VinEdge(VinE) and VinLargestSlice(VinLS). A schematic illustration of the three ROI selection methods was shown in Fig 2. The measurements derived from three ROI method for Vin, d and Dex were compared using One-way Anova test. Differences in the quantitative parameters between patients with and without regional lymph nodes metastases were compared using Student t test. All statistical analyses were performed using SPSS 25.0 (SPSS, Chicago, IL, USA) and statistical significance was set at P<0.05.Result
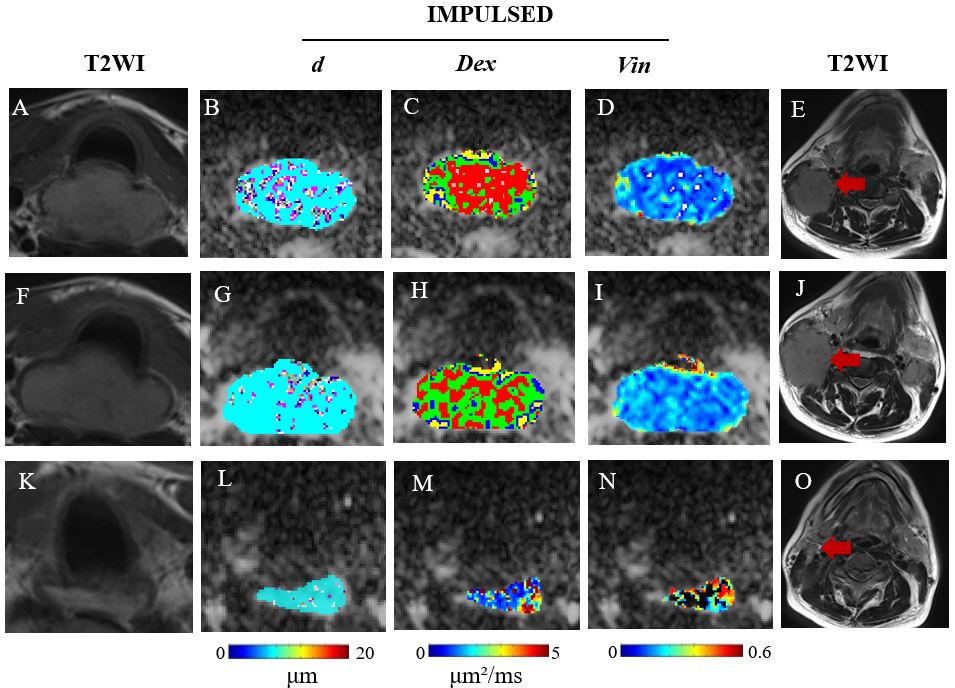
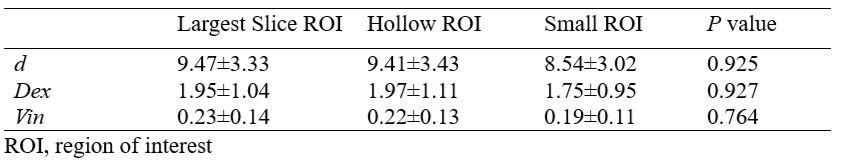
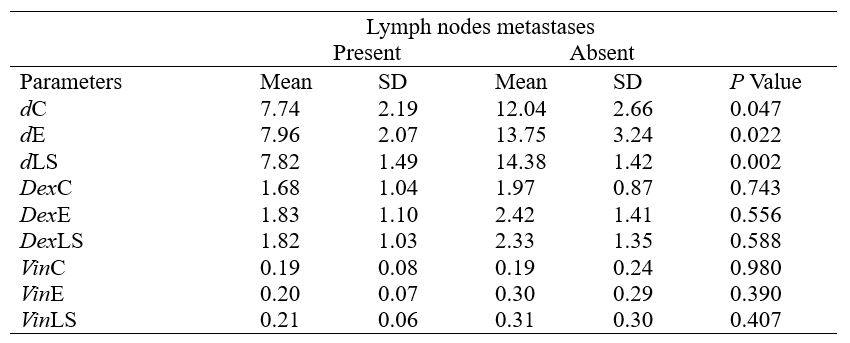
The d for head and neck squamous cell carcinoma was about 9.47±3.33 µm. The Dex and Vin were about 1.95±1.04μm²/ms and 0.23±0.14%, respectively. Quantitative microstructure mapping of d, Dex and Vin from a patient with hypopharyngeal cancer who underwent two cycles of immunotherapy was shown in Fig 3. Note the d of the tumor decreased gradually with increasing treatment cycles, although the primary tumor remained stable and metastatic lymph nodes are enlarged after one cycle of immunotherapy. There was no significant difference in d, Dex and Vin between three ROI method respectively(P>0.05) (Table 1). The d values of patients with regional lymph nodes metastases were significantly smaller than those without metastases respectively(P<0.05) (Table 2). There was no significant difference in Dex and Vin between patients with and without metastases (P>0.05) (Table 2).Discussion
We successfully applied the time-dependent diffusion sequence in the head and neck squamous cell carcinoma, and the quantitative parameters derived in our study were consistent with the previous pathological reports7. The d values derived from the time-dependent diffusion sequence decreased gradually with increasing treatment cycles in one patient with hypopharyngeal carcinoma. The d values of patients with regional lymph node metastases was significantly smaller than that of patients without metastases. However, the result needs to be validated by larger samplesConclusion
The novel time-dependent diffusion MR technique can quantitatively characterize cellular properties of tumors in patients with head and neck squamous cell carcinoma, especially the mean cell size of tumors, which may contribute to a better understanding of immunotherapies, including appropriate patient selection, therapy sequence and response monitoringAcknowledgements
National Natural Science Foundation of China(82202100); Beijing Municipal Administration of Hospitals’ Ascent Plan (DFL20190203); Beijing Municipal Administration of Hospitals Clinical Medicine Development of Special Funding Support (ZYLX201704)
References
1. Gupta B, Johnson NW, Kumar N. Global Epidemiology of Head and Neck Cancers: A Continuing Challenge. Oncology 2016;91(1):13-23.
2. Brockstein B, Haraf DJ, Rademaker AW, et al. Patterns of failure, prognostic factors and survival in locoregionally advanced head and neck cancer treated with concomitant chemoradiotherapy: a 9-year, 337-patient, multi-institutional experience. Ann Oncol 2004;15(8):1179-86.
3. Meric-Bernstam F, Larkin J, Tabernero J, Bonini C. Enhancing anti-tumour efficacy with immunotherapy combinations. Lancet 2021;397(10278):1010-1022.
4. Nishino M, Hatabu H, Hodi FS. Imaging of Cancer Immunotherapy: Current Approaches and Future Directions. Radiology 2019;290(1):9-22.
5. Cho J, Kim SJ, Park WY, et al. Immune subtyping of extranodal NK/T-cell lymphoma: a new biomarker and an immune shift during disease progression. Mod Pathol 2020;33(4):603-615.
6. Jiang X, Dudzinski S, Beckermann KE, et al. MRI of tumor T cell infiltration in response to checkpoint inhibitor therapy. J Immunother Cancer 2020;8(1).
7. Dobroś W, Gil K, Ryś J, Stanisz-Wallis K. Nuclear morphometry for the prediction of regional lymph nodes metastases in patients with cancer of the larynx. Otolaryngology–Head and Neck Surgery 2000;123(6):770-774.
Figures