2085
Assessing tumor internal heterogeneity and pathological findings of oral tongue cancer using voxel-based TIC analysis1Shanghai Ninth People’s Hospital, affiliated to Shanghai Jiao Tong University, School of Medicine, Shanghai, China, 2MR Collaboration, Central Research Institute, Shanghai United Imaging Healthcare, Shanghai, China
Synopsis
Keywords: Head & Neck/ENT, DSC & DCE Perfusion
Evaluating the heterogeneous characteristics and lymph node metastasis status of the tumor would be of importance to stratify patients to have the individually tailored management. In this study, we investigated the feasibility of pixel-by-pixel TIC method in evaluating tumor heterogeneity and predicting histological tumor grade and LNM in tongue SCC. We found that the pixel-by-pixel TIC analysis approach allowed the detection of the internal heterogeneity of the whole tumor. Ratio of Type 2 TIC pattern would facilitate the distinction of SCCs with different histological grades and LNM status, implying its tremendous potential in tumors with high heterogeneity.Introduction
Tongue cancer is the most common type of Oral cavity cancer (OCC) in Asia, and >90% of these cancers are squamous cell carcinomas (SCC)1. Although tongue SCC arise in one histological type, the intra- and inter-individual heterogeneity, has been proved to greatly contribute to the poor prognosis2. Thus evaluating the heterogeneous characteristics and lymph node metastasis (LNM) status of the tumor would be of importance to stratify patients to have the individually tailored management3. The overall semi-quantitative time-intensity curves (TIC) patterns derived from dynamic contrast enhanced magnetic resonance imaging (DCE-MRI) have been proved to be promising in differentiating tumors from benign to malignant ones or predicting LNM4-6. However, this approach somehow led to the loss of identification of intra-tumoral heterogeneity. In comparison, the voxel-based TIC analysis is more spatial- and texture-oriented, where the analysis is not averaged over a selected ROI but rendered in a pixel-by-pixel way7. Thus, the aim of our study was to determine whether the pixel-by-pixel TIC analysis of DCE-MRI is better able to capture the heterogeneous of tongue SCC than the overall TIC and investigate the feasibility of pixel-by-pixel TIC for predicting histological tumor grade and LNM in tongue SCC.Methods
Totally 42 patients (23 patients with cervical lymph node metastases, 26 low grade) with pathologically proven SCC were included. All MRI examinations including T2-weighted imaging (T2WI), DWI and DCE-MRI were performed on a 1.5T scanner (uMR560, United Imaging Healthcare,Shanghai,China) with a twelve-channel head-neck coil. Regions of interest (ROIs) were drawn on all slices of the tumor to gain overall TIC curve type, excluding visually identifiable cystic and necrotic areas. Besides, TIC shapes on a pixel-by-pixel basis for the whole tumor were defined as the previous study4: Five types of TICs were determined based on the enhancement ratio (ER), maximum time (MT), and washout ratio (WR) values. Type 1 TICs are those with ERs ≤ 20%. Type 2 TICs are those with ERs ˃ 20% and MTs ≥ 120s, Type 3 TICs are those having ERs ˃ 20%, with MTs < 120s and with WRs < 30%. Type 4 TICs are those displaying ERs ˃ 20%, with MTs < 120s and with WRs ≥ 30% and < 70%. Type 5 TICs are those that were not categorized into any of the above types. Then the total number of enhancing pixels was calculated and the percentage of voxels expressing each TIC shape type was calculated8. The Mann-Whitney U test or Chi-square test were performed to determine difference between low-grade and high-grade and between with LNM and without LNM. Multivariate binary logistic regression analysis was used to determine independent predictors of tumor grade and LNM of tongue SCC. The capability in predicting tumor grade and LNM was quantified by the receiver operating characteristic (ROC) analysis. P-value of less than 0.05 indicated a significant difference.Results
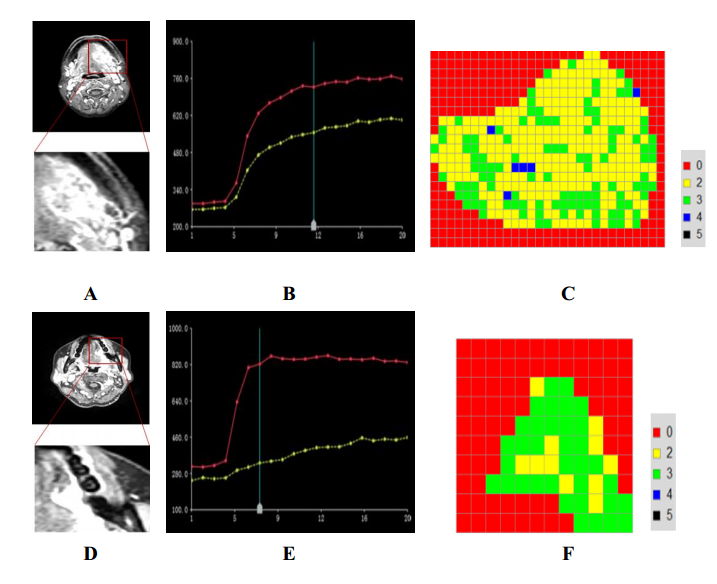
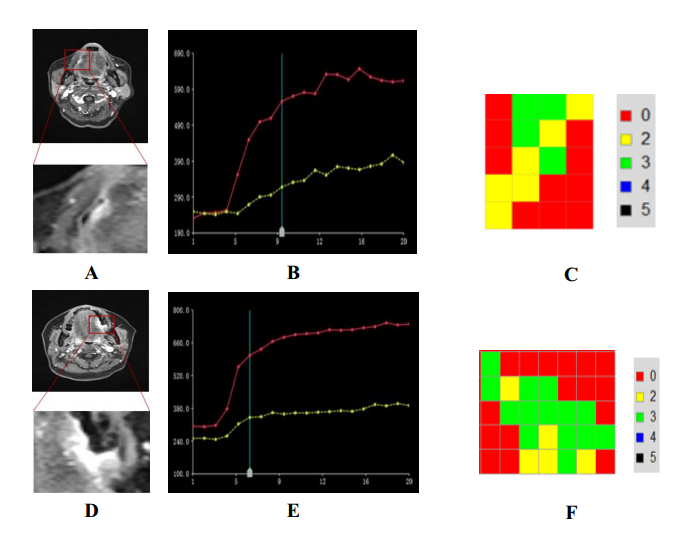
For the overall TIC, there were no statistical differences in Types of TIC patterns either between low- and high-grade groups or with different LMN status (p= 0.072 and 0.508, respectively). While for the pixel-by-pixel TIC approch, a significantly higher ratio of Type 2 TIC (0.49±0.13) and a lower ratio of Type 3 TIC (0.46±0.12) were observed in patients with low-grade SCC than those in patients with high-grade (ratio of Type 2 TIC: 0.37±0.15 and ratio of Type 3 TIC: 0.55±0.15), with p=0.006, and 0.035, respectively (Figure 1). Besides, higher ratio of Type 3 TIC was seen in LNM+ patients than that in LNM- patients (0.54±0.13 vs. 0.45±0.13, p=0.032) (Figure 2). Multivariate logistic regression analysis revealed that only the ratio of Type 2 TIC pattern was an independent predictor for histological tumor grade and LNM status (p = 0.004 and 0.036, respectively) with an odds ratio (OR) of 0.003 and 0.044. Moreover, the ratio of Type 2 TIC yielded great discriminative ability in differentiating low and high histological grade and the LNM, with AUC of 0.75 and 0.68, respectively.Discussion
In this study, we used volume-based pixel-by-pixel TIC analysis approach to assess the intra-tumor heterogeneity and determined whether the semi-quantitative analysis way could help to predict the histological tumor-grade and LNM status. As shown in our study, although the overall TIC analysis displayed a single pattern of TIC type, the pixel-by-pixel analysis showed the coexistence of heterogeneous patterns of TIC types within the tumor, suggesting that this approach could detect tumor heterogeneity. Moreover, the quantitative ratio of Type 2 TIC pattern proved to be significantly discriminatory both in low and high histological groups and lymph nodes with or without metastasis and was an independent predictor for histological tumor grade and LNM status, which indicating the prognostic value of the pixel-by-pixel TIC analysis.Conclusion
In summary, the pixel-by-pixel TIC analysis approach allows the detection of the internal heterogeneity of the whole tumor. Ratio of Type 2 TIC pattern would facilitate the distinction of SCCs with different histological grades and LNM status, implying its tremendous potential in tumors with high heterogeneity.Acknowledgements
No acknowledgementsReferences
1. Lambert R, Sauvaget C, de Camargo Cancela M, Sankaranarayanan R (2011) Epidemiology of cancer from the oral cavity and oropharynx. Eur J Gastroenterol Hepatol 23:633-641.
2. Melchardt T, Magnes T, Hufnagl C, et al (2018) Clonal evolution and heterogeneity in metastatic head and neck cancer-An analysis of the Austrian Study Group of Medical Tumour Therapy study group. Eur J Cancer 93:69-78.
3. O’Connor JP, Rose CJ, Waterton JC, Carano RA, Parker GJ, Jackson A (2015) Imaging intratumor heterogeneity: role in therapyresponse, resistance, and clinical outcome. Clin Cancer Res 21:249-257.
4. Sumi M, Nakamura T (2014) Head and neck tumours: combined MRI assessment based on IVIM and TIC analyses for the differentiation of tumors of different histological types. Eur Radiol 24:223-231.
5. Treutlein C, Stollberg A, Scherl C, et al (2020) Diagnostic value of 3D dynamic contrast-enhanced magnetic resonance imaging in lymph node metastases of head and neck tumors: a correlation study with histology. Acta Radiol Open doi:10.1177/2058460120951966
6. Cheng Z, Wu Z, Shi G, et al (2018) Discrimination between benign and malignant breast lesions using volumetric quantitative dynamic contrast-enhanced MR imaging. Eur Radiol 28:982-991.
7. Lavini C, Pikaart BP, de Jonge MC, Schaap GR, Maas M(2009) Region of interest and pixel-by-pixel analysis of dynamic contrast enhanced magnetic resonance imaging parameters and time-intensity curve shapes: a comparison in chondroid tumors. Magn Reson Imaging 27:62-68.
8. van de Sande MG, van der Leij C, Lavini C, Wijbrandts CA, Maas M, Tak PP (2012) Characteristics of synovial inflammation in early arthritis analysed by pixel-by-pixel time-intensity curve shape analysis. Rheumatology (Oxford) 51:1240-1245.
Figures