2081
Voxel-Based Brain Morphometry: an Optimized Image Analysis Pipeline and Proof-of-Concept in a Non-human Primate Model of Ebola Virus Infection
Byeong-Yeul Lee1, Ji Hyun Lee2, Jeffrey Solomon3, Marcelo Castro1, Venkatesh Mani1, Joseph Laux1, Winston T. Chu2, Matthew G. Lackemeyer1, Jordan K. Bohannon4, Anna N. Honko5, Ian Crozier3, Jens H. Kuhn1, and Claudia Calcagno1
1Integrated Research Facility at Fort Detrick, National Institute of Allergy and Infectious Diseases, National Institutes of Health, Frederick, MD, United States, 2Center for Infectious Disease Imaging, Radiology and Imaging Sciences, Clinical Center, National Institutes of Health, Bethesda, MD, United States, 3Clinical Monitoring Research Program Directorate, Frederick National Laboratory for Cancer Research, Frederick, MD, United States, 4National Biodefense Analysis and Countermeasures Center, Frederick, MD, United States, 5Boston University School of Medicine, Microbiology, Boston, MA, United States
1Integrated Research Facility at Fort Detrick, National Institute of Allergy and Infectious Diseases, National Institutes of Health, Frederick, MD, United States, 2Center for Infectious Disease Imaging, Radiology and Imaging Sciences, Clinical Center, National Institutes of Health, Bethesda, MD, United States, 3Clinical Monitoring Research Program Directorate, Frederick National Laboratory for Cancer Research, Frederick, MD, United States, 4National Biodefense Analysis and Countermeasures Center, Frederick, MD, United States, 5Boston University School of Medicine, Microbiology, Boston, MA, United States
Synopsis
Keywords: Infectious disease, Infectious disease
We present an optimized voxel-based morphometry magnetic resonance imaging (MRI) analysis pipeline for non-human primate brain images, and its preliminary application in Ebola virus (EBOV)-exposed rhesus monkeys. Results suggest the optimized pipeline can detect brain morphometric changes after EBOV exposure in this model. Further analyses will be required to confirm and build upon these findings, including their implications for acute and post-acute neurological findings in human survivors. Future studies may make use of this and other optimized, voxel-based pipelines to shed further light on the role of central nervous system involvement in EBOV and other infectious diseases.Introduction
Brain tissue morphometry quantification using in vivo magnetic resonance imaging (MRI) has become widely accepted for the characterization of neurodegenerative diseases in humans. In these settings, novel image analysis methods based on voxel-based morphometry (VBM) have demonstrated higher sensitivity to subtle changes in brain structure1 as compared to standard region-of-interest (ROI) analysis.Despite its widespread application in human neuroimaging studies, VBM-based techniques are yet to be deployed in well-validated animal models of disease that enable rigorous control of the experimental setting as well as pre-exposure baseline imaging often not available in the clinic. The application of VBM-based tools would advance efforts to characterize pathophysiological changes in the central nervous system (CNS) during disease progression in animal model systems in the context of high-threat infectious diseases.
Here, we describe the development of an optimized VBM method to analyze brain MRI data in non-human primates (NHPs), a well-accepted model in neuroimaging research. We believe VBM-based analysis in an NHP model may also be relevant to explore the increasingly reported acute and longer-term neurologic sequelae in humans infected with emerging or high-risk pathogens, e.g. coronaviruses, arenaviruses, and filoviruses2,3. As a proof-of-concept, we apply this pipeline to investigate acute changes in brain morphometry in Ebola virus (EBOV)-exposed rhesus monkeys.
Methods
SubjectsA total of seven rhesus monkeys (6.93 ± 3.78 yr; two males, five females) were included in this study. All animals were exposed to an EBOV Makona variant isolate via small-particle aerosol (particle size range 0.5–3.0 µm, averaged inhaled dose 1,150 plaque-forming units). For longitudinal assessment of brain morphology, anatomical MR images were collected before and 8–9 days after EBOV exposure.
Image Acquisition
MR imaging was performed on an Achieva 3.0T clinical MR scanner (Philips Healthcare, Cleveland, OH, USA) equipped with an 8-channel pediatric neuro-spine coil. Subjects were intubated, immobilized using isoflurane. High-resolution 3D T1-weighted images were acquired using a magnetization‑prepared rapid gradient echo sequence: repetition time = 9.8 ms, echo time = 4.7 ms, inversion time = 1,100 ms, flip angle = 8°, resolution = isotropic 0.5 mm, 2 averages, field-of-view = 96 mm x 96 mm x 68 mm, and acquisition time = 4.5 min.
Optimized Voxel-Based Morphometry
An optimized VBM image analysis pipeline was developed by integrating Analysis of Functional Neuro Images (AFNI, https://afni.nimh.nih.gov/), Advanced Normalization Tools (ANTs, https://github.com/ANTsX/ANTs), and Statistical Parametric Mapping software (SPM, https://www.fil.ion.ucl.ac.uk/spm /software/spm12/). Our VBM pipeline comprises 7 major steps:
1. Bias correction: correction of MR image intensity inhomogeneity
2. Brain extraction and skull-stripping using AFNI (Fig. 1).
3. Brain tissue segmentation: using skull-stripped images, segmentation of brain tissues including gray matter, white matter, and CSF was conducted using an @animal_warper pipeline of AFNI (Fig. 2).
4. Image normalization: all segmented images in native space were then non-linearly warped to the NMT (National Institute Mental Health Macaque Template) brain templates 4 (Fig. 3) using ANTs 5.
5. Image modulation: modulated images were created using the Jacobean that preserves the relative volume for each voxel before and after spatial normalization.
6. Image smoothing: smoothing was applied to the warped images prior to statistical analysis using a gaussian filter (full-width half-maximum of 1.5 mm).
7. Voxel-based statistical analysis: the final step of a VBM analysis involves voxel-wise statistical analysis using SPM. With a general linear model, a paired t-test was conducted to test the hypothesis that EBOV causes morphometric changes in the brain of exposed rhesus monkeys. To improve the detectability of volumetric changes, a probabilistic threshold-free cluster enhancement method was applied 6, and p < 0.05 was considered statistically significant (one-tailed, false-discovery correction (FDR)). Statistical analysis results for brain structures showing significant morphometric changes were provided (Table 1) using the SARM (Subcortical Atlas of Rhesus Macaque) atlas 7.
Results
As shown in Figs.1–2, brain tissues were consistently and reliably extracted from MR anatomical images, allowing for accurate segmentation of brain structures (steps 1–3). In addition, after normalization, the warped segmented images showed excellent alignment with the NMT template (step 4, Fig 3). Using modulated images (step 5) and voxel-wise statistical comparison of whole brain structures (step 7), our optimized VBM analysis identified changes in brain morphometry in EBOV-exposed rhesus monkeys, including in areas of deep gray matter nuclei (p < 0.01, Table 1, Fig. 4). Further analyses will be required in a larger sample of animals to confirm these findings and contextualize their interpretation in this acute infection model as well as implication for long-term findings in human survivors.Discussion
We developed an optimized VBM pipeline for analysis of anatomical MR brain images in NHPs and demonstrated its application to detect morphometric abnormality of CNS in a rhesus monkey model of EBOV infection. With the use of an advanced warping technique, the proposed optimized VBM method improved spatial normalization, allowing for a reliable comparison of absolute brain structure volume changes after viral exposure. With the proposed method, we were able to identify acute changes in morphometry in the deep gray matter of the NHP brains after EBOV exposure. We foresee that future studies in this field may employ this and other optimized, voxel-based pipelines to shed further light on the role of CNS involvement in EBOV and other infectious diseases.Acknowledgements
The authors thank the Integrated Research Facility at Fort Detrick (IRF-Frederick) team for their support. With the U.S. National Institute of Allergy and Infectious Diseases (NIAID), this work was supported in part through the prime contract of Laulima Government Solutions, LLC, under contract (HHSN272201800013C), Tunnell Government Services, a subcontractor of Laulima Government Solutions, LLC under contract (HHSN272201800013C), Kelly Services, under contract (75N93019D00027, Task Order No. 75N93021F00010), and Battelle Memorial Institute’s former prime contract under contract (HHSN272200700016I). This work was further supported in part by federal funds from the National Cancer Institute and National Institutes of Health (NIH) under contract (75N91019D00024, Task Order no. 75N91019F00130). The content of this publication does not necessarily reflect the views or policies of the U.S. Department of Health and Human Services of the institutions and companies affiliated with the authors, nor does mention of trade names, commercial products, or organizations imply endorsement by the U.S. Government.References
1. Mechelli A, Price CJ, Friston KJ, Ashburner J. Voxel-based morphometry of the human brain: Methods and applications. Curr Med Imaging 2005; 1(2): 105-13.2. McEntire CRS, Song KW, McInnis RP, et al. Neurologic Manifestations of the World Health Organization's List of Pandemic and Epidemic Diseases. Front Neurol 2021; 12: 634827.
3. Billioux BJ. Neurological Complications and Sequelae of Ebola Virus Disease. Curr Infect Dis Rep 2017; 19(5): 19.
4. Seidlitz J, Sponheim C, Glen D, et al. A population MRI brain template and analysis tools for the macaque. Neuroimage 2018; 170: 121-31.
5. Tustison NJ, Cook PA, Klein A, et al. Large-scale evaluation of ANTs and FreeSurfer cortical thickness measurements. Neuroimage 2014; 99: 166-79.
6. Spisak T, Spisak Z, Zunhammer M, et al. Probabilistic TFCE: A generalized combination of cluster size and voxel intensity to increase statistical power. Neuroimage 2019; 185: 12-26.
7. Hartig R, Glen D, Jung B, et al. The Subcortical Atlas of the Rhesus Macaque (SARM) for neuroimaging. Neuroimage 2021; 235: 117996
Figures
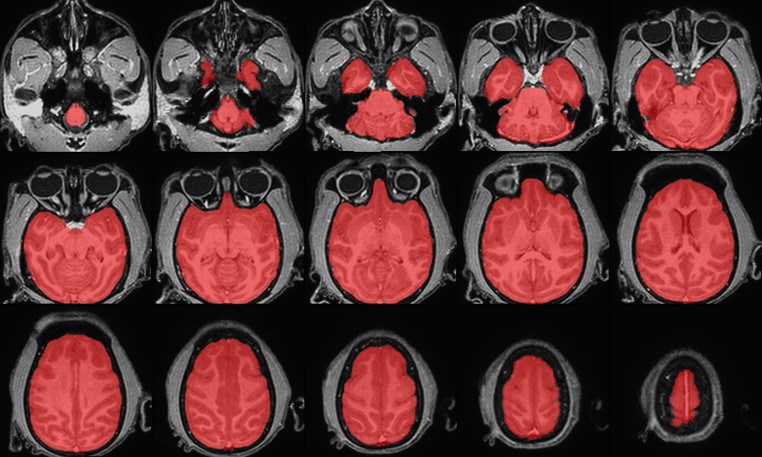
Figure 1. Skull-stripping
results. Brain tissue was extracted using AFNI software. Non-brain tissues,
including eyes and skull, were removed. The segmented image (red) was overlaid
on the structural image.
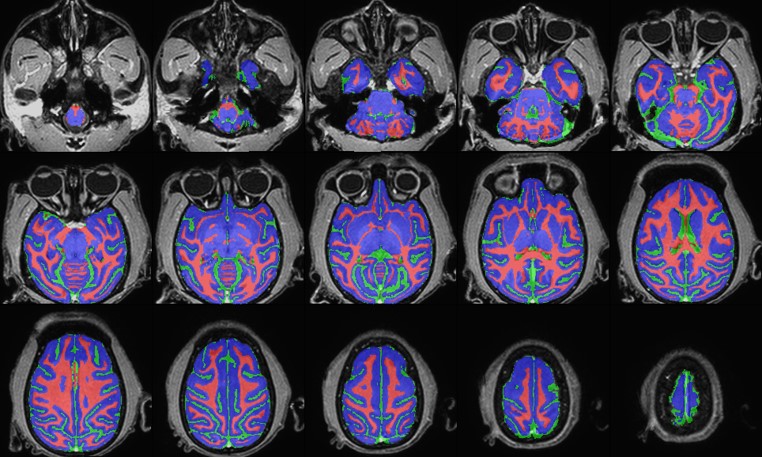
Figure 2. Brain tissue segmentation in the native space. The segmented image was overlaid on the T1w
image. The color map represents the segmentation of the different tissue types:
gray matter (blue), white matter (red), and CSF (green).
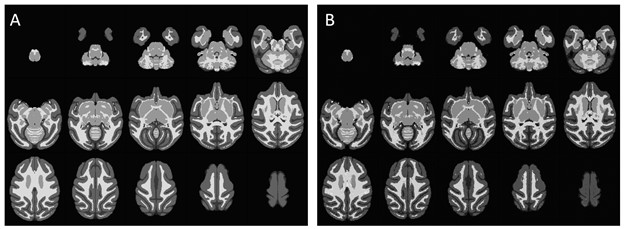
Figure 3. Spatial
Normalization in NMT space. All segmented images in native space (Fig. 2) were
accurately normalized into the NMT template using a non-linear warping
technique of ANTs. (A) is the NMT template, and (B) is the warped image.
Figure
4. A statistically significant change in
voxel-based morphometry in the rhesus monkey brain before and after EBOV
exposure. A significant decrease in brain volume was observed mainly along the
basal ganglia after EBOV infection, including the bilateral putamen, globus
pallidus, and caudate nucleus. Statistical significance was given at p < 0.01
(one-tailed paired t-test, extent voxels > 30). The color bar shows a
T-score range.
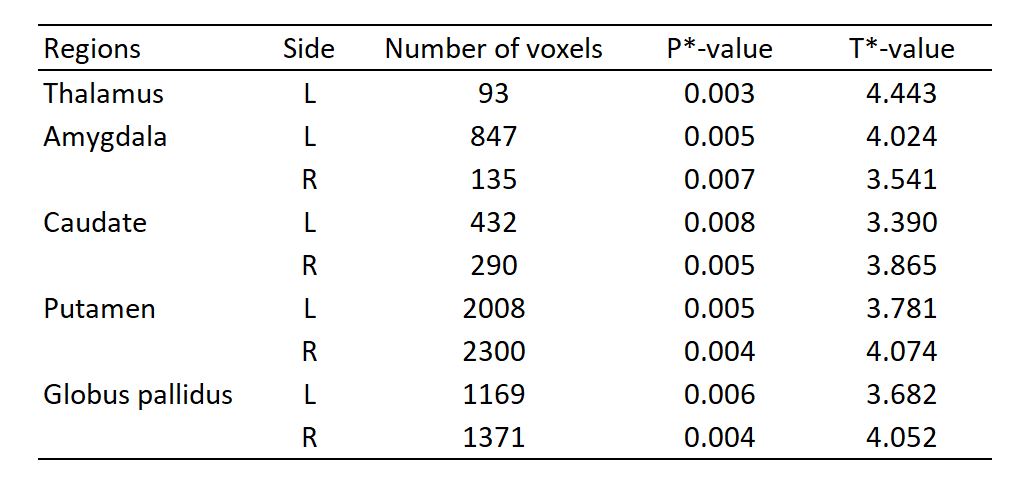
Table 1. Summary of
voxel-wise statistical comparison results of brain morphometry between pre- and
post-exposure to EBOV. * P and T values were computed from voxels of each brain
structure with a statistical significance (Fig 4) (one-tailed
paired t-test,
p < 0.01, FDR correction, extent voxel > 30). L, left; R, right.
DOI: https://doi.org/10.58530/2023/2081