2080
Effect of a flow-diverter stent on flow in the vessel and aneurysm measured with MRI.
Lana Bautz1, Oluwabusayo A. Oni2, Hivnu Toraman3, Olav Jansen3, Jan-Bernd Hövener1, Naomi Larsen3, and Mariya S. Pravdivtseva1
1Department of Radiology and Neuroradiology, Section Biomedical Imaging, Molecular Imaging North Competence Center (MOIN CC), University Medical Center Schleswig-Holstein (UKSH), Kiel University, Kiel, Germany, Kiel, Germany, 2University of Florida, Gainesville, FL, United States, 3Department of Radiology and Neuroradiology, University Medical Center Schleswig-Holstein (UKSH), Kiel, Kiel, Germany
1Department of Radiology and Neuroradiology, Section Biomedical Imaging, Molecular Imaging North Competence Center (MOIN CC), University Medical Center Schleswig-Holstein (UKSH), Kiel University, Kiel, Germany, Kiel, Germany, 2University of Florida, Gainesville, FL, United States, 3Department of Radiology and Neuroradiology, University Medical Center Schleswig-Holstein (UKSH), Kiel, Kiel, Germany
Synopsis
Keywords: Data Analysis, Treatment, Evaluation of aneurysm treatment
Flow diverter stents are effective for the treatment of intracranial aneurysms at a high risk of rupture. Still, complications may occur after stent implantation, so evaluation of aneurysm treatment is required. Treatment follow-up can be performed with 4D phase-contrast MRI. In this work, flow within the aneurysm and adjacent vessels with and without stent was measured with 4D flow. Strong metal artifacts were observed at the parent vessel which resulted in MRI signal voids and a 30 % reduction of measured flow. No artifacts were seen within an aneurysm sac, here flow was reduced up to 83 %.Introduction
Intracranial aneurysms (IAs) can cause life-threatening hemorrhages if they rupture and therefore require preventive treatment. Aneurysms could be treated by placing flow diverter stents (FDS) to reduce the blood flow into the aneurysm sac. But postoperative complications, such as the persistence of flow inside the aneurysm, can still occur, and even result in a delayed aneurysm rupture1.Four-dimensional (4D) phase contrast magnetic resonance imaging (PC MRI) can provide 3D directional time-resolved comprehensive velocity maps non-invasively. Therefore, it can assess the aneurysm treatment successes by measuring flow changes . However, 4D PC MRI can be affected by metal artifacts, making treatment evaluation challenging1.
To assess this matter, this work aims to evaluate flow at the aneurysm and adjacent vessels with and without FDS. The flow was measured with 4D PC-MRI using a patient-specific aneurysm model.
Methods
Aneurysm treatment: A commercially available stent (Derivo) was placed in patient-specific aneurysm model fabricated in-house2. Aneurysm model with and without (w/o) a stent was supplied with an average flow of 250 ml/min and underwent MRI measurements (glycerol-water mixture, PD-1100).MRI measurements were performed on a 3 T MR system equipped with a 32-ch head coil. Time-resolved T1-weighted PC MRI with 3D velocity encoding was acquired (TE/TR: 5/8.4 ms; FOV: 110 × 110 × 50 mm3, iso voxel size 0.75 mm3). The velocity encoding parameter (venc) was set at 80 and 100 cm/s for the aneurysm model w/o and with stent respectively.
Data analysis: Flow and velocity values were evaluated in the aneurysm, parent vessel before the stent (Fig. 1a, section 1) and within the stent (section 2) (GTflow, version 3.2.13). For qualitative evaluation, velocity path lines in the aneurysm were generated.
Then, 2D quantitative evaluation of flow and velocity was performed as follows:
- Equidistant slices were created perpendicular to the vessel and within the aneurysm (Fig. 1a);
- The flow was measured in selected areas in each slice (Fig. 1b)
- The resulting flow was averaged across the slices and time (Fig. 1c);
- The maximum, mean, and standard deviation was calculated. The flow reduction (FR) was calculated as
To further investigate velocity reduction within the aneurysm, a volumetric region (3D ROI) of the aneurysm was created (Fig. 4c, Meshmixer).
Results
Evaluation of flow: At the parent vessel in section 1, flow with and w/o a stent was similar, 7.7 and 7.8 ml/s respectively (Fig. 2a and b). A correlation coefficient of 0.92 was calculated between the flow values and the linear fit has a slope of 0.98 (Fig. 2c). However, in section 2, flow with stent was smaller than w/o stent, 7.5 and 5.4 ml/s (Fig. 2d and e). The correlation coefficient had a value of 0.91, but the slope of linear fit decreases to 0.65 (Fig. 2f). After implanation, the maximum flow was reduced by 28% in section 2 but stayed constant in section 1. This reduction is clearly a non-physical effect and likely attributed to the metal-induced artefacts of the FDS.Within the aneurysma, the flow w/o stent was reduced as a function of distance from the parent vessel (from 7.7 to 3.5 ml/s at the aneurysm center and external wall, respectively, Fig. 2g). The FDS reduced the intraaneurysmal flow drastically, from 11.2 to 1.8 ml/s (Fig. 2h), and the maximum flow by 84 % (Tab. 1). The mean values support the observed trend in flow reduction within section 2 and aneurysm.
Evaluation of velocities: A strong vortex and flow pulsatiliy in the aneurysm (Figs. 3a,c) vanished when the stent was placed (Fig. 3b,d). The mean velocity in the aneurysm was reduced from 26.9 to 10.0 cm/s (Tab. 1).
Evaluation of the aneurysm volume as a whole showed a similar reduction in flow, although lower maximum values (from 20 to 5.9 cm/s, a reduction of 71 %, Fig. 4a and b).
Discussion
The reduction of flow inside the aneurysm of 83% after implantation was similar but not the same as described by Velvaluri et al.3, where a flow reduction of 97% was found in with the same stent.Pereira et al.1 described a velocity reduction, which ranged from 34.6% to 71.1%. This is in good agreement with the values found here.
Differences between studies may be caused by different MRI parameters, which have been shown to affect flow and velocity values. In addition, the choice of the position of a 2D slice within an aneurysm is crucial for flow calculation. Velocity calculation within the slice also differs from volumetric velocity analysis. Standardized MRI protocols and a full description of the quantitative analysis are needed to allow comparison.
Our study has several limitations: 1) one aneurysm geometry and one stent model were studied; 2) venc must be reduced to eliminate velocity noise. Next, we repeat 4D PC MRI with lower venc, add different aneurysm geometries from different stent manufacturers. Finally, we will determine whether all commercial stents cause the same in-stent flow reduction due to metal artifacts.
Conclusion
4D PC MRI enables non invasive monitoring the FDS effect on the flow in aneurysms, despite the fact that metal artefacts occur within the stent. The data analysis is complex, affects the outcome and must be considered carefully.Acknowledgements
No acknowledgement found.References
1. Pereira VM, Brina O, Delattre BMA, et al. J NeuroIntervent Surg. 2014; 0:1-7. doi: 10.1136/neurintsurg-2014-011348
2. Pravdivtseva MS, Peschke E, Thomas Lindner et al. Med Phys. 2021; 48:1469-1484. doi: 10.1002/mp.14714
3. Velvaluri P, Pravdivtseva MS, Berg P et al. AMT 2021; 6:1-13. doi: 10.1002/admt.202100384
Figures
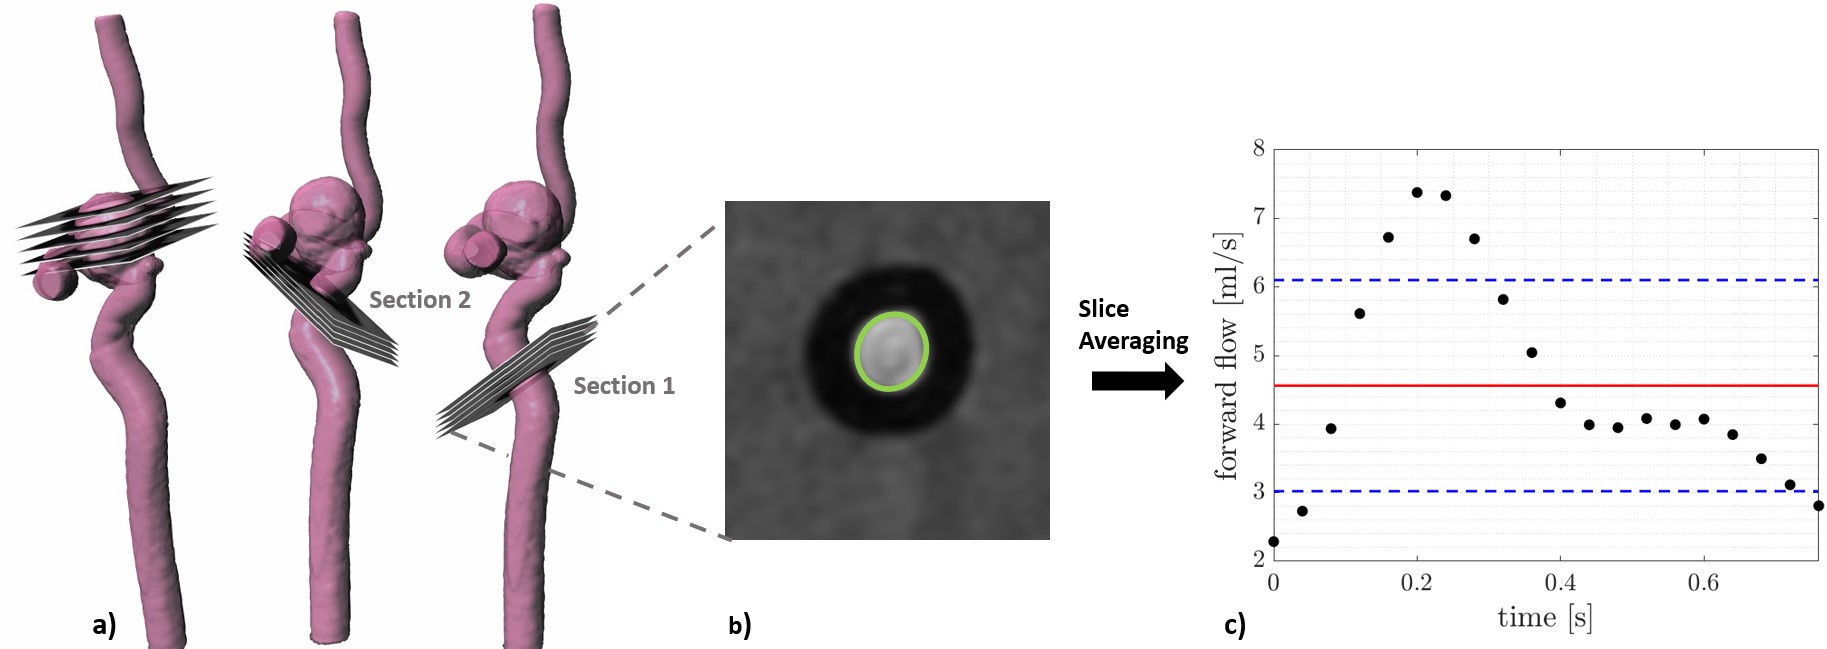
Workflow of two-dimensional data analysis of 4D PC
MRI data. (a) Equdistant slices in two sections of the vessel and in the whole
aneurysm volume. (b) Manually drawn contours for each added slice and calculatation
of flow within. (c) Calculating the slice averaged flow or velocity curves and
the mean and standard deviation values.
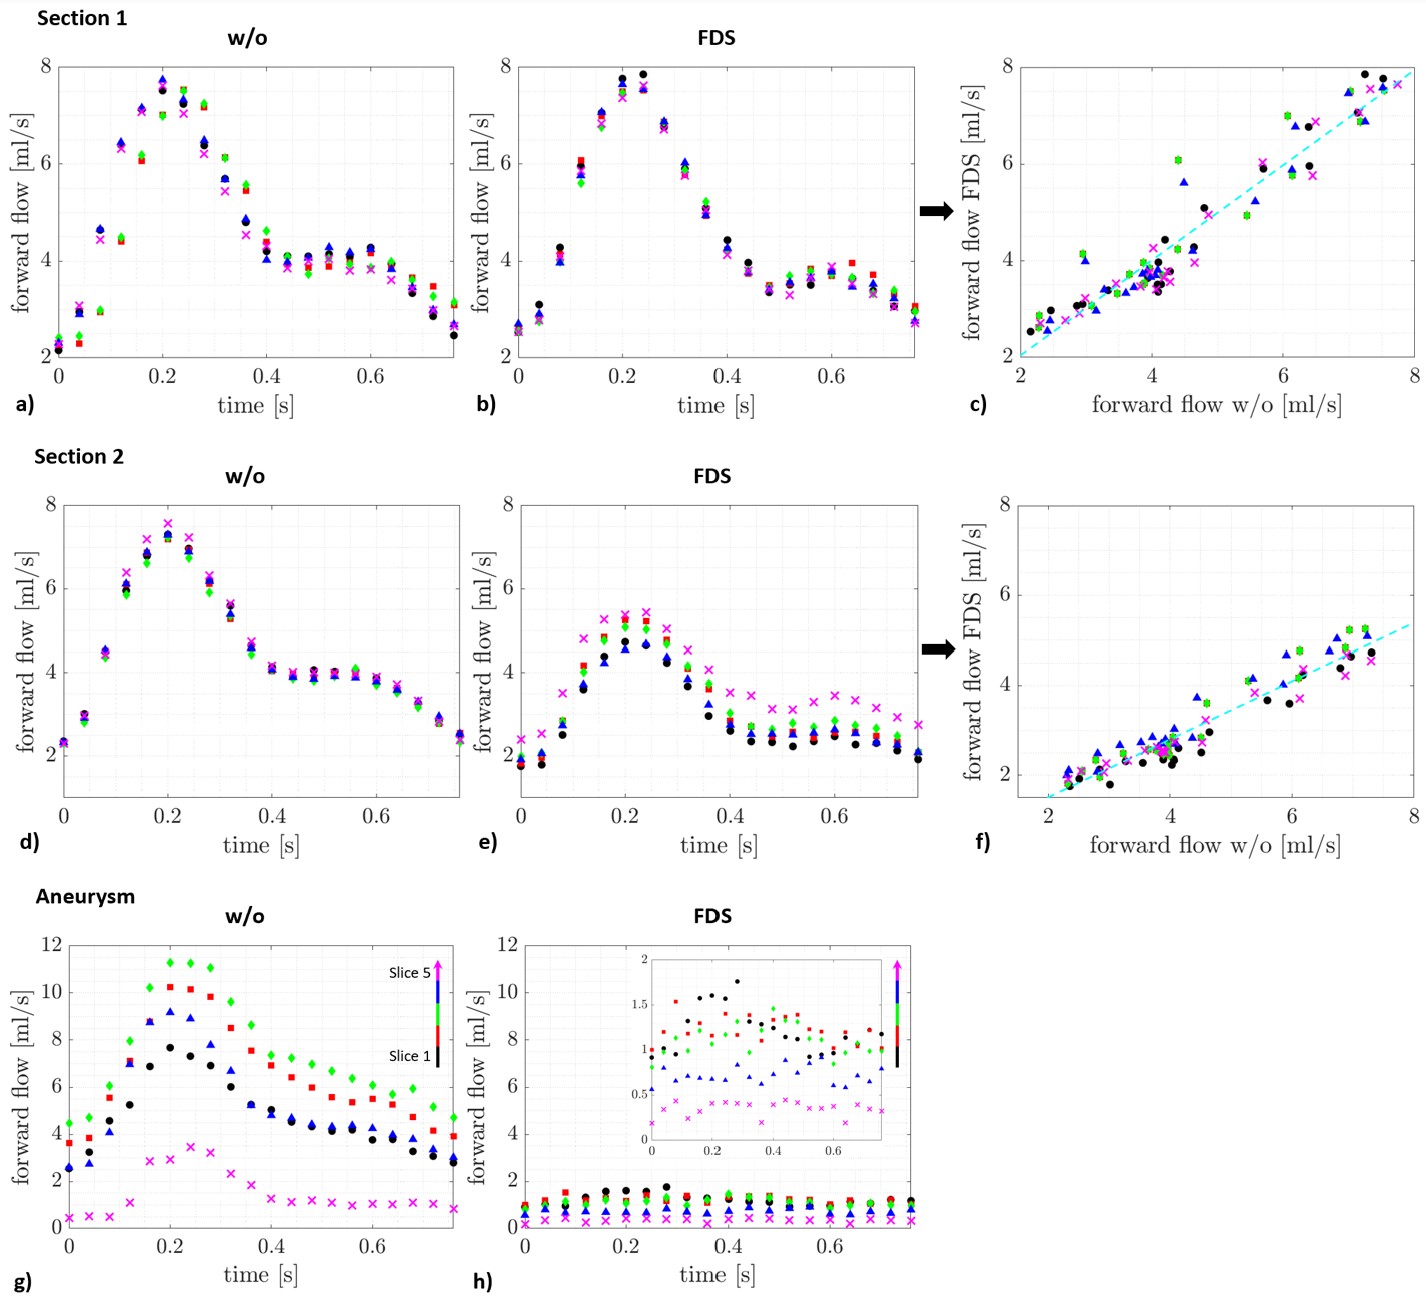
Time resolved flow in the three sections of the
vascular model, before and after implantation with a flow diverter stent,
measured with 4D flow. For each section, the flow was measured in five slices
(different indicators). The implanation did not affect the measured flow in
section 1. Section 2 as well as the aneurysm showed a strong reduction after
implantation.
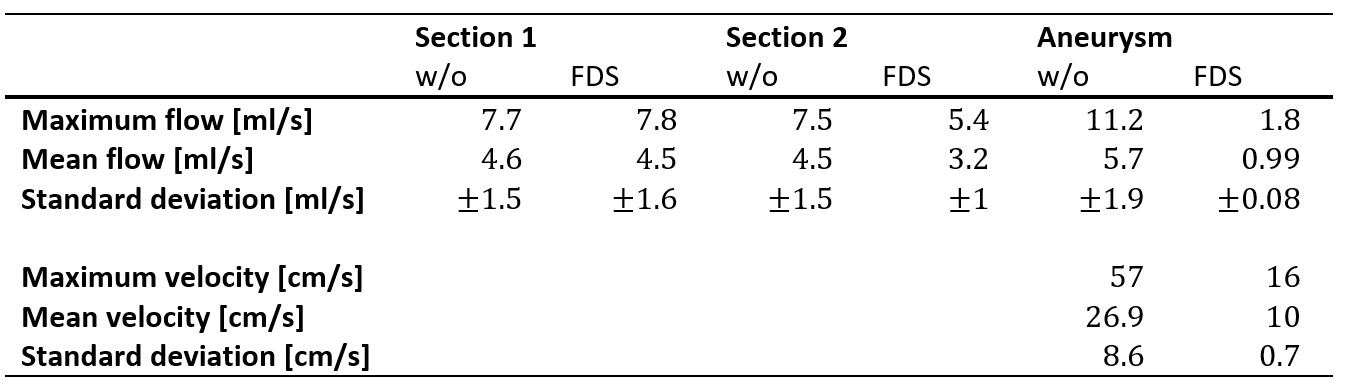
Maximum and mean flow values, as well as standard
deviations obtained from the two-dimensional analyses of 4D PC MRI data.
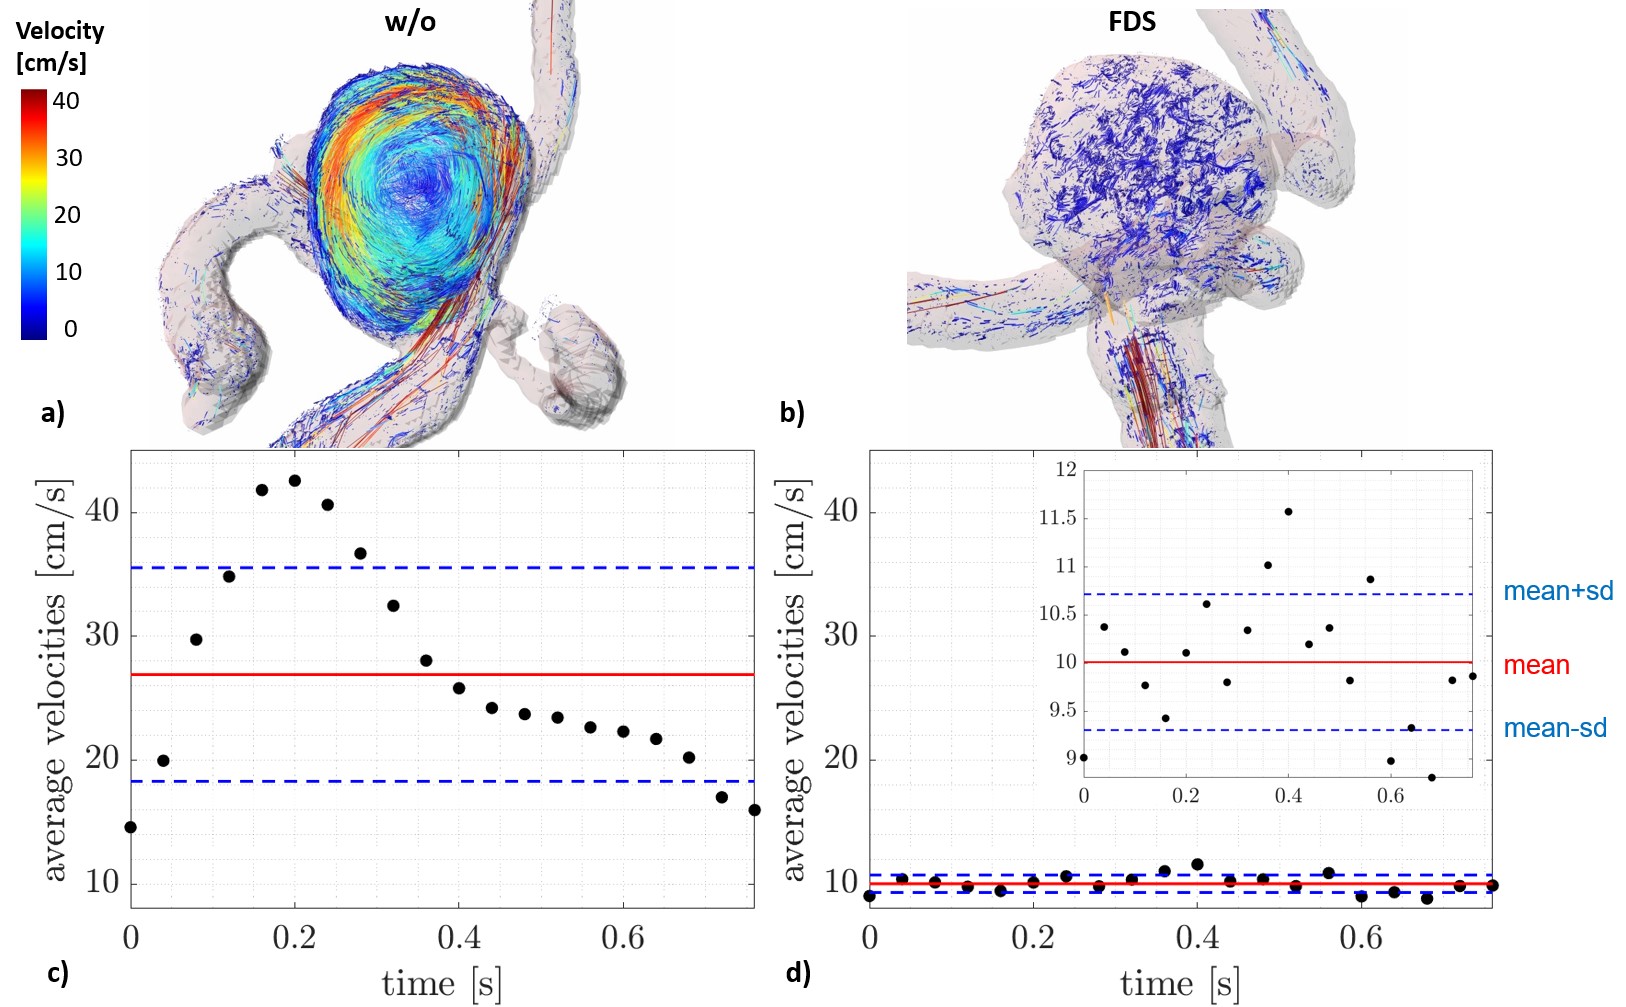
Velocity pathlines and time resolved, mean flow
before (a, c) and after (b, d) implanation of an FDS. Both pulsatility and
vortex did vanish after the stent was implanted, indicating successful flow
diversion. The flow was averaged across five slices in the aneurys, the mean (red
line) and standard deviation (dashed line) is given.
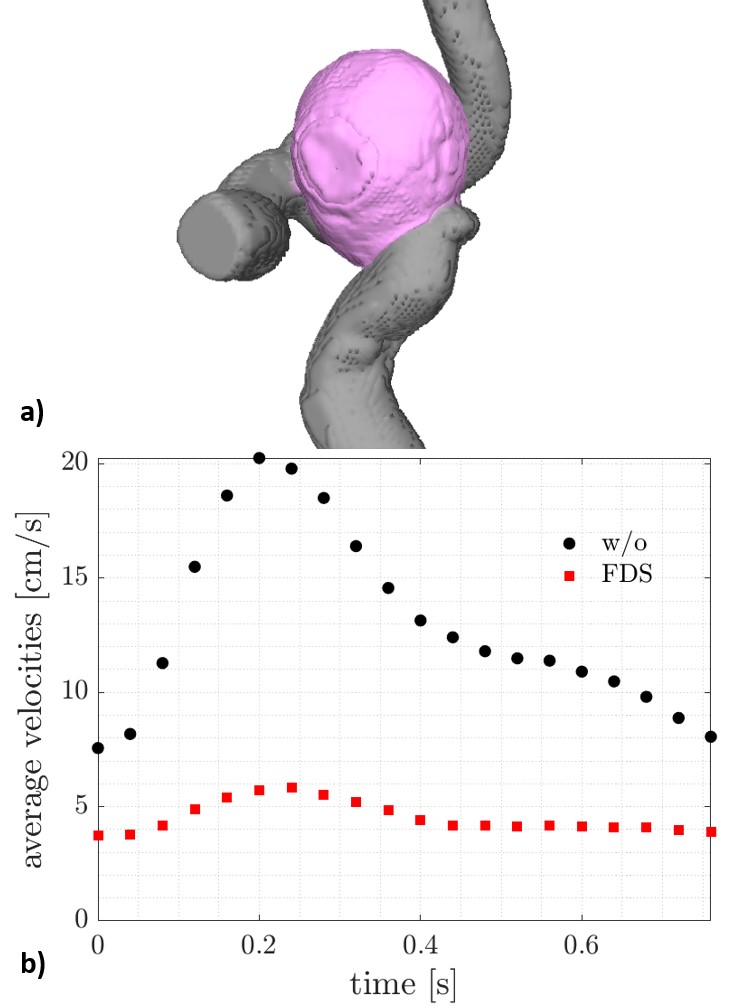
3D rendering of the aneurysm model with volume
of interest (VOI, pink) where the velocity was measured (a) and mean velocity
in the VOI as function of time, before and after implanation (b). Note the
reduction in velocity, and that some pulsatility persisted after the
implanation.
DOI: https://doi.org/10.58530/2023/2080