2078
Feasibility of textural analysis and very-low-field magnetic resonance for imaging Nipah virus infection
Kunal Aggarwal1,2, Yu Cong3, Ji Hyun Lee4, Venkatesh Mani3, Claudia Calcagno5, Michael R. Holbrook5, and Sairam Geethanath6
1Department of Electrical and Computer Engineering, Technical University Munich, Munich, Germany, 2Deptartment of Diagnostic, Molecular and Interventional Radiology, Mount Sinai Hospital, New York City, NY, United States, 3National Institute of Allergy and Infectious Diseases, Fort Detrick, MD, United States, 4Radiology and Imaging Sciences, Clinical Center, National Institutes of Health, Bethesda, MD, United States, 5National Institute of Allergy and Infectious Diseases, National Institutes of Health, Fort Detrick, MD, United States, 6Mount Sinai Hospital, New York, NY, United States
1Department of Electrical and Computer Engineering, Technical University Munich, Munich, Germany, 2Deptartment of Diagnostic, Molecular and Interventional Radiology, Mount Sinai Hospital, New York City, NY, United States, 3National Institute of Allergy and Infectious Diseases, Fort Detrick, MD, United States, 4Radiology and Imaging Sciences, Clinical Center, National Institutes of Health, Bethesda, MD, United States, 5National Institute of Allergy and Infectious Diseases, National Institutes of Health, Fort Detrick, MD, United States, 6Mount Sinai Hospital, New York, NY, United States
Synopsis
Keywords: Infectious disease, Infectious disease
Our study focuses on textural analysis of high field and low field MR images and its validation through simulation. We acquired MR images of three NHPs at 3T injected with NiV and simulated them into low field to perform texture analysis for different neuroanatomies. The low field simulation was done by changing contrast, resolution and SNR. The validation of low field simulation was performed by scanning phantom at 3T and 0.05T and passing the data though low field simulator. Results showed four out of 14 textural features had similar changes in 2 NHPs.Introduction
Increasing evidence suggests that emerging and high-consequence pathogens, such as Ebola, Lassa, and Nipah viruses (EBOV, LASV, NiV), may be associated with a variety of neurological manifestations that can be visualized using MRI. However, in-depth characterization of the neurological manifestations of high-consequence pathogens with MRI has been challenging. High-field (HF) MRI scanners (3T or higher) are rare and extremely difficult to deploy in geographic areas where disease outbreaks naturally occur, or in their immediate proximity for long-term monitoring of human survivors. Portable, very low-field (VLF) MRI systems may represent the only viable strategy to characterize and monitor such neurological manifestations in vivo and non-invasively in humans. In HF systems, textural MR image features are more sensitive than standard volumetric measurements for detecting changes in the brain parenchyma (6). In this work, we explore the use of HF textural features to investigate changes in the brain of African green monkeys (AGM) after NiV exposure and compare it to features extracted from VLF-simulated images. We foresee that this study may develop methods to characterize brain VLF MRI during outbreaks.Methods
Animal model and study design: Three AGMs were exposed to a large-particle aerosol (12 µm) challenge of NiV (Malaysia isolate) at the target dose of approximately 500 PFUs (confirmed by back-titration). Animals underwent brain MR imaging before, and at several time points after virus exposure.MRI acquisition: Animals were imaged on a 3T Philips Achieva scanner. The imaging protocol included a pre- and post-contrast 3D T1w volume, among other sequences. The 3D T1w acquisition parameters were: TR/TE = 34/3.403 ms, FOV = 110 x 110 x 120 mm, FA=32. The first AGM was imaged twice before and once after the NiV exposure. The other two AGMs were imaged twice before exposure and six times afterwards.
HF Texture Analysis: For this preliminary textural analysis, we chose to focus on one time-point before and three time-points after exposure (every alternate time point to reduce manual segmentation time). We focused on three neuroanatomies known to be impacted by NiV exposure: the medulla, frontal and temporal lobes. We manually selected a region of interest (ROI) in one slice each for the three neuroanatomies. Two ROIs were created for the right and left hemispheres of the temporal lobe. We chose four out of the fourteen textural features that showed common patterns between AGMs #2 and #3.
VLF Simulation: We implemented a VLF simulation pipeline to translate HF textural features’ analysis at 50mT. Figure 1 shows the three steps of the VLF simulation of contrast modification, spatial resolution and signal-to-noise ratio reduction. VLF noise was then compiled based on cropping 16 voxel-wide corner signal intensities found in ten datasets of 3D Turbo Spin Echo acquired at 50mT (Multiwave Technologies SA, France) after they had been normalized to the range of 0 to 1 and scaled by a factor of 5 to match VLF SNR, similar to the works on native noise in refs (7, 8). This noise (σVLF acquired) was then scaled and added iteratively to the simulated data from step 2 until the standard deviation of the simulated noise matched that of the acquired VLF data (σVLF Practical).
Validation of VLF simulation: We acquired a T1-MRPAGE image of the pro-MRI phantom on a 3T Siemens Skyra with a resolution of 0.8mm x 0.8mm x 0.97mm. The same phantom was acquired on a 0.05T (Multiwave Technologies SA, France) using a 3D Turbo spin echo sequence. We passed the HF data into our LF simulator to mimic the LF data for resolution and SNR. In the resize step of our simulations, we defined a target of 1.5mm x 1.5mm x 5mm in line with the 50mT data resolution.
Results
Four out of the fourteen evaluated Haralick’s textural features (difference variance, sum of average, difference entropy, and the sum of square variance, Figure 2) showed similar changes in two out of the three NHPs. The three neuroanatomies of the medulla, temporal and frontal lobes had different textural features depicting significant temporal gradients. The trend of these features also varied. However, these features showed a sudden increase in value after inoculation that decreased over time. Two out of three AGMs with increased post-exposure feature values showed similarity in these textural feature trends, as seen in Figure 3. These patterns may potentially be indicative of functional or metabolic changes in brain areas that are linked to specific NiV-related neurosymptomatology. Figure 4 (a-f) shows the results of low-field simulation in the three brain structures and the corresponding correlations of textural features with HF (g-k). Figure 4 depicts the subtle changes in contrast and loss of spatial resolution and SNR compared to the 3T data. Figure 5 shows the 3T data and corresponding low-field simulation matched with the acquisition at 50mT.Conclusion and future work: In this preliminary feasibility study, we have explored using textural analysis as a translational imaging marker from HF to VLF, correlating trends between AGMs infected with NiVs and the two field strengths. Current and ongoing work includes expanding our analysis to include more AGM data with increased timepoints.
Acknowledgements
The author acknowledges support from the Faculty Idea Innovation Prize, 2022, from the office of faculty development, Icahn School of Medicine at Mt. Sinai.References
- https://www.cdc.gov/vhf/nipah/index.html
- Sejvar, J.J., Hossain, J., Saha, S.K., Gurley, E.S., Banu, S., Hamadani, J.D., Faiz, M.A., Siddiqui, F.M., Mohammad, Q.D., Mollah, A.H. and Uddin, R., 2007. Long‐term neurological and functional outcome in Nipah virus infection. Annals of Neurology: Official Journal of the American Neurological Association and the Child Neurology Society, 62(3), pp.235-242.
- Lim, C.T., 2009. MR imaging in Nipah virus infection. Neurology Asia, 14(1), pp.49-52.
- Sarji, S.A., Abdullah, B.J.J., Goh, K.J., Tan, C.T. and Wong, K.T., 2000. MR imaging features of Nipah encephalitis. American Journal of Roentgenology, 175(2), pp.437-442.
- Rumboldt, Z., 2008. Imaging of topographic viral CNS infections. Neuroimaging Clinics of North America, 18(1), pp.85-92.
- Lee, S., Lee, H. and Kim, K.W., 2020. Magnetic resonance imaging texture predicts progression to dementia due to Alzheimer disease earlier than hippocampal volume. Journal of Psychiatry and Neuroscience, 45(1), pp.7-14.
- Geethanath, S., Poojar, P., Ravi, K.S. and Ogbole, G., 2021. MRI denoising using native noise. In Proc Intl Soc Mag Reson Med (Vol. 2405).
- Qian, E., Poojar, P., Vaughan Jr, J.T., Jin, Z. and Geethanath, S., 2022. Tailored magnetic resonance fingerprinting for simultaneous non‐synthetic and quantitative imaging: A repeatability study. Medical Physics, 49(3), pp.1673-1685.
Figures
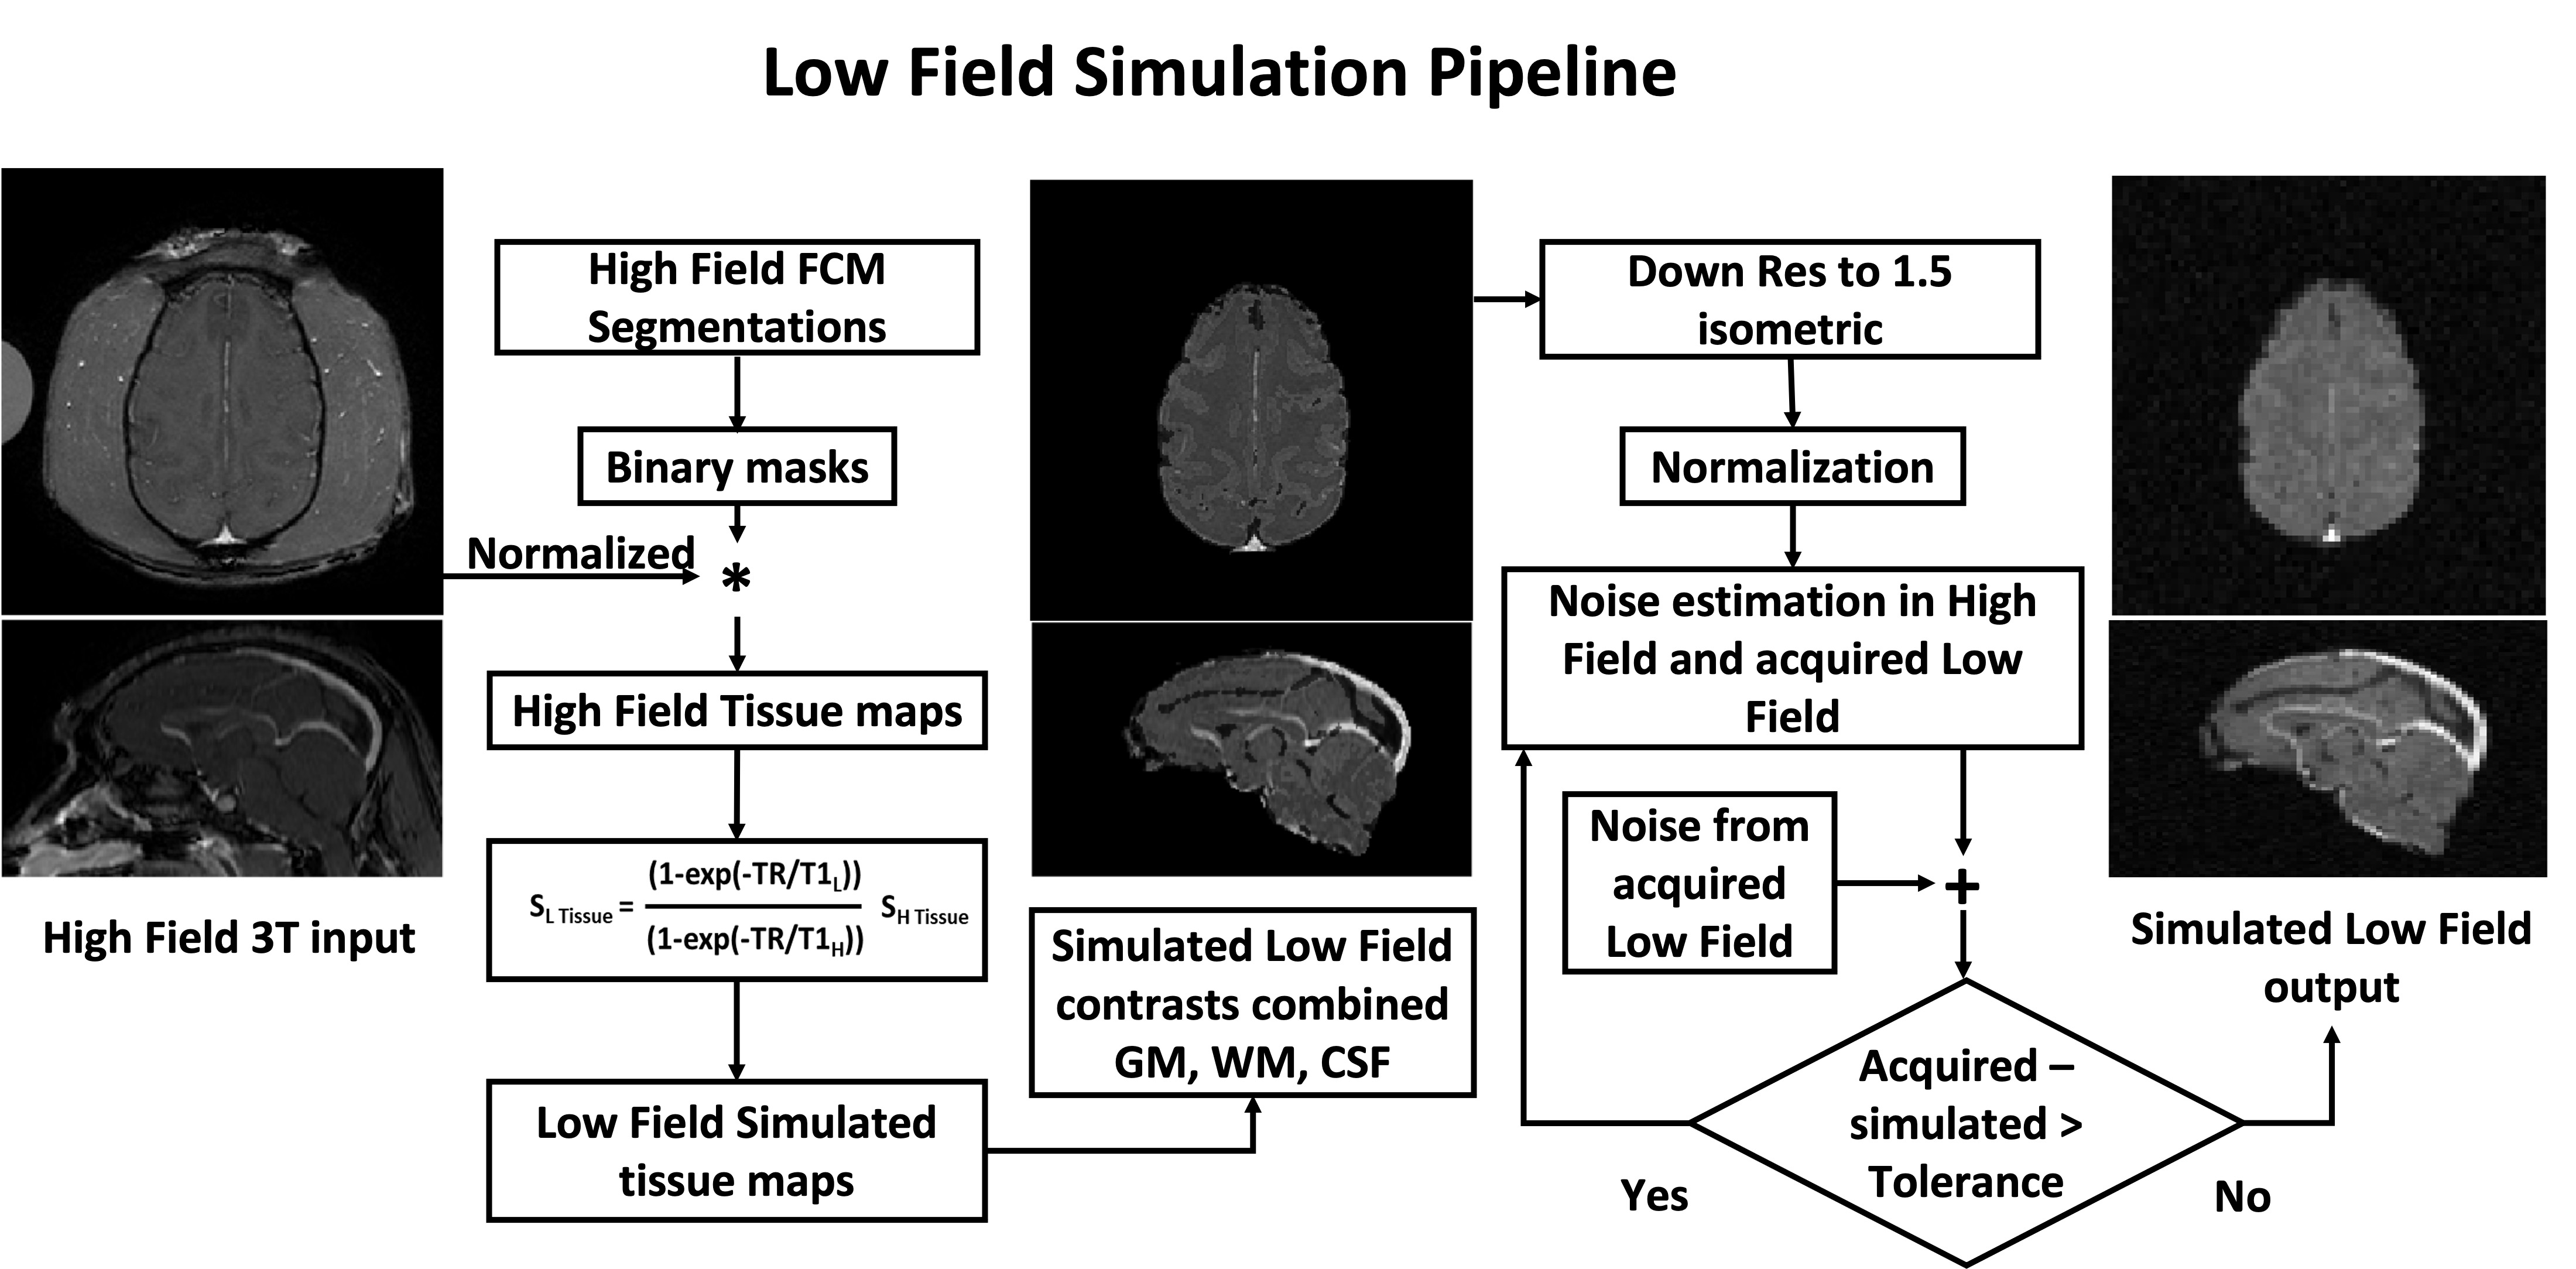
Figure 1: Flow chart showing the working of Low Field Simulation
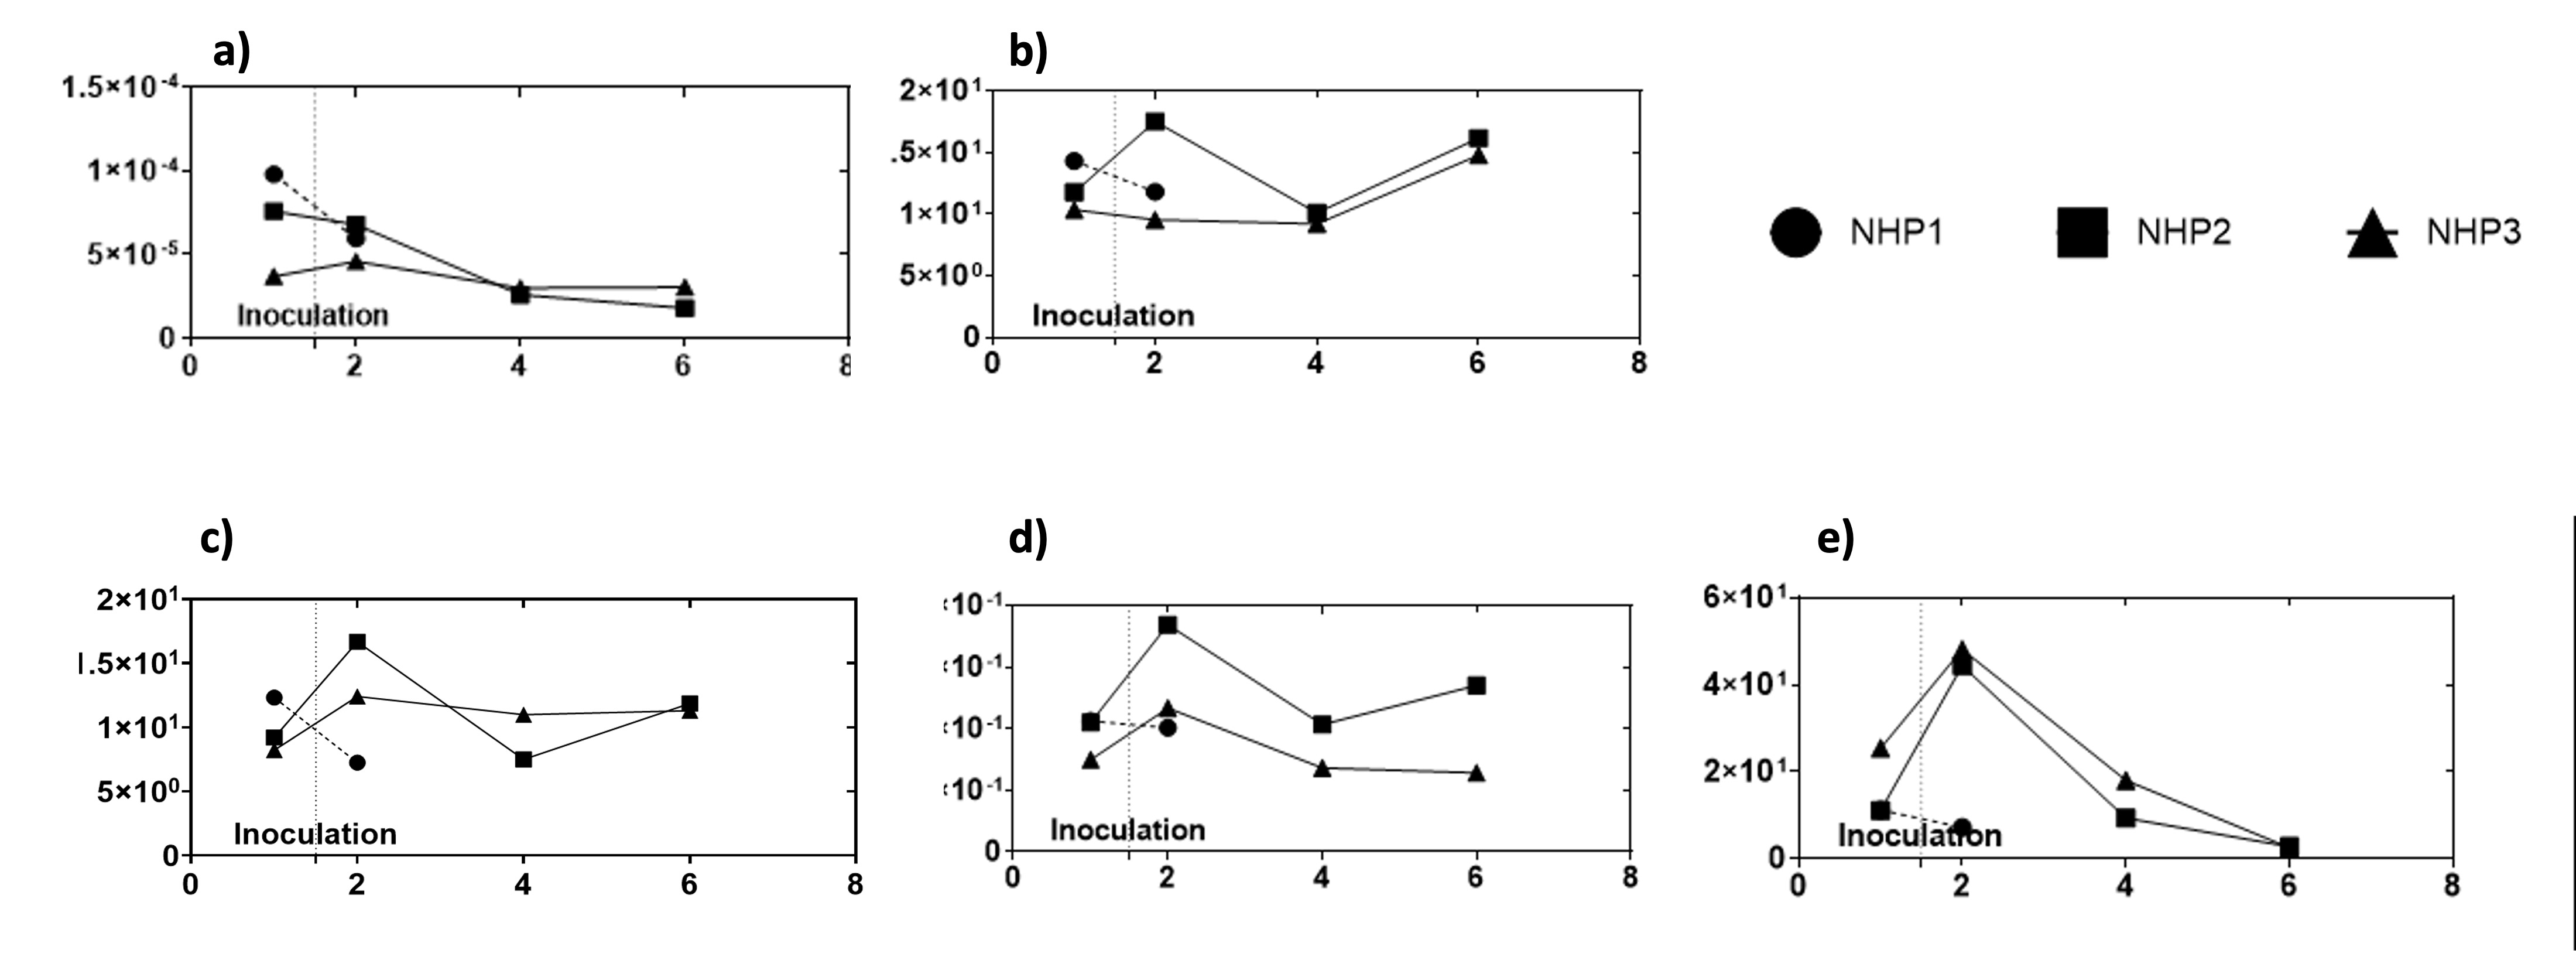
Figure 2: Textural features before and after inoculation of NiV in a) Medulla for Difference Variance b) Temporal Lobe for Sum of Average c) Frontal Lobe for Sum of Average d) Frontal Lobe for Difference Entropy e) Frontal Lobe for Sum of Squares Variance.
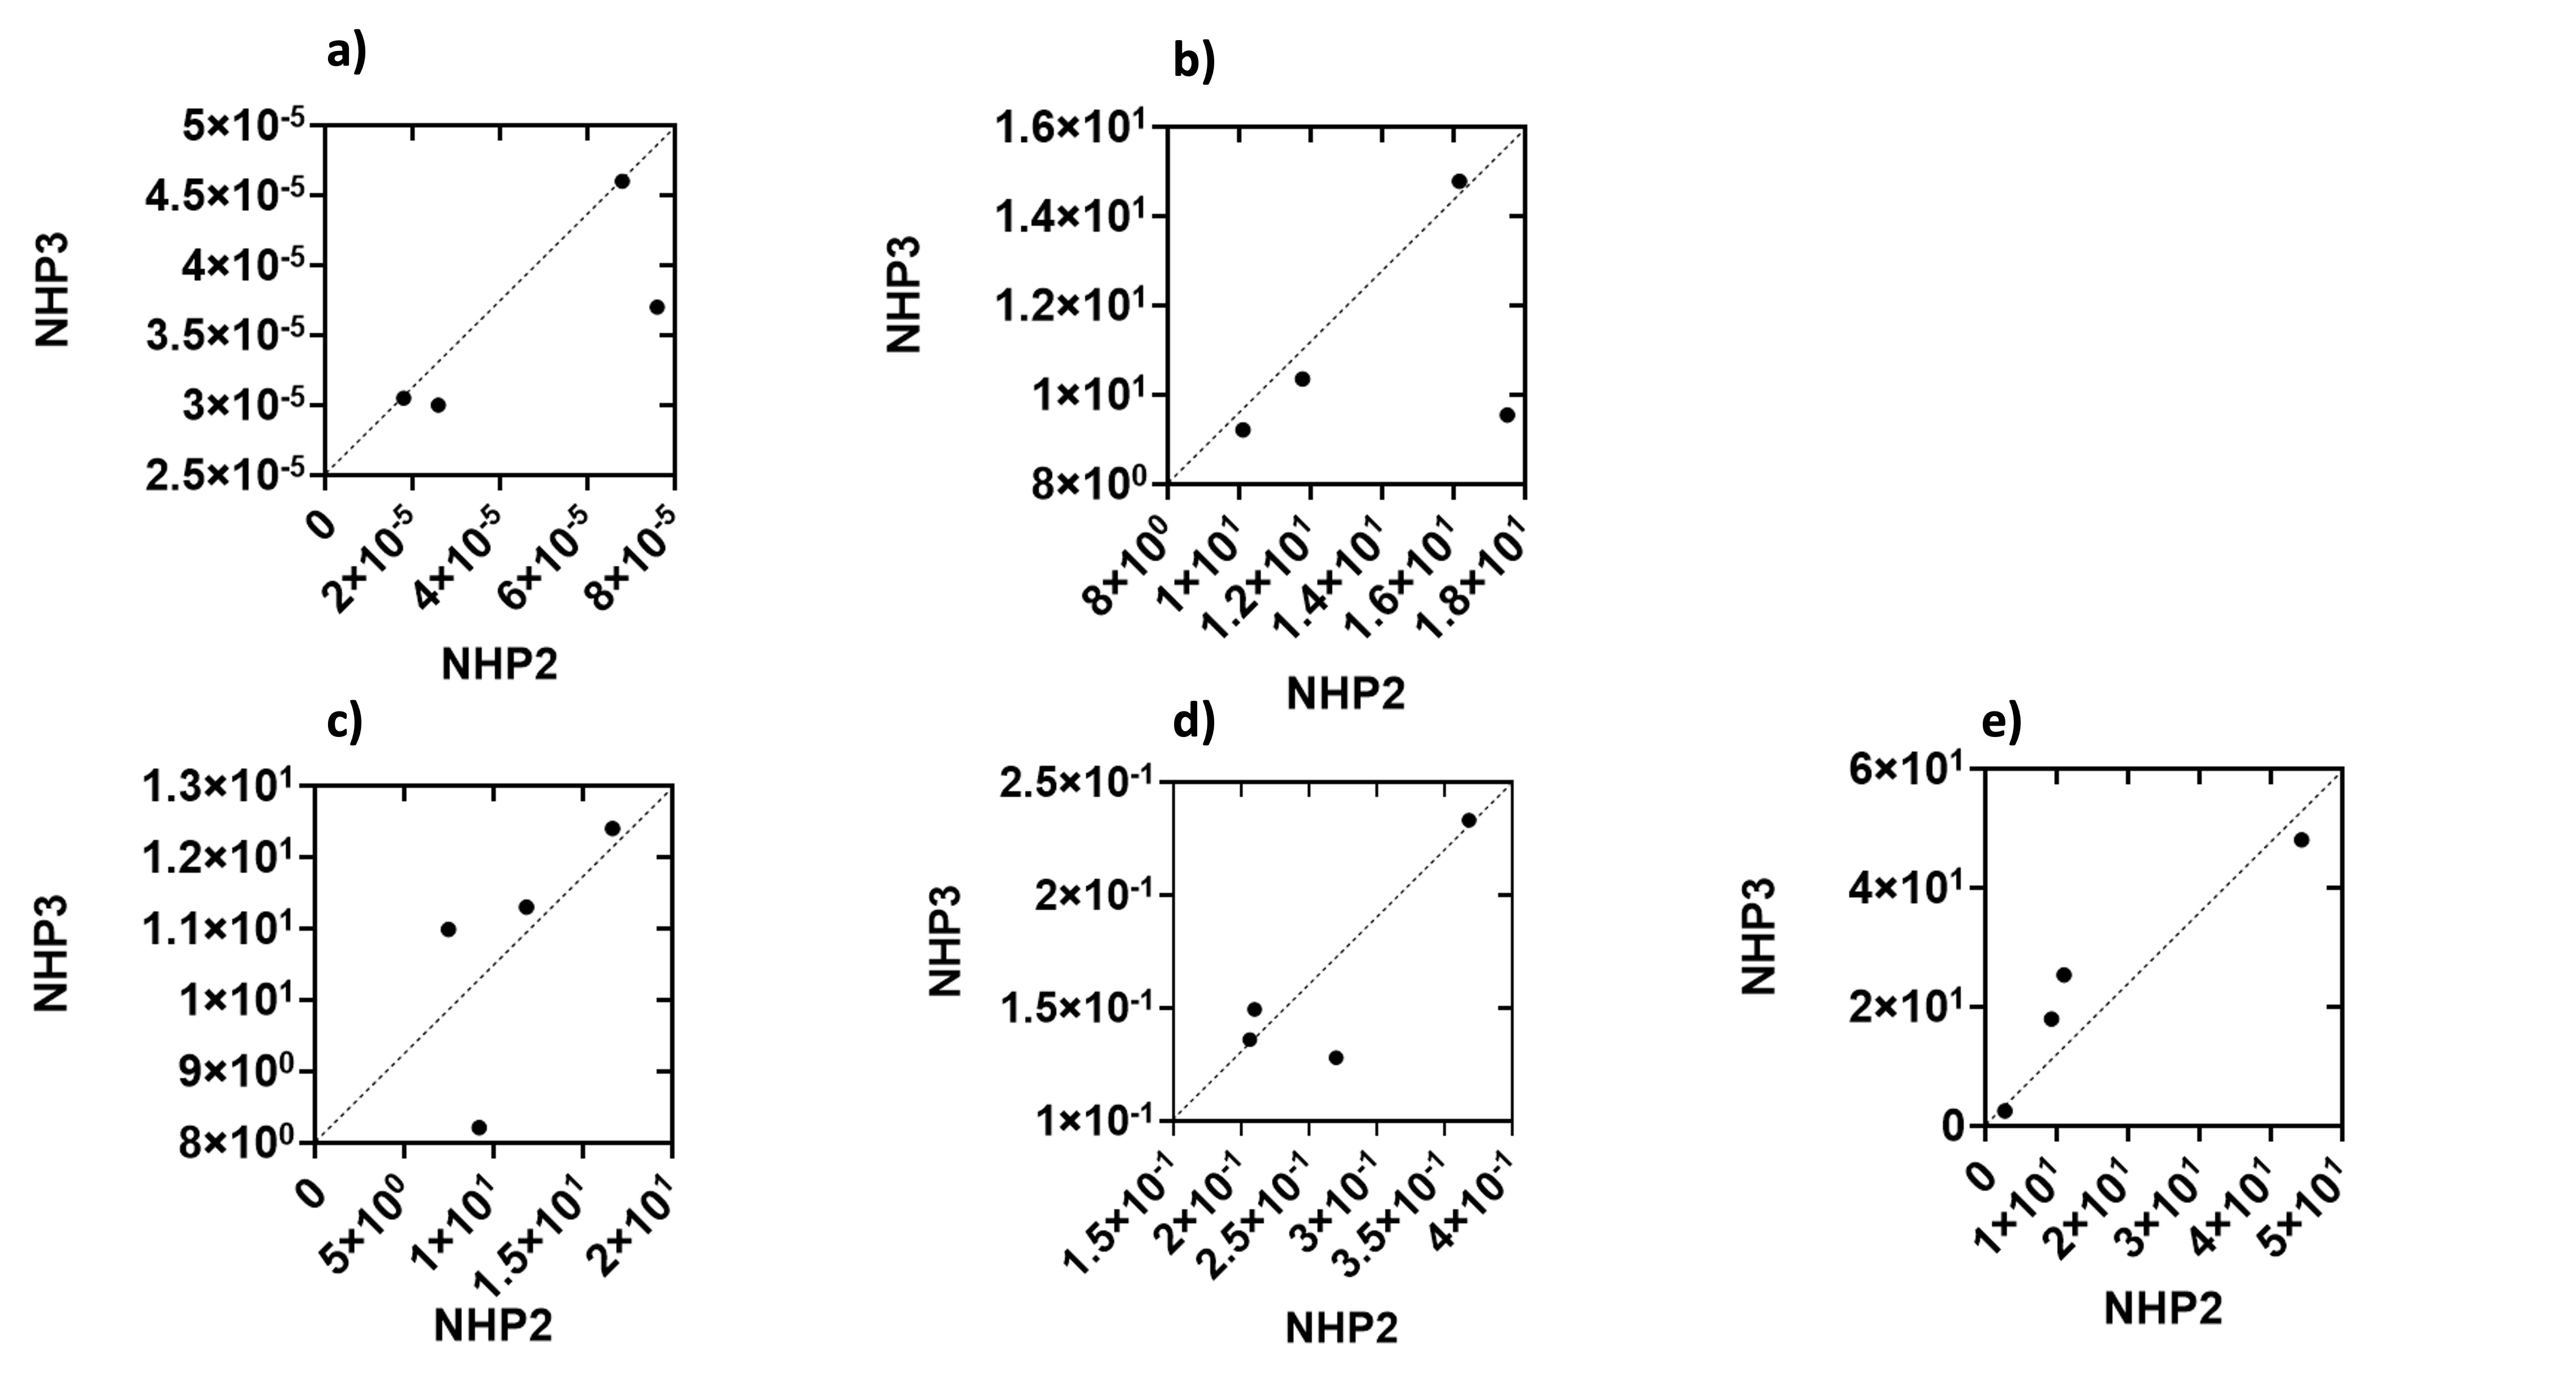
Figure 3: Correlation of textural features between NHP2 and NHP3 before and after inoculation of NiV in a) Medulla for Difference Variance b) Temporal Lobe for Sum of Average c) Frontal Lobe for Sum of Average d) Frontal Lobe for Difference Entropy e) Frontal Lobe for Sum of Squares Variance.
Figure 4: Low Field Simulation for different neuroanatomies: a) Medulla, b) Frontal Lobe, and c) Temporal Lobe at 3T while d) e) and f) are at 0.050T. g) Correlation of High Field and Low Field Simulated textural features for NHP1 for Medulla h) Temporal i), j), k) Frontal Lobe. j) and k) show a negative correlation.
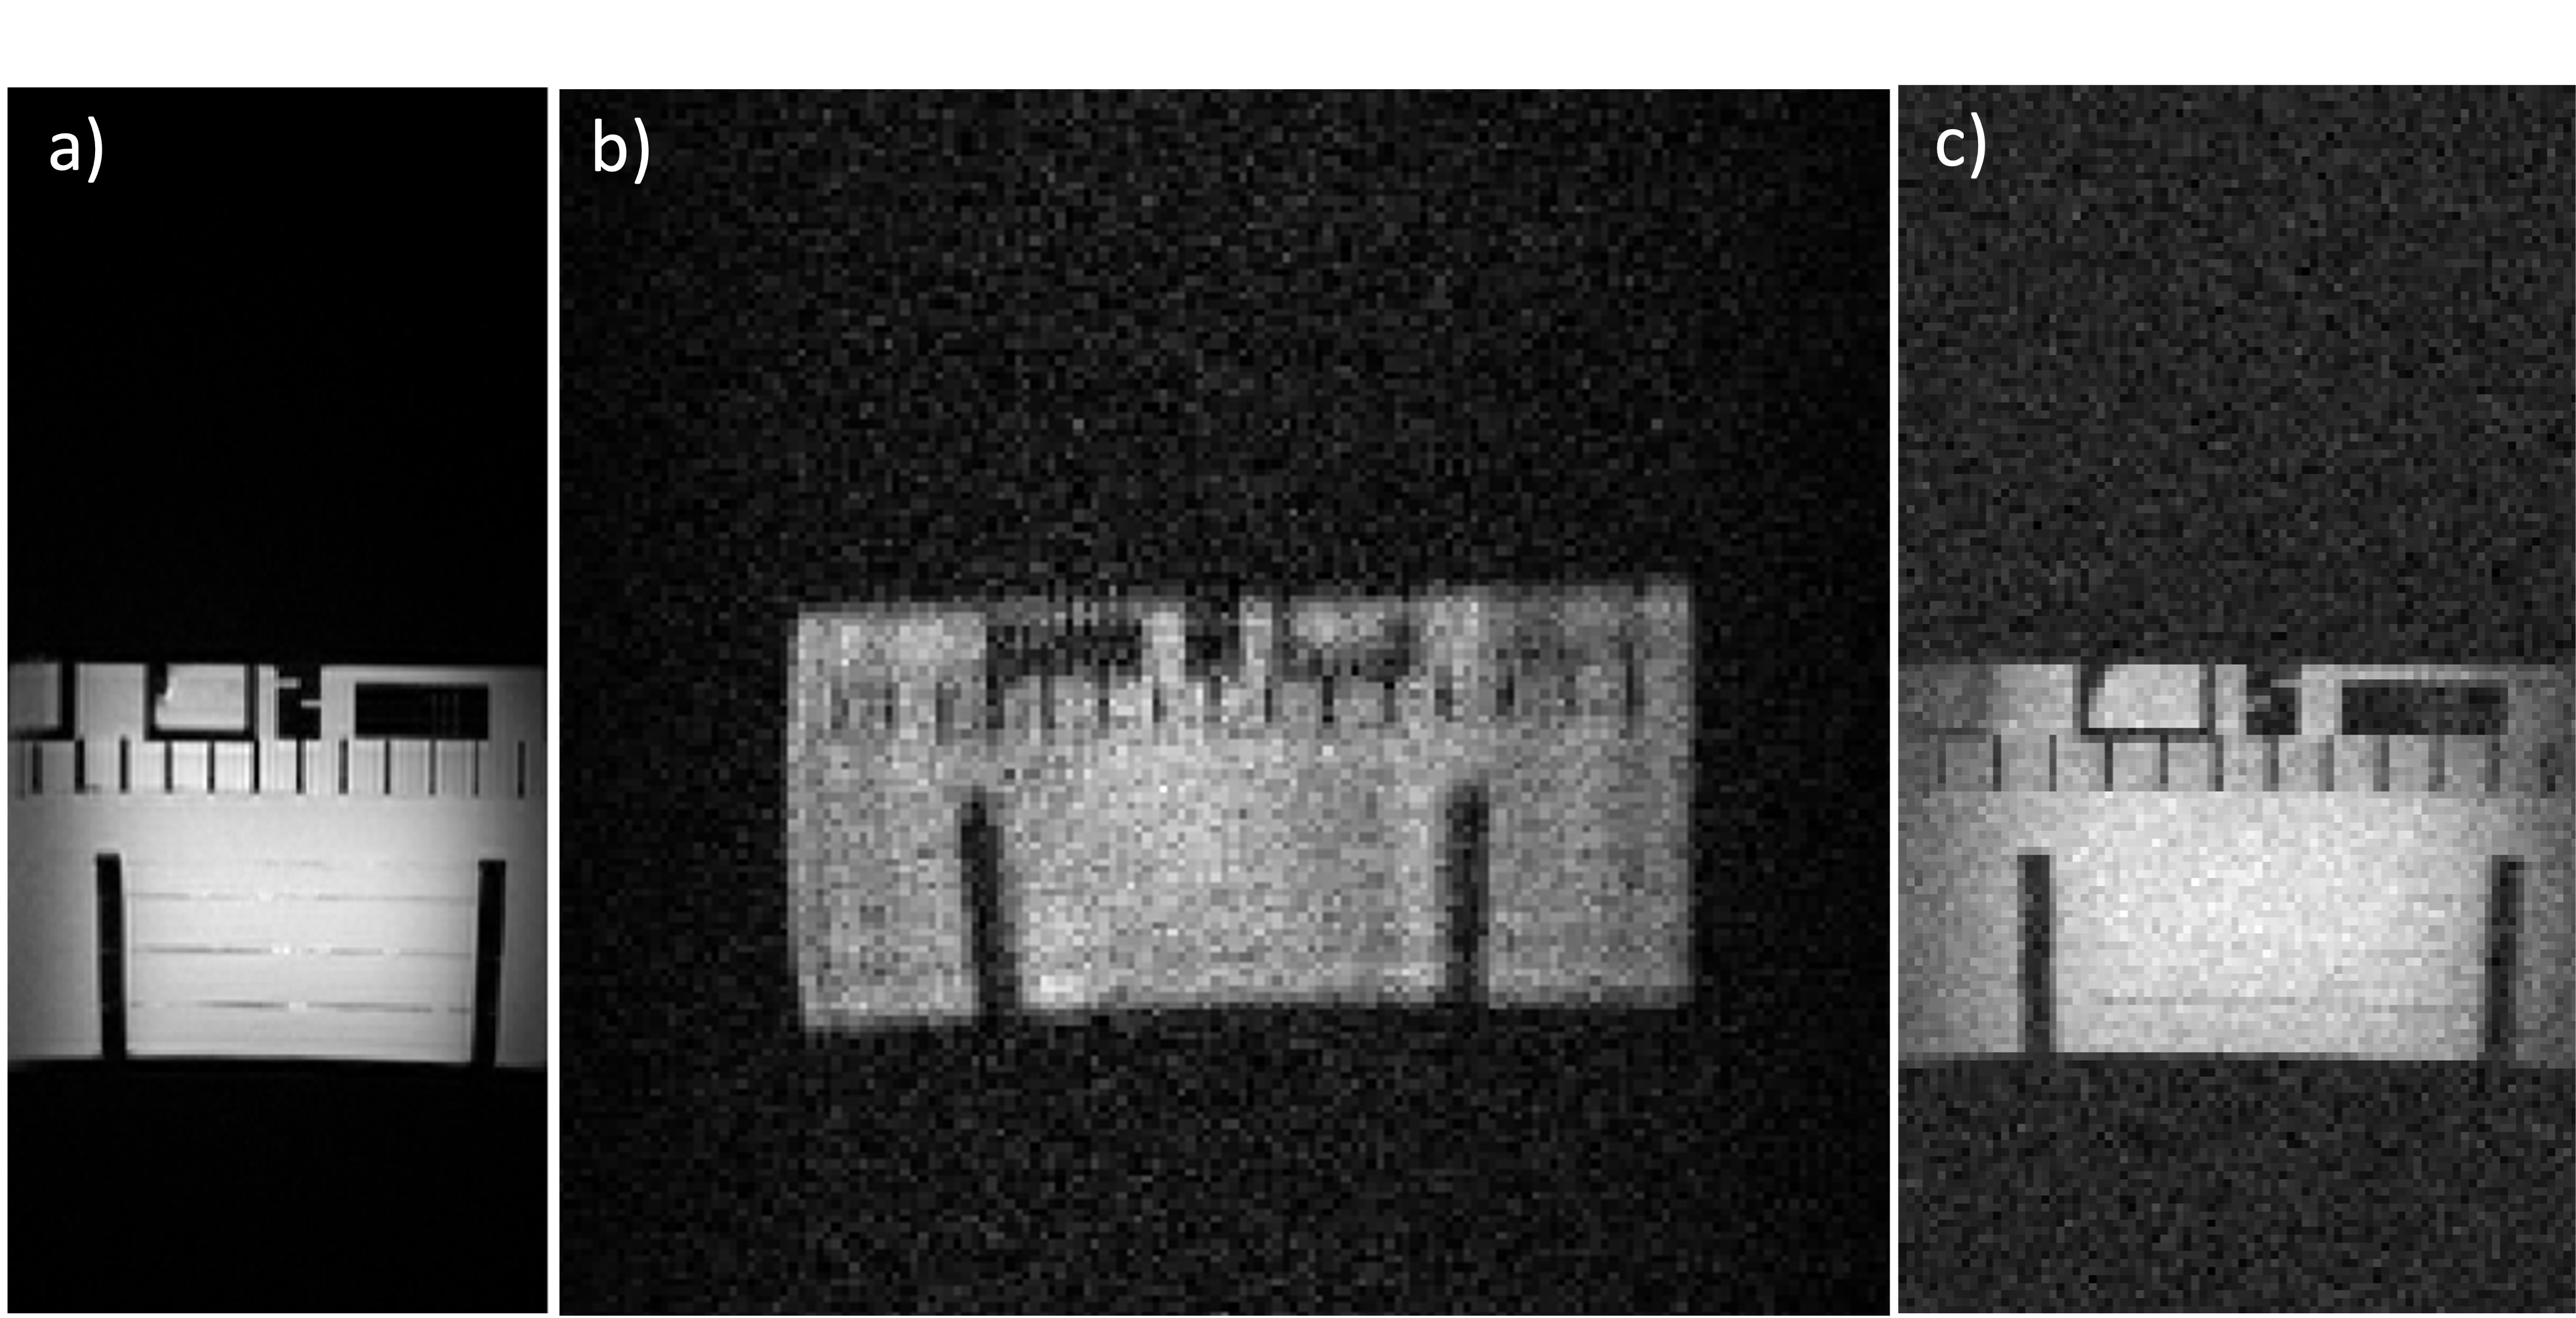
Figure 5: Low Field Simulation of phantom: a) High Field phantom b) Acquired Low Field phantom c) Simulated Low Field phantom
DOI: https://doi.org/10.58530/2023/2078