2076
A Machine Learning Approach for Identifying the Severity and Regional Anatomical Location of HIV Infection in the Brain1University of Miami, Miami, FL, United States, 2Postgraduate Institute of Medical Education and Research, Chandigarh, India
Synopsis
Keywords: Infectious disease, Machine Learning/Artificial Intelligence
Identifying and monitoring viral habitats of HIV in the brain is crucial to the advancement of treatment strategies for containing the infection. However, no in-vivo methods currently exist for this purpose. In this study, we demonstrate the use of a machine learning model that integrates brain measurements from MRSI, DTI, and DKI for identifying the severity and anatomical location of microstructural and metabolic abnormalities in the brain. This information may provide important clinical and diagnostic value for the treatment of people living with HIV.Introduction
The advent of antiretroviral therapy (ART) has greatly improved the survival rate and quality of life for people living with HIV (PLWH).1,2 Despite this success, latent reservoirs of HIV remain in the brain where the blood-brain barrier impedes the permeability and effectiveness of ART.3 Consequently, HIV infections continue to exert adverse effects on the central nervous system causing neuro-inflammation and neural degradation in association with neurocognitive and functional impairments in PLWH. Therefore, identifying and monitoring these viral habitats of HIV in the brain is crucial to the advancement of treatment strategies for containing the infection. Such efforts have been limited to autopsy specimens that can only provide information on terminal stages of the disease.3 In-vivo neuroimaging can therefore be a critical noninvasive tool for studying the neuro-pathogenesis of HIV. In this study, we propose a machine learning (ML) model that integrates multimodal brain measurements from MR spectroscopic imaging (MRSI), diffusion tensor imaging (DTI), and diffusion kurtosis imaging (DKI) for identifying the severity of microstructural and metabolic abnormalities at specific brain anatomical structures at an individual subject level.Methods
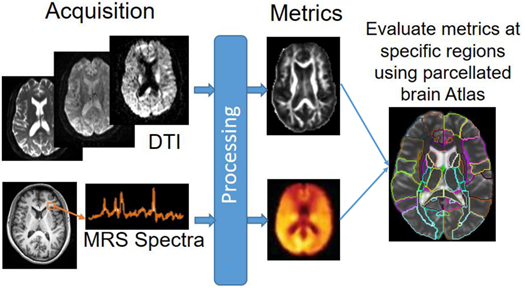
MRI Data were collected at the Post Graduate Institute of Medical Education & Research from 218 volunteers with 108 HIV+ subjects (78/30 male/female; age: 31.1±7.1), and 108 age-matched controls (72/36 male/female; age: 31.6±6.3). All HIV subject were ART-naïve with no treatment prior to scan. The protocol included: (a) whole-brain MRSI using 3-dimensional EPSI spin-echo sequence (TR/TE = 1551/17.6 ms, TI = 198 ms, 50×50 matrix size with 18 slices, FOV = 280×280×180 mm); and (b) DW-images (b = 1000/2000 s/mm2, 30 directions, TR/TE: 1150/98 ms; voxel dimension: 3.0×3.0×3.0 mm; 54 axial slices).MRSI data were processed with MIDAS4,5 using the Map-INTegrated (MINT) procedure which integrates spectra from voxels within an atlas defined region of interest (ROI) to create a single integrated spectrum and perform spectral fitting. Metabolites analyzed were Creatine (Cr), choline (Cho), N-acetylaspartate (NAA), myo-inositol (m-Ins), glutamate/glutamine (Glx), and their respective ratios over Cr. DW-images were pre-processed with FSL,6 followed by Dipy7 for DTI/DKI fitting from which we obtained: fractional anisotropy (FA), mean-, axial-, and radial-diffusivities (MD, AD, RD), kurtosis FA (kFA), mean-, axial-, and radial-kurtoses (MK, AK, RK). All MRSI and diffusion metrics were evaluated at 107 regions of interest (ROI) selected from the JHU-MNI-SS-type2 atlas8 (Figure 1).
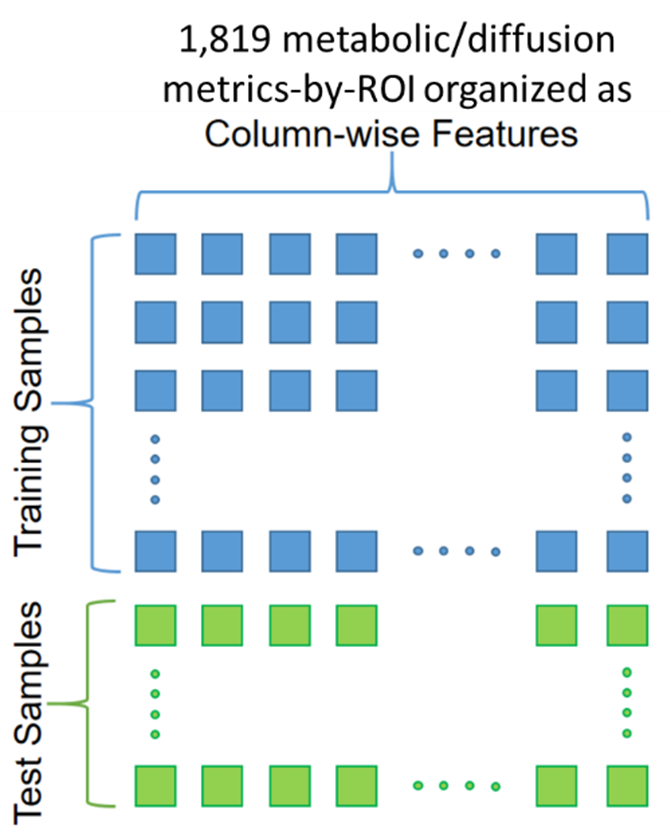
Following this process, we obtained 9 metabolic and 8 diffusion metrics at 107 ROIs for a total of 1819 metrics-by-ROI used as features for each sample (Figure 2). An ML model was implemented using a gradient boosting9 (XGB) algorithm with recursive feature-elimination for removing redundant features. Samples were labeled -1 for HIV- and +1 for HIV+. Therefore, the goal of the XGB model is to classify each test sample and predict an infection severity index (ISI) between -1 and +1 that reflects the degree of HIV infection. ISI was calculated using SHAP values,10-12 which are used to determine the contribution of each feature on the model’s prediction.
Results
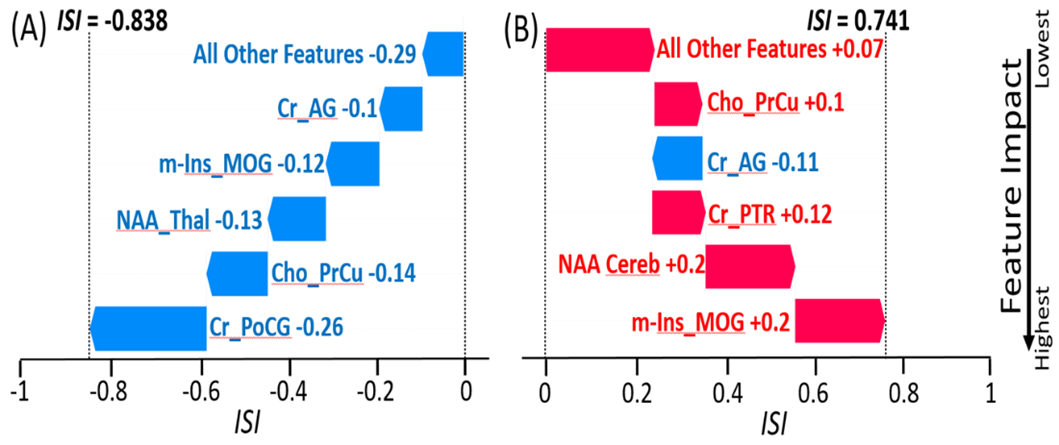
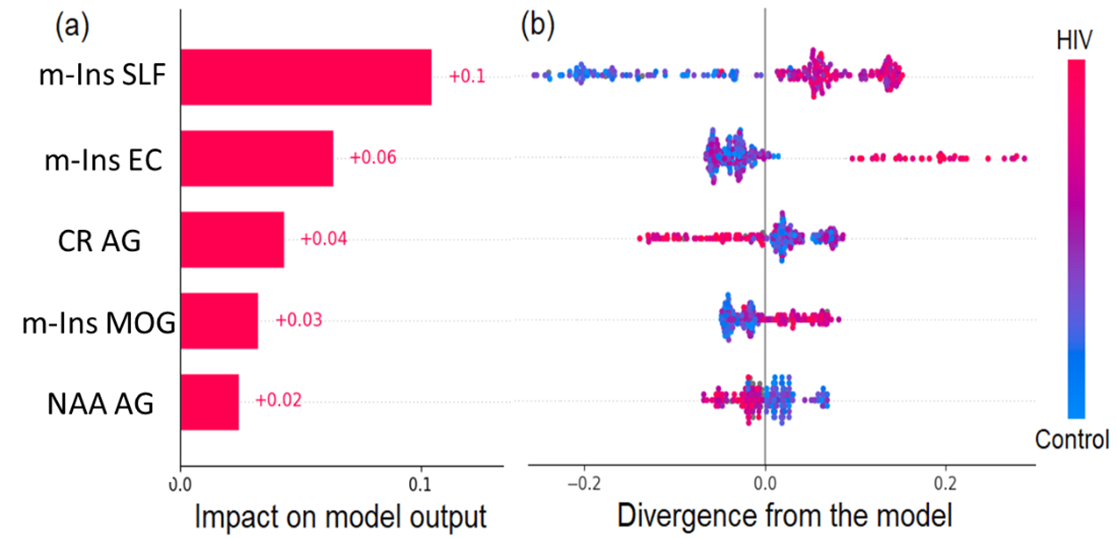
The XGB model was trained and tested with 216 samples (108 HIV-/108 HIV+), using 80/20% train/test split with random sampling. Training was performed using 5-fold cross-validation with 100 repetition for optimizing the model hyper-parameters. Testing produced an outcome of 0.81 accuracy, 0.75 Specificity, and 0.78 sensitivity. These values are above accuracy scores reported in the literature for HIV+ vs. control classification based on neuroimaging measures.13 Figure 3 shows the predicted ISI for a correctly classified HIV- subject (ISI = -0.838) and an HIV+ subject (ISI = 0.741), with the ranking of the most important features producing the result. In addition to the feature importance ranking for individual samples, feature importance was also evaluated for the overall model (Figure 4).Discussion
Our results showed that MRSI based features were more important than DTI/DKI derived features in classifying subjects as HIV+ or healthy control, at both the individual and global levels. This may indicate that metabolic abnormalities were more prominent than microstructural damages in our current population of recently infected HIV patient who were not on ART. Features with the largest impact on the overall model were m-Ins in the right superior longitudinal fasciculus (SLF), external capsule (EC) and mid-occipital gyrus (MOG), as well as Cr and NAA in the angular gyrus (AG) (Figure 4-a). Figure 4-b shows higher concentrations of m-Ins and Cr, and lower NAA for HIV+ subjects in those respective ROIs. Elevated m-Ins indicates that those ROIs are undergoing inflammation and gliosis, while lower NAA indicates reduces neuronal integrity. In addition, feature rankings are used to derive an ISI score and identify which regions are most affected at a single subject-level. Figure 3-b shows a correctly classified HIV+ subject with ISI=0.741, and an infection pattern that reveals higher m-Ins in the MOG, higher Cr in the Cerebellum and posterior thalamic radiation (PTR), higher Cho in the pre-Cuneus (PrCu), and lower NAA in the AG.Conclusion
This study demonstrates the use of ML for identifying the severity and anatomical location of brain microstructural and metabolic abnormalities due to HIV infection at a single subject level. This information may provide important clinical and diagnostic value for the treatment of PLWH.Acknowledgements
Funding from NIH grant, R01 NS094043, and CFAR pilot award GR019110.References
1. Castellano P, Prevedel L, Valdebenito S, Eugenin EA. HIV infection and latency induce a unique metabolic signature in human macrophages. Sci Rep. 2019;9(1):3941.
2. Ganor Y, Real F, Sennepin A, et al. HIV-1 reservoirs in urethral macrophages of patients under suppressive antiretroviral therapy. Nat Microbiol. 2019;4(4):633-644.
3. Churchill M, Nath A. Where does HIV hide? A focus on the central nervous system. Curr Opin HIV AIDS. 2013;8(3):165-169.
4. Maudsley AA, Darkazanli A, Alger JR, et al. Comprehensive processing, display and analysis for in vivo MR spectroscopic imaging. NMR Biomed. 2006;19(4):492-503.
5. Maudsley AA, Domenig C, Govind V, et al. Mapping of brain metabolite distributions by volumetric proton MR spectroscopic imaging (MRSI). Magn Reson Med. 2009;61(3):548-559.
6. Jenkinson M, Beckmann CF, Behrens TE, Woolrich MW, Smith SM. Fsl. Neuroimage. 2012;62(2):782-790.
7. Garyfallidis E, Brett M, Amirbekian B, et al. Dipy, a library for the analysis of diffusion MRI data. Frontiers in neuroinformatics. 2014;8:8.
8. Oishi K, Faria A, Jiang H, et al. Atlas-based whole brain white matter analysis using large deformation diffeomorphic metric mapping: application to normal elderly and Alzheimer's disease participants. Neuroimage. 2009;46(2):486-499.
9. Breiman L. Random Forests. Machine Learning. 2001;45:5-32.
10. Lipovetsky S, Conklin M. Analysis of regression in game theory approach. Applied Stochastic Models in Business and Industry. 2001;17(4):319-330.
11. Štrumbelj E, Kononenko I. Explaining prediction models and individual predictions with feature contributions. Knowledge and information systems. 2014;41(3):647-665.
12. Lundberg SM, Lee SI. A Unified Approach to Interpreting Model Predictions. 31st International Conference on Neural Information Processing Systems; 2017.
13. Adeli E, Zahr NM, Pfefferbaum A, Sullivan EV, Pohl KM. Novel Machine Learning Identifies Brain Patterns Distinguishing Diagnostic Membership of Human Immunodeficiency Virus, Alcoholism, and Their Comorbidity of Individuals. Biol Psychiatry Cogn Neurosci Neuroimaging. 2019;4(6):589-599.
Figures