2075
Shortening T2-weighted TSE for prostate MRI by reducing the number of echo-trains and using CS reconstruction1TechMed Centre, University of Twente, Enschede, Netherlands, 2Radboud UMC, Nijmegen, Netherlands
Synopsis
Keywords: Prostate, Cancer
The aim of this study was to speed up the turbo spin echo (TSE) sequence for prostate MRI by undersampling the k-space, while aiming to retain PSNR/SSIM. We conducted undersampling retrospectively by omitting echo-trains in the TSE sequence based on the proximity of the echoes (within the echo-trains) to the centre of the K-space. The proposed method speeds up the TSE acquisition time by 20%, while retaining the PSNR/SSIM for a kiwi phantom. Optimizing an undersampling pattern for prostate therefore can lead to a substantial decrease in the total scan time.
Introduction
Prostate cancer (PCa) is the second most common form of cancer in men , and the 5th leading cause of cancer related deaths world-wide1. The European Association of Urology (EAU) recommends a standard protocol called the multiparametric MRI (mpMRI) protocol to detect PCa. This protocol includes acquisition of high spatial resolution T2-weighted turbo spin echo (TSE) images in at least two planes2. The total scan time for an mpMRI protocol is 30-40 minutes, half of which consists of TSE acquisitions. Hence, speeding up these acquisitions has the potential to substantially speed up the mpMRI protocol. The aim of our research is to reduce the scan time of the TSE acquisitions while retaining image quality.In the TSE sequence, multiple echoes are acquired during one echo-train, and multiple echo-trains are recorded to sample the k-space. We propose to reduce the number of echo-trains, thereby introducing an incoherently undersampled k-space and still retaining image quality by using Compressed Sensing (CS) based reconstruction3.
Methods
T2 weighted TSE MR images in the transverse direction were acquired in a kiwi phantom4 and the prostate of a single healthy volunteer, on a 1.5T scanner (Aera, Siemens Healthineers, Germany). The acquisition parameters shown in Table 1 are similar to the PI-RADS protocol. However, there was no use of parallel imaging or averaging.Raw data from the acquired images was used for the implementation of undersampling using MATLAB (R2021b, MathWorks, USA). Various combinations of acquired echo-trains were used to retrospectively create an undersampled k-space. The first reconstruction was based on only one echo-train and sequentially all others were added. The order of adding echo-trains was determined by their location in k-space, where the echo-train containing the central k-space line was added first , followed by the echo-train which included the k-space lines above/below that, et cetera. This was done to ensure that the k-space centre is not heavily undersampled.The Berkley Advanced Reconstruction Toolbox (BART)5 was used for reconstructing the undersampled k-space using default values ( lambda = 0.01 ) for CS reconstruction. All images are compared to the fully sampled image by calculating peak signal to noise ratio (PSNR) and structural similarity index measure (SSIM) values.
Results
The first acquired echo train was removed from the dataset as it seemed to be corrupted. Sampling fewer echo-trains leads to an expected reduction in the PSNR/SSIM. However, the effect on the image quality differs for each echo-train as can be seen in Figure 1.Figure 2 shows the PSNR/SSIM values for different undersampling schemes in order of increasing number of sampled echo-trains. Figure 3 compares images reconstructed using a fully sampled and undersampled data sets. The under sampling pattern matches the performance of a fully sampled data set at 16 echo-trains.
Discussion
The first echo train leads to a decrease in image quality which is why it was removed. This effect might be caused by the fact that the magnetization of this echo train was not in steady state yet, but this will be subject to further research.Ghost artifacts can be observed in Figure 4, which can be attributed to the fact that k-space undersampling is not sufficiently incoherent. An improvement would be to acquire echo-trains in a more randomized pattern.
Finally, the aim is to retain diagnostic quality which can not be shown on this data but will be tested by retrospectively removing echo-trains from clinically acquired raw data of prostate cancer patients in the fastMRI project6 .
Conclusion
The proposed strategy of reducing echo-trains to reduce scan time is easily implemented in a clinical workflow, however results show a more randomized approach is favourable to remove ghost artifacts.This strategy can help reduce the total time of TSE scans by 20% while maintaining the PSNR/SSIM. To reduce scan time even further, the proposed method has to be optimized such that the undersampling pattern is sufficiently incoherent, and based on the echo-trains proximity to the K-space centre as well as on their respective PSNR/SSIM values.
Acknowledgements
No acknowledgement found.References
1)International Agency for Research on Cancer. Global Cancer Observatory . Available from: https://gco.iarc.fr/, (2022).
2)Prostate Imaging– Reporting and Data System Version 2.1. Available from https://www.acr.org/-/media/ACR/Files/RADS/PI-RADS/PIRADS-V2-1.pdf, (2019).
3) Lustig, M., Donoho, D. & Pauly, J. M. Sparse MRI: The application of compressed sensing for rapid MR imaging. Magnetic Resonance in Medicine: An Official Journal of the International Society for Magnetic Resonance in Medicine 58, 1182-1195 (2007).
4)Mueller-Lisse, U. G. et al. Everyman's prostate phantom: kiwi-fruit substitute for human prostates at magnetic resonance imaging, diffusion-weighted imaging and magnetic resonance spectroscopy.
5)BART Toolbox for Computational Magnetic Resonance Imaging. doi:10.5281/zenodo.592960.
6)Fast MRI in prostate cancer. (2021).
Figures
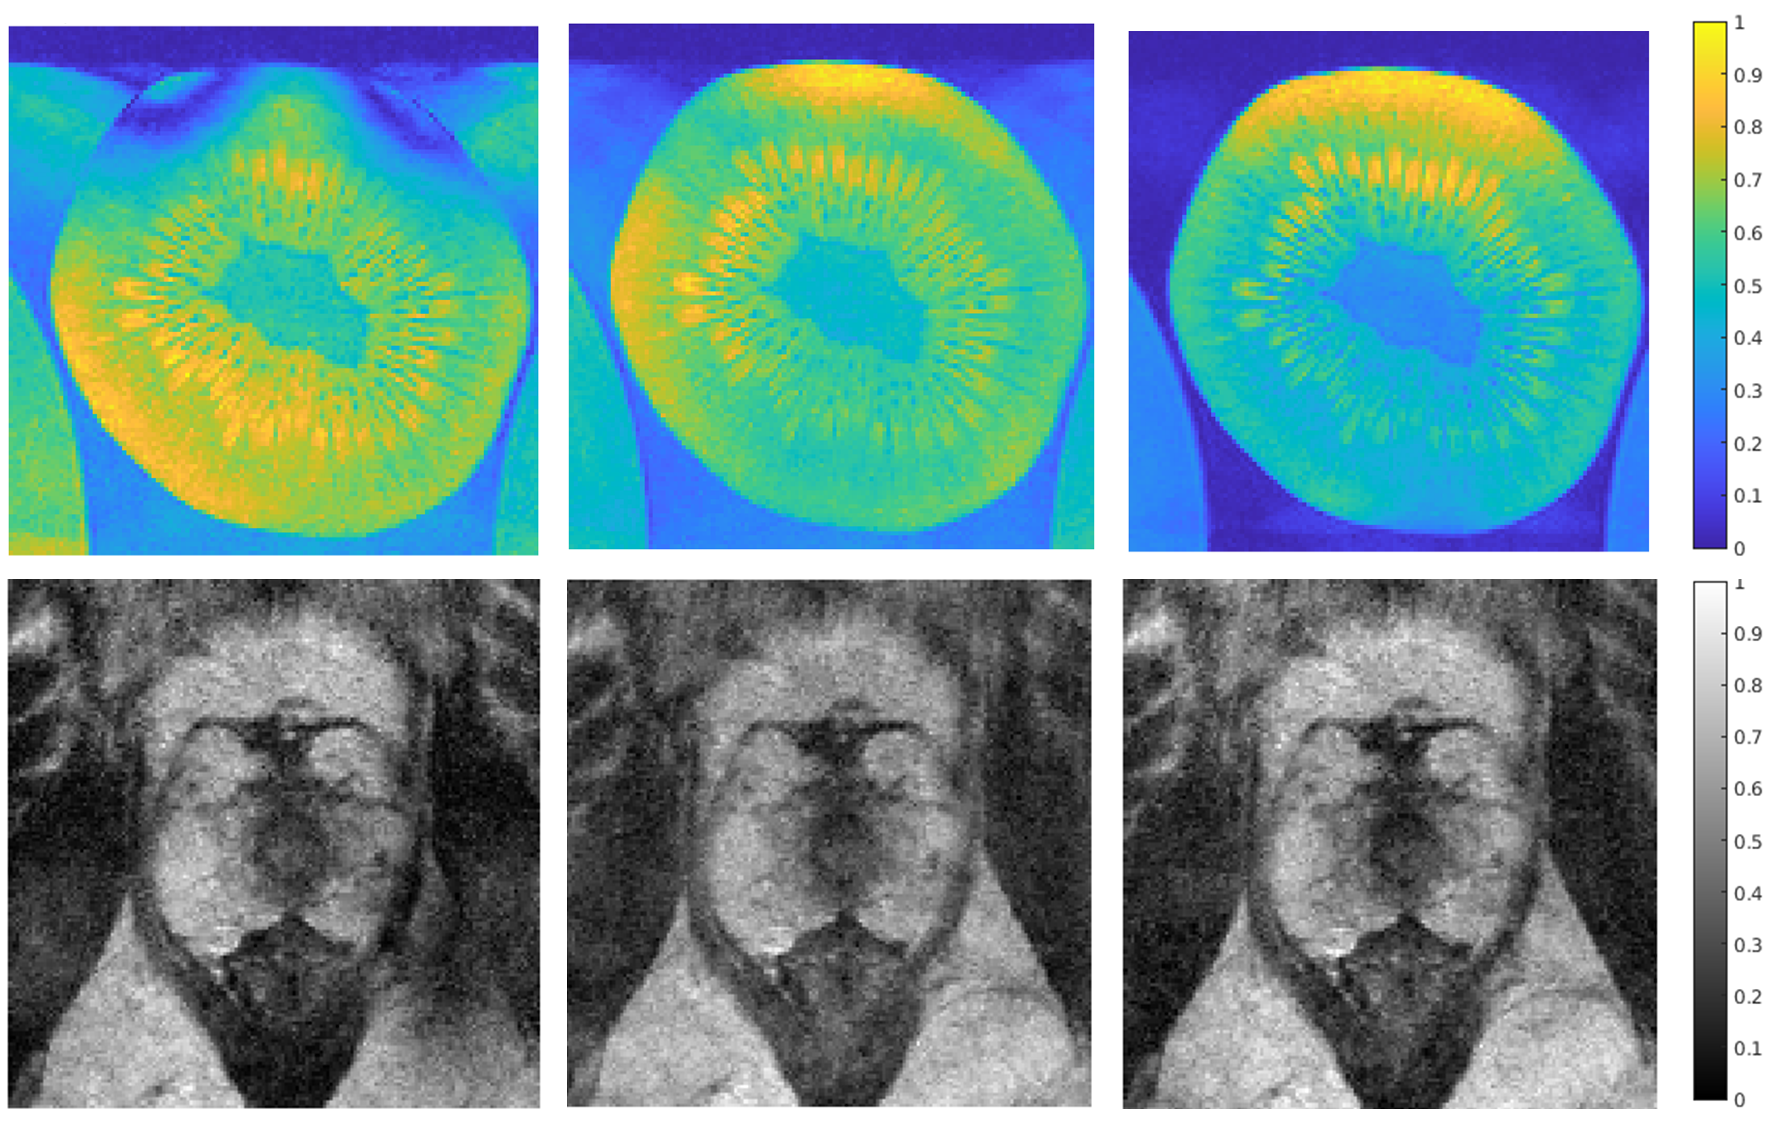
Figure 1: Kiwi phantom and Prostate MR reconstruction with different combinations of echo trains. The total number of sampled echo- trains is kept constant (18 out of 20), whereas the sampled echo-trains are changed.
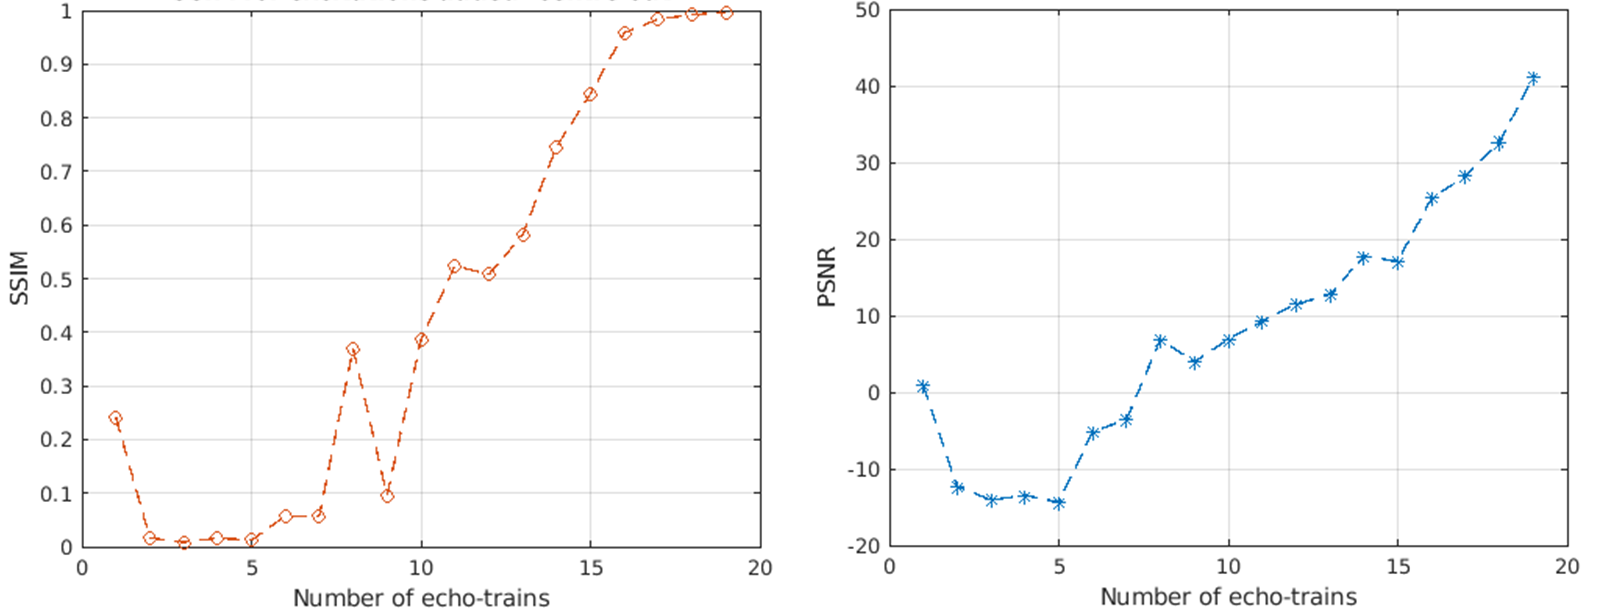
Figure 2: Graphs showing the change of SSIM (left) and PSNR (right) with added echo-trains. Statistics improve with more sampled echo-trains. SSIM reaches a plateau at the 16th excitation, meaning the echo-trains added thereafter do not improve the SSIM significantly.
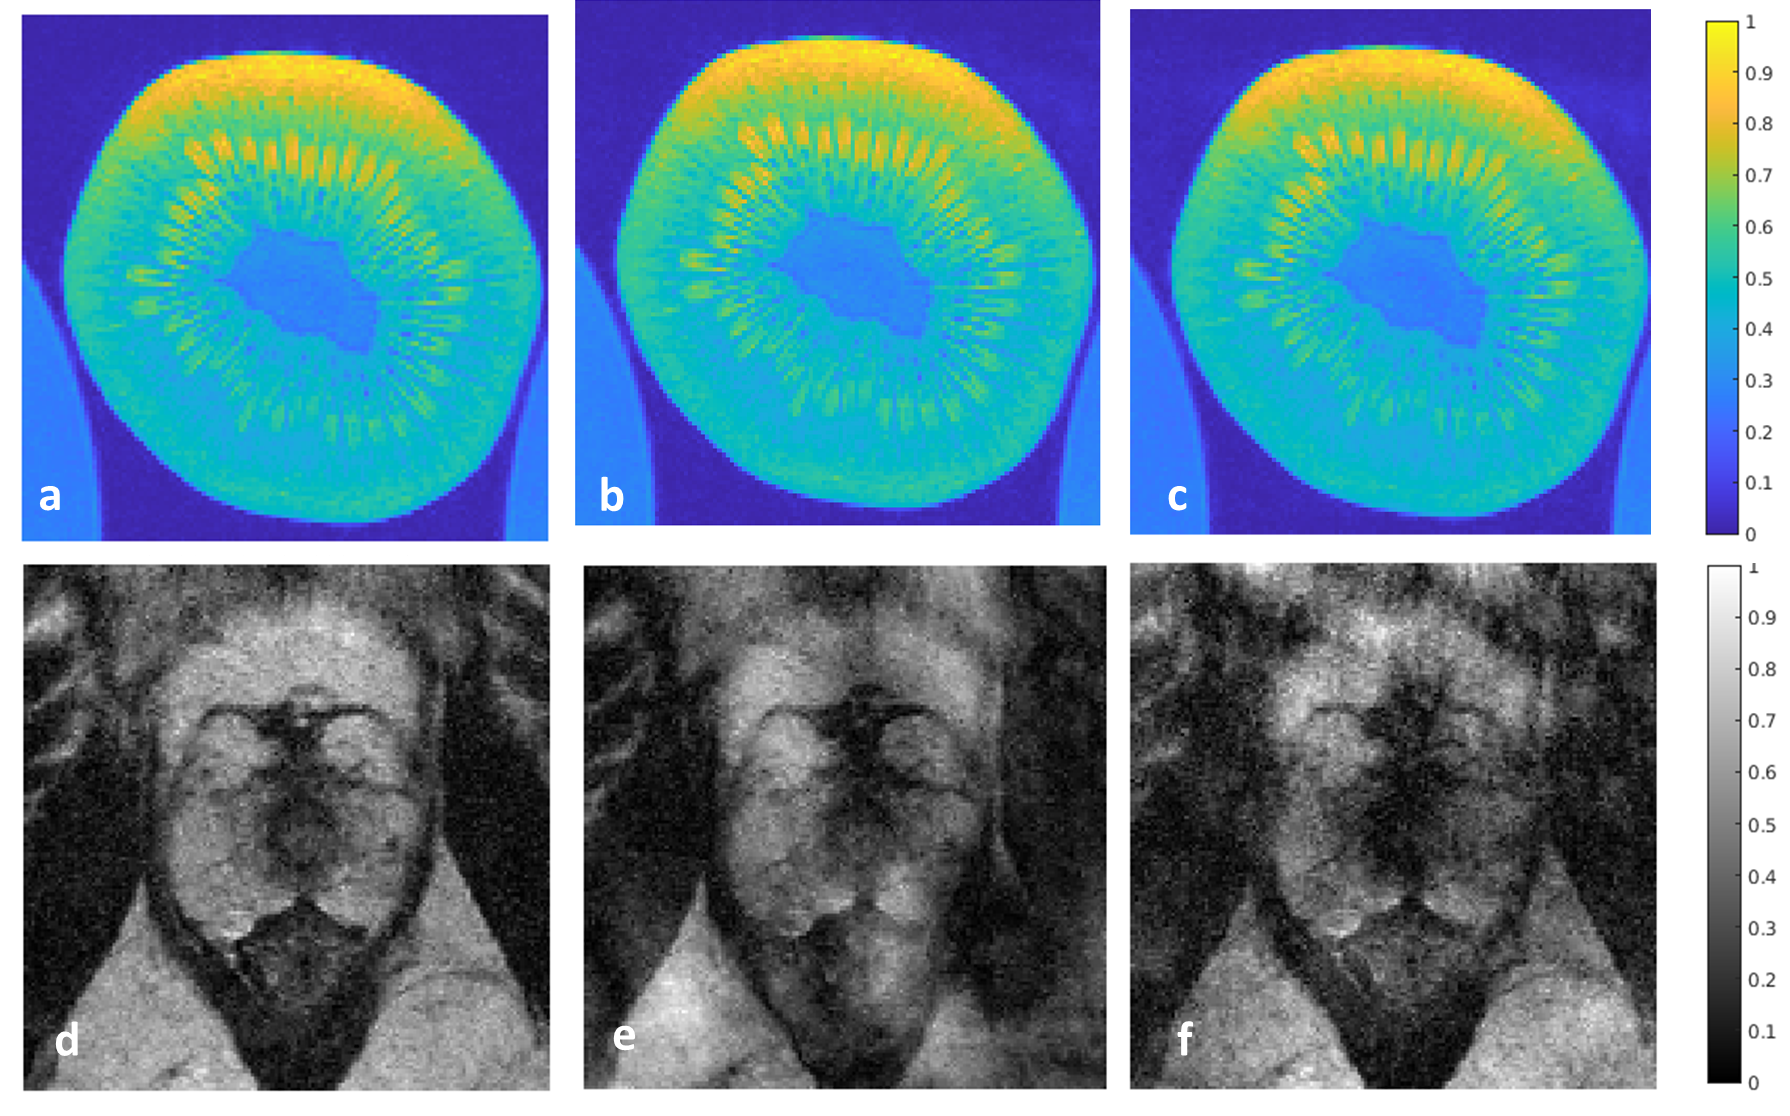
Figure 3: Kiwi phantom reconstructed using a) Fully sampled K-space b) undersampled k-space with 16 echo-trains (23.95/0.95) c) undersampled k-space with 17 echo-trains (26.95/0.97) . Prostate MR reconstruction using a) Fully sampled K-space b) undersampled k-space with 16 echo-trains (13.3/0.41) c) undersampled k-space with 17 echo-trains (19.39/0.64).

Figure 4: Ghost artifacts arising due to insufficient incoherence of the undersampled k-space.

Table 1: Acquisition parameters