2073
Application of Synthetic MRI in the Diagnosis and Invasion Assessment of Peripheral Zone Prostate Cancer1Clinical medicine school of Ningxia Medical University, Yinchuan, China, 2Department of Radiology, the First Hospital Affiliated to Hainan Medical College, Haikou, China, 3GE Healthcare, Beijing, China, 4Department of Radiology, General Hospital of Ningxia Medical University, Yinchuan, China
Synopsis
Keywords: Prostate, Data Processing
This retrospective study aims to investigate the application value of the quantitative relaxation maps derived from synthetic MRI in the diagnosis and invasion assessment of peripheral zone (PZ) prostate cancer (PCa). 88 patients (45 experimental & 43 control) were scanned using the magnetic resonance image compilation (MAGiC) sequence and the quantitative relaxation metrics were calculated and compared. The results demonstrate that quantitative T1 and T2 values are significant indicators for distinguishing PZ PCa from non-cancerous PZ. T2 value has a similar diagnostic performance to apparent diffusion coefficient value and has potential clinical value in evaluating the invasiveness of PCa.Summary of Main Findings
Quantitative T1 and T2 relaxation times derived from synthetic MRI can distinguish peripheral zone prostate cancer from non-cancerous peripheral zone, and T2 value has a similar diagnostic performance to ADC value.Introduction
Prostate cancer (PCa) has the first incidence rate and the second mortality rate among male malignant tumors in the United States1, and its incidence in China is rising rapidly in recent years. Accurate diagnosis is crucial to the treatment planning of PCa. Nowadays, prostate imaging reporting and data system (PI-RADS) scores combined with multi-parametric MRI have become a widely used diagnostic criteria of PCa in clinical practice. Despite the reported high accuracy, PI-RADS is subjective and based on qualitative assessment2. A novel synthetic MRI technique, magnetic resonance image compilation (MAGiC), can simultaneously quantify multiple intrinsic magnetic properties of tissues in a practically acceptable scan time by using a multi-echo and multi-delay sequence3. Various previous studies have using MAGiC in central nervous system, breast, and prostate3-6 to achieve a quantitative analysis of the cancerous tissue. This study aims to investigate the application value of quantitative relaxation maps derived from MAGiC in the diagnosis and invasion assessment of peripheral zone (PZ) PCa.Methods
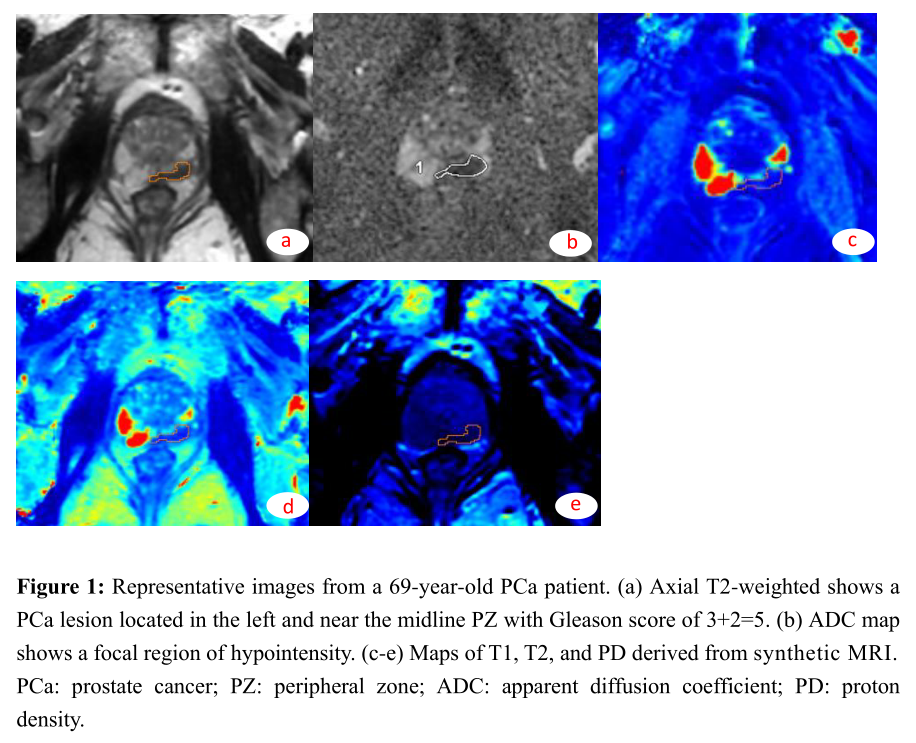
Participants Our Institutional Review Board approved the scan protocol and written informed consent was obtained from each subject before the scan. 45 patients with pathologically confirmed PZ PCa lesions were classified into the experimental group, while the control group consisted of other 43 patients diagnosed with benign prostatic hyperplasia (BPH) or chronic prostatitis.Data acquisition & post-processing All MR examinations were performed on a 3.0T MR scanner (SIGNA™ Architect; GE Healthcare, Milwaukee, WI, USA) equipped with a 32-channel phased-array coil. For each patient, a MAGiC sequence and a diffusion weighted imaging (DWI) sequence were scanned. The scan parameters of the MAGiC sequence were: FOV = 38×38 cm2, acquisition matrix =320×256 , TR/TE = 4000/19 ms, slice thickness/gap = 4/1 mm, NEX = 1, and scan time = 4:32. For DWI, the scan parameters were: FOV = 26×26 cm2, acquisition matrix =180×90 , TR/TE = 5369/73 ms, slice thickness/gap = 3/1 mm, NEX = 10, b value = 1000 s/mm2.,and scan time = 1:24. The post-processing of the MAGiC and DWI images was directly performed on the MR scanner host machine using the corresponding software to acquire maps of various quantitative metrics (T1, T2, PD, and apparent diffusion coefficient (ADC)).
Statistical Analysis All statistical analyses were conducted with SPSS (v26.0, IBM, USA). Comparisons between groups were performed with either the Student t-test or Mann-Whitney. For each quantitative metric, the receiver operating characteristic (ROC) curve was plotted, whereafter the area under the curve (AUC) was calculated.
Results
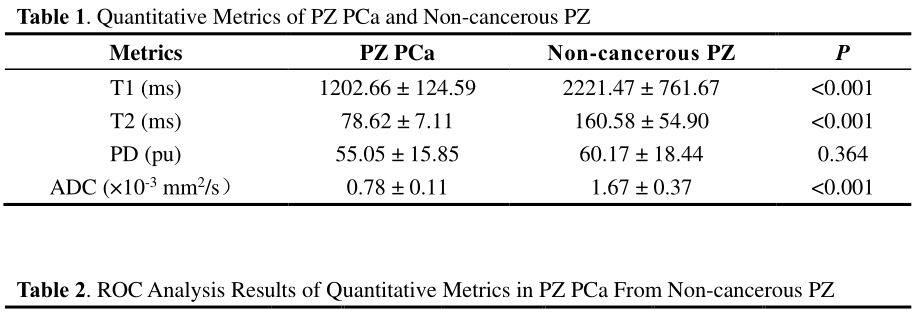
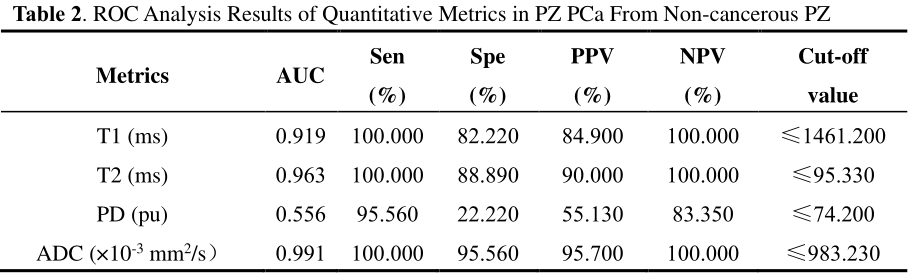
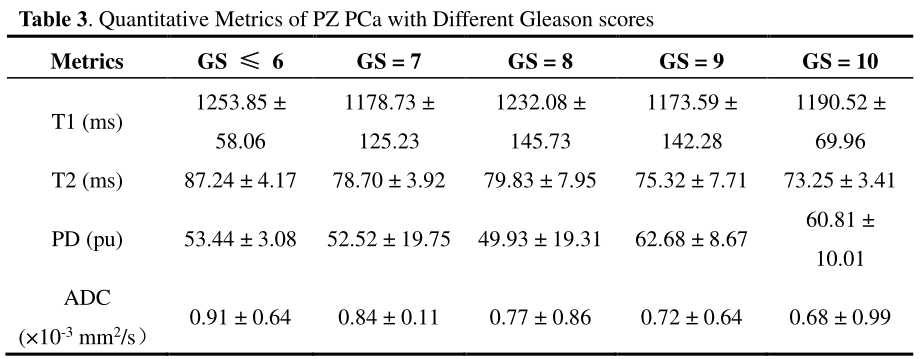
As shown in Table 1, the T1 and T2 values of the experimental group were all significantly lower than those of the control group (P<0.001), while the PD value showed no statistically significant difference (P>0.05) between the two groups. The AUC of T2 value was similar to the ADC value in distinguishing PZ PCa from non-cancerous PZ (0.963 and 0.991, P = 0.105, Table 2). The ADC and T2 values were all negatively correlated with the Gleason scores (r = -0.875 and -0.572, all P < 0.05, Table 3).Discussion
Our study demonstrated that quantitative metrics T1 and T2 values derived from synthetic MRI are significant indicators for distinguishing PCa from non-cancerous PZ, and T2 value has the similar diagnostic performance to ADC value. The T2 of synthetic MRI has potential clinical value in evaluating and predicting the invasiveness of prostate cancer. There are published literatures found that the T1 and T2 values of the prostate peripheral zone cancer were significantly lower than those in non-cancerous peripheral zone7,8, which is consistent with the results of our study. In the study of invasion assessment of prostate cancer, The correlation of the Gleason score with the T2 value showed a highly inverse correlation with r=-0.875 (P < 0.01),and there was moderately inverse correlation (r = -0.572, P < 0.05) between T2 values and Gleason score. The higher correlation coefficients of the T2 value with the Gleason score we reported compared with the previous studies may be attributed to the case group only including peripheral zone PCa9,10, also have studies reported the diverse results about the correlation between the ADC value and Gleason score11.Conclusion
In conclusion, quantitative T1 and T2 maps derived from synthetic MRI can help distinguish PZ PCa from non-cancerous PZ, and T2 value could be potential in the evaluating of the invasiveness of PCa.Acknowledgements
This study was supported by grants from The Key Research and Development Program of Ningxia (No.2019BEG03033) and Natural Science Foundation of Ningxia(2022AAC03472). Author contributions: conception and design: Yunshu Zhou,Zhiqiang Chen,Na Song, and Zhuo Wang; acquisition of data: Shaoru Zhang, Xiaohua Chen, Xiaocheng Wei,and Aijun Wang; Data analysis and interpretation: Zhiqiang Chen and Yunshu Zhou; drafting the article and revising it critically for important intellectual content: Zhiqiang Chen; final approval of manuscript: all authors. The authors declare no conflicts of interest.References
[1] Siegel RL, Miller KD, Jemal A, et al. Cancer statistics, 2021. CA Cancer J Clin2021;71(1):7-33.
[2] Greer MD, Brown AM, Shih JH, et al. Accuracy and agreement of PIRADSv2 for prostate cancer mpMRI: A multireader study. J Magn Reson Imaging2017;45(2):579-585.
[3] Goncalves FG, Serai SD, Zuccoli G. Synthetic Brain MRI: Review of Current Concepts and Future Directions. Top Magn Reson Imaging2018;27(6): 387-393.
[4] Jung Y, Gho SM, Back SN, et al. The feasibility of synthetic MRI in breast cancer patients: comparison of T2 relaxation time with multiecho spin echo T2 mapping method. Br J Radiol2018; 92(1093):20180479.
[5] Cui Y, Han S, Liu M, et al. Diagnosis and Grading of Prostate Cancer by Relaxation Maps From Synthetic MRI. J Magn Reson Imaging2020; 52(2): 552-564.
[6] Boudabbous S, Neroladaki A, Bagetakos I, et al. Feasibility of synthetic MRI in knee imaging in routine practice. Acta Radiol Open2018; 7(5): 2058460118769686.
[7] Lee CH. Quantitative T2-mapping using MRI for detection of prostate malignancy: a systematic review of the literature. Acta Radiol2019; 60(9): 1181-1189.
[8] Turkbey B, Rosenkrantz AB, Haider MA, et al. Prostate Imaging Reporting and Data System Version 2.1: 2019 Update of Prostate Imaging Reporting and Data System Version 2. Eur Urol2019; 76(3): 340-351.
[9] Mai J, Abubrig M, Lehmann T, et al. T2 Mapping in Prostate Cancer. Invest Radiol2019; 54(3): 146-152.
[10] Chatterjee A, Devaraj A, Mathew M, et al. Performance of T2 Maps in the Detection of Prostate Cancer. Acad Radiol2019; 26(1): 15-21.
[11] Surov A, Meyer HJ, Wienke A. Correlations between apparent diffusion coeffificient and Gleason score in prostate cancer: A systematic review. Eur Urol Oncol2020; 3(4):489-497.
Figures