Guorui Hou1 and Kai Ai2
1Department of Radiology, Xijing Hospital, Xi'an, China, 2Philips Healthcare, Xi‘an, China
Synopsis
Keywords: Prostate, Tumor, amide proton transfer imaging
Prostate
cancer (PCA), which seriously hazard the life and health, is one of the most
common malignant tumors in middle-aged and elderly men, and the incidence
population tends to be younger. Amide proton
transfer imaging (APT) and intravoxel incoherent motion imaging (IVIM) are two
technologies that can be used for prostate cancer diagnostic. This study aims
to compare and analyze the diagnostic performance of APT and IVIM in prostate
diseases. Besides, we also test the relationship between APT and IVIM derived
parameters and Gleason score (GS).
Introduction
The current gold standard
for prostate cancer (PCA) diagnosis is transrectal ultrasound guided needle
biopsy of the prostate [1,2]. However, it is an invasive way which can lead to some complications. Magnetic resonance imaging is an important method in diagnosis
of prostate diseases, but it is easily affected by bleeding and necrosis. As a new magnetic resonance imaging technology, 3D APT
can detect the content of intracellular free proteins and peptides without
exogenous contrast agent, and then indirectly reflect the metabolism and
physiological and pathological information of living cells. IVIM uses double exponential model, which can not
only show the diffusion of water molecules in voxels, but also reflect the
blood microcirculation perfusion information [3]. Studies have shown
that APT and IVIM have certain diagnostic value for prostate diseases [4,5].
However, there are few comparative studies on the diagnostic performance of APT
and IVIM for prostate cancer. This study aims to compare the diagnostic
performance of APT and IVIM in prostate cancer diagnostic. Moreover, we test
the correlation between APT and IVIM derived parameters with Gleason score
(GS).Methods
MR Imaging
data and pathological information of 54 patients with prostate diseases were
collected, which including 30 patients with benign prostatic hyperplasia (BPH)
and 24 patients with prostate cancer. According to the
results of pathological biopsy, the Gleason score of prostate cancer foci was
performed. According to GS, the patients were divided into medium-low risk
group (9 cases, GS≤7) and high-risk group (15 cases, GS > 7). All patients underwent MR Imaging on a 3.0-T scanner
(Ingenia CX, Philips Healthcare, the Netherlands) with a 16-channel phase-array
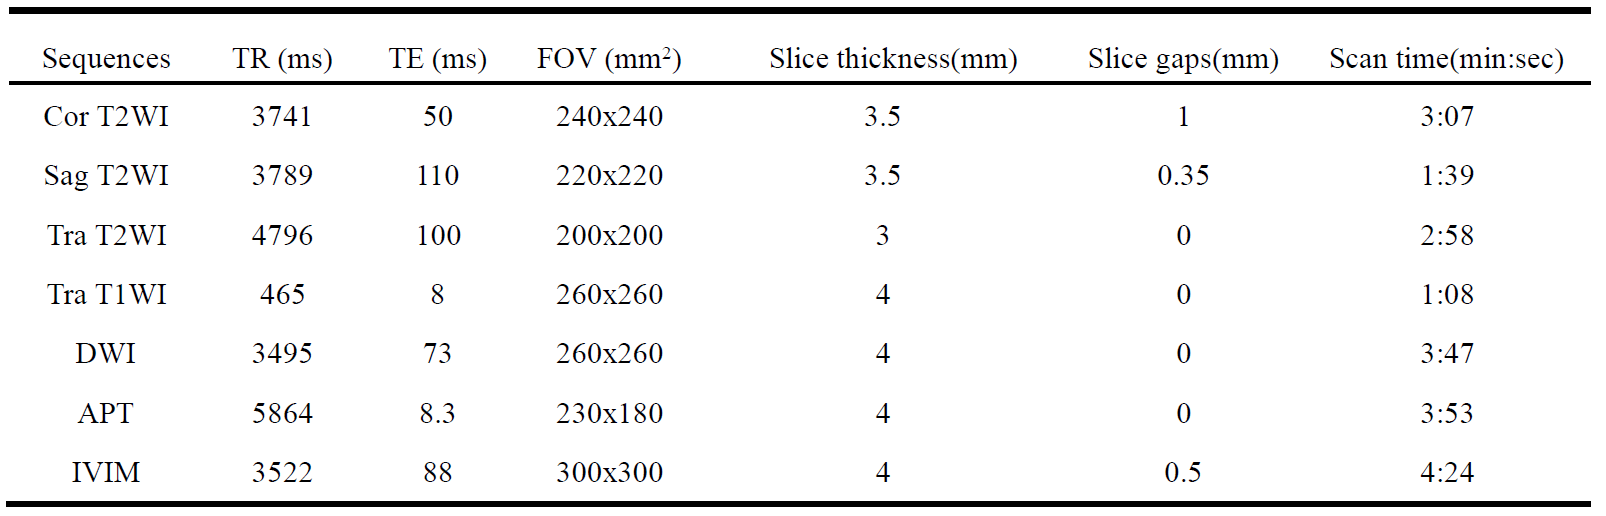
abdomen coils. The DWI, APT, and IVIM sequences were acquired in addition to
conventional scan sequences which included oblique, sagittal and coronal T2WI,
transverse T1WI, DWI, IVIM and APT, as shown in Table 1. APT images
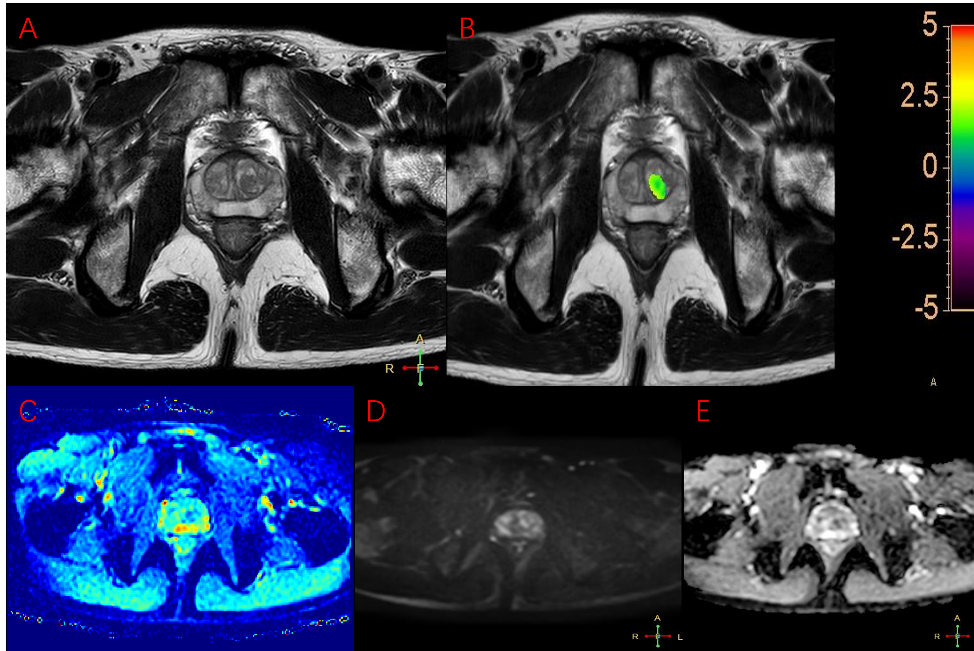
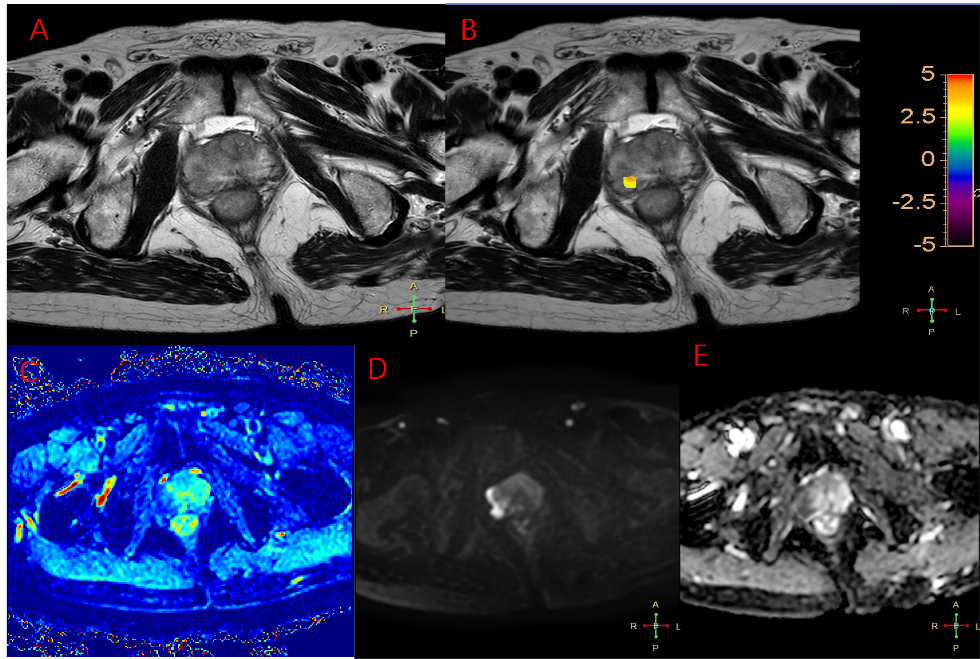
were post-processed by Philips Intellispace workstation to generate APT maps.
MITK software were used to post-process IVIM images and generate D, D*
and f maps. The ROI was delineated on the post-processing map by two high
qualified physicians experienced in prostate diagnosis (5 years and 10 years, respectively).
Then the APT value, D value, D* value and f value of lesions were
measured. The inter-class correlation coefficient (ICC) was used to evaluate
the consistency of the data. Independent sample t-test was used to compare the
differences of APT and IVIM derived parameters between the hyperplasia group and
the cancer group, and between the medium-low risk group and the high-risk
group. Spearman correlation was used to analyze the correlation between each
parameter value and GS.
The diagnostic performance of these parameters
was evaluated by receiver operating characteristic curves (ROC).Results
The
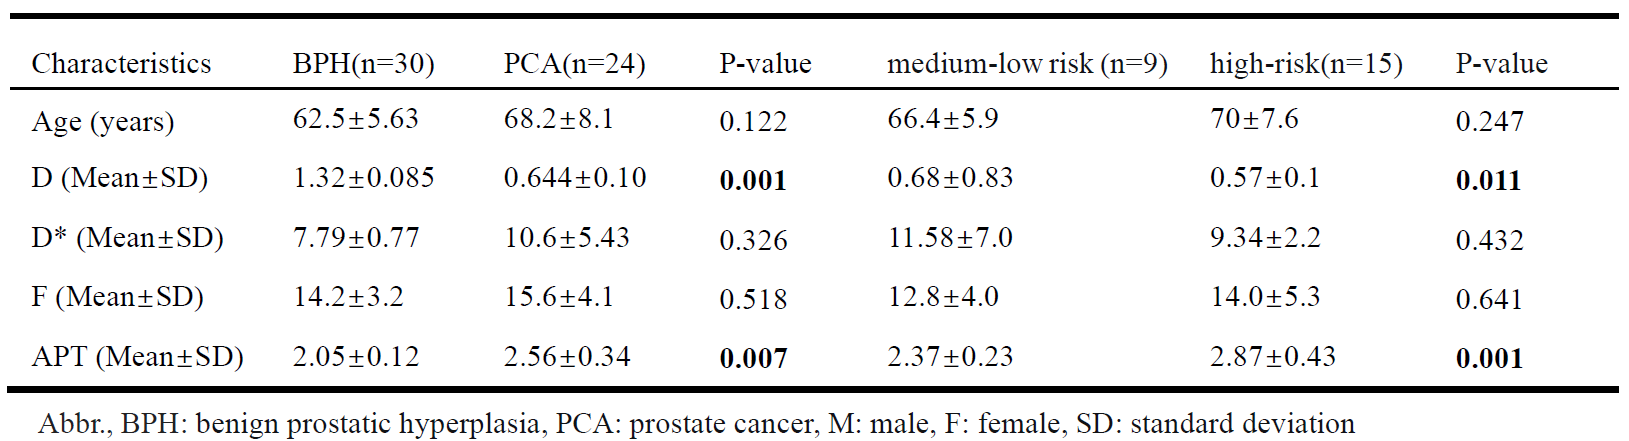
measurements were consistent between the two physicians (ICC>0.75). Table 2
showed the demographics and imaging characteristics of
patients and lesions. The D
value of BHP group was significantly higher than that of cancer
group(P<0.05), and the APT value of BHP group was significantly lower than
that of PCA group (P <0.05). There was no significant difference in D* value
and f value between BHP group
and PCA group (P>0.05). The
D value of the medium-low risk group were higher than those of the high-risk
group (P <0.05), but the APT
value was lower than that of high-risk
group (P<0.05). There was no significant difference in D*
value and f value between medium-low risk group and high-risk group
(P>0.05). D value was negatively correlated with GS score in prostate cancer
group (r=-0.475, p<0.05). APT value was
positively correlated with GS value (r=0.672,
P<0.01).
Discussion
Besides Brownian
motion, capillary blood flow incoherent motion also exists in water molecules
in living tissues. Blood flow perfusion can also cause phase incoherence of
intravascular proton groups and lead to signal attenuation. Compared with DWI imaging, IVIM can distinguish the
diffusion motion of pure water molecules from the horizontal perfusion effect
of microcirculation, and obtain D, D* and f values through the
double exponential fitting model to provide more information about tissues. In
this study, the D value of PCA/high-risk group was lower than that of BPH/medium-low risk group, because PCA/high-risk group had more complex
tissue structure, smaller tissue space and limited diffusion of water molecules
than BPH/ medium-low group. APT can detect changes in active proteins and peptides in vivo
without the use of contrast media. In this study, the APT value of
PCA/high-risk group was greater than that of BPH/medium-low risk group. Histologically normal prostate
tissue consists of loose glands, large extracellular spaces, and fluid-filled
lumen. Compared with prostatic hyperplasia tissue, cancer tissue has a more
robust proliferative capacity and more active mitosis, which leads to an
increased number of cells, close cell arrangement, reduced intercellular space,
reduced glandular lumen volume, and increased content of free proteins and
peptides synthesized by cancer tissue. With the increase of GS score, the
malignant degree of cancer tissue is higher, and the metabolized free proteins
and peptides are much more than usual, thus the APT value is also increased.Conclusion
In conclusion, APT
value and D value can help the clinical differentiation of BPH and PCA, as well
as the pathological grading of PCA.Acknowledgements
No acknowledgement found.References
[1] Chen W, Zheng R, Baade PD, et al. Cancer statistics in China, 2015[J]. CA Cancer J Clin. 2016 Mar-Apr;66(2):115-32.
[2] Yin H, Wang D, Yan R, et al. Comparison of Diffusion Kurtosis Imaging and Amide Proton Transfer Imaging in the Diagnosis and Risk Assessment of Prostate Cancer. Front Oncol. 2021;11:640906.
[3] Sauer M, Klene C, Kaul M, et al. Preoperative evaluation of pelvine lymph node metastasis in high risk prostate cancer with intravoxel incoherent motion (IVIM) MRI. Eur J Radiol.
[4] Shinmoto H, Tamura C, Soga S, et al. An intravoxel incoherent motion diffusion-weighted imaging study of prostate cancer. AJR Am J Roentgenol. 2012 Oct;199(4):W496-500.
[5] Takayama Y, Nishie A, Sugimoto M, et al. Amide proton transfer (APT) magnetic resonance imaging of prostate cancer: comparison with Gleason scores. MAGMA. 2016 Aug;29(4):671-9.