2067
Differentiating Chronic Prostatitis and Prostate Cancer Using a Continuous-Time Random-Walk Diffusion Model at High b-Values1Department of Radiology, The First Affiliated Hospital of Shandong First Medical University & Shandong Provincial Qianfoshan Hospital, Jinan, Jinan, China, 2MR Collaboration, Central Research Institute, United Imaging Healthcare, Shanghai, China
Synopsis
Keywords: Prostate, Diffusion/other diffusion imaging techniques
In clinical practice, distinguishing between Prostate cancer (PCa) and chronic prostatitis (CP) is difficult but necessary. PCa and CP are heterogeneous at the tissue and cell level, and the continuous time random-walk (CTRW) model can provide information on tissue heterogeneity at the microscopic level. We used the CTRW model to characterize tissue heterogeneity and complexity in CP and PCa. Significant differences were found for the CTRW parameters (α, Dm) between CP and PCa. Moreover, CTRW parameters (α, β, Dm) combined with ADC showed optimal diagnostic efficacy for diagnosis, and this combination would be benefit for the clinical diagnostic work.Introduction
Prostate cancer (PCa) is a common malignant tumour of the male urinary tract, and early diagnosis and treatment benefit the patient's prognosis1. Some studies have shown that PCa progresses from chronic prostatitis (CP), and the two intersect in time and space of occurrence2. CP and PCa are not easily distinguishable in terms of clinical presentation, biochemical parameters and magnetic resonance imaging 3. Therefore, finding an effective complementary means of differentiating CP and PCa for clinical work is essential. PCa is a more heterogeneous disease than CP from a clinical, morphological and molecular perspective4. The high b-value diffusion MRI technique based on the continuous time random-walk (CTRW) model provides several new quantitative parameters, the temporal and spatial heterogeneity parameter (α, β) and the anomalous diffusion coefficient (Dm)5, for describing complex tissue microenvironments and tissue structural heterogeneity6. CTRW model may be a new way to identify the heterogeneity of PCa from CA at the microscopic level. This study aimed to investigate the feasibility of the CTRW diffusion model in reflecting the microstructure heterogeneity of PCa and differentiating between CA and PCa, and compare its diagnostic performance with the conventional apparent diffusion coefficient (ADC).Methods
Totally 42 pathologically confirmed patients (28 prostate inflammation, 14 prostate cancer) were prospectively enrolled and underwent MRI scans on a 3.0T scanner (uMR790, United Imaging Healthcare, Shanghai, China). DWI were acquired with 12 b-values (0, 50, 100, 150, 200, 500, 800, 1000, 1200, 1500, 2000, 2500, 3000s/mm2), TR/TE = 2425/57.3 ms, slice thickness = 3.5 mm, matrix size =112$×$112 , scan time = 7min18s. Three parameters, Dm,α and β, were obtained by fitting DWI to a CTRW model based on the following Equation: S/S0=Eα*[−(bDm)β]5. The regions of interest (ROIs)were outlined on the DWI image with b-values of 1200 mm2/s and copied to other b-value DWI images, avoiding cystic and necrotic areas and covering the whole lesion area as much as possible. Mann–Whitney U-test was used for the group comparisons. Receiver operating characteristic (ROC) analysis was employed to determine the diagnostic performance of CTRW parameters, ADC and their combinations (Dm, α and β; Dm, α, β and ADC).Results
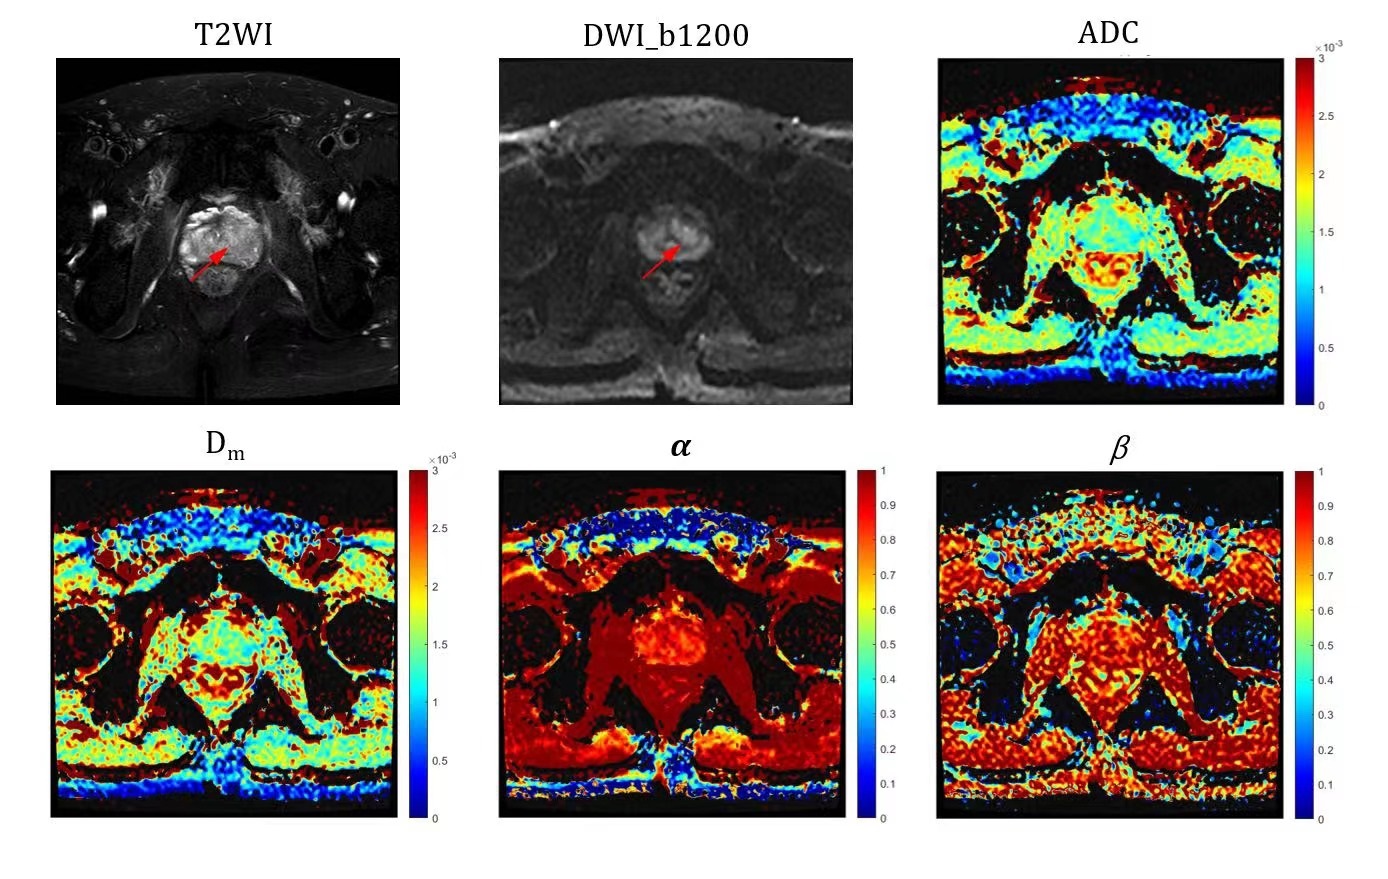
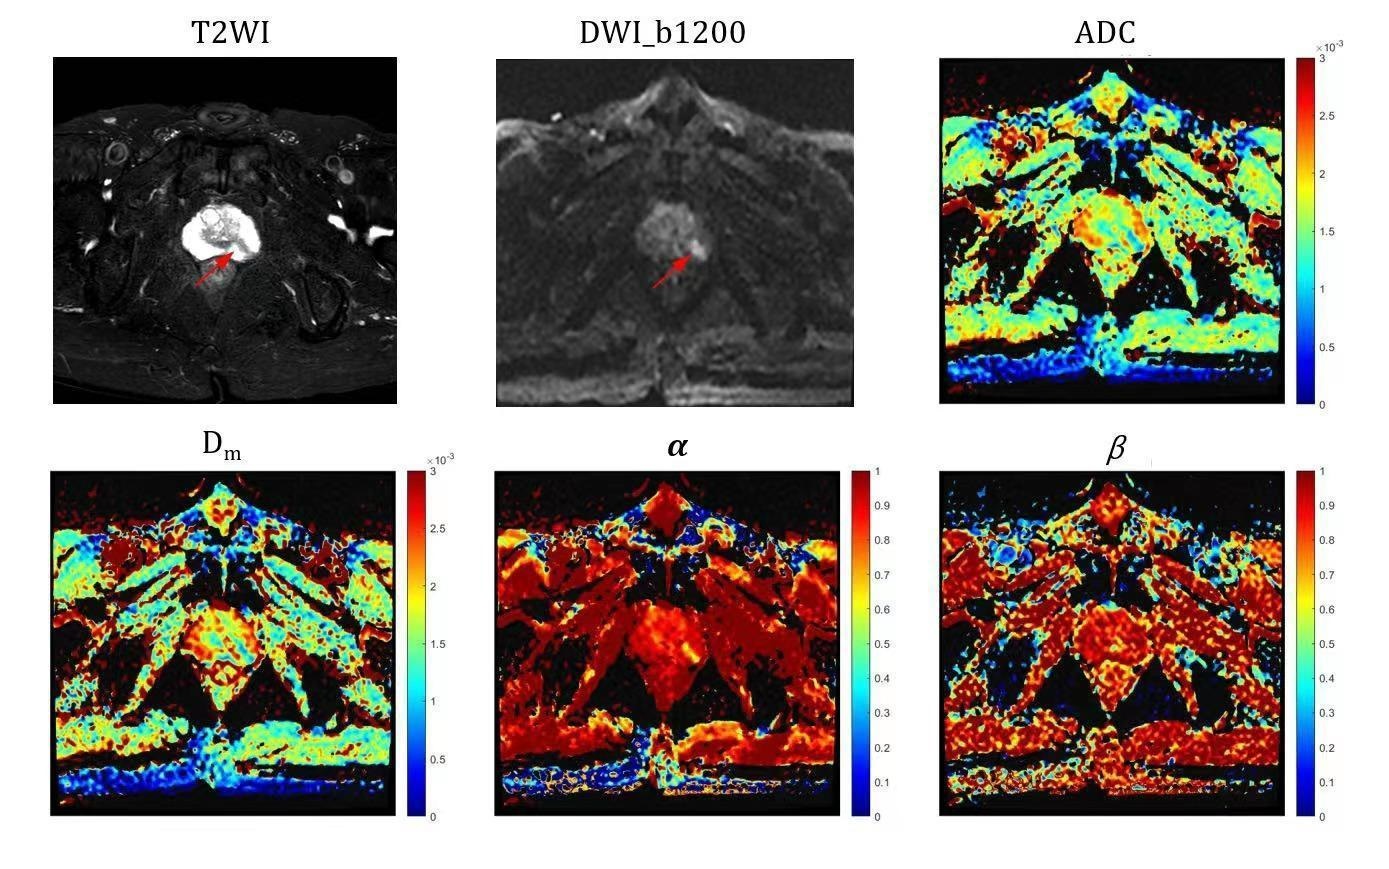
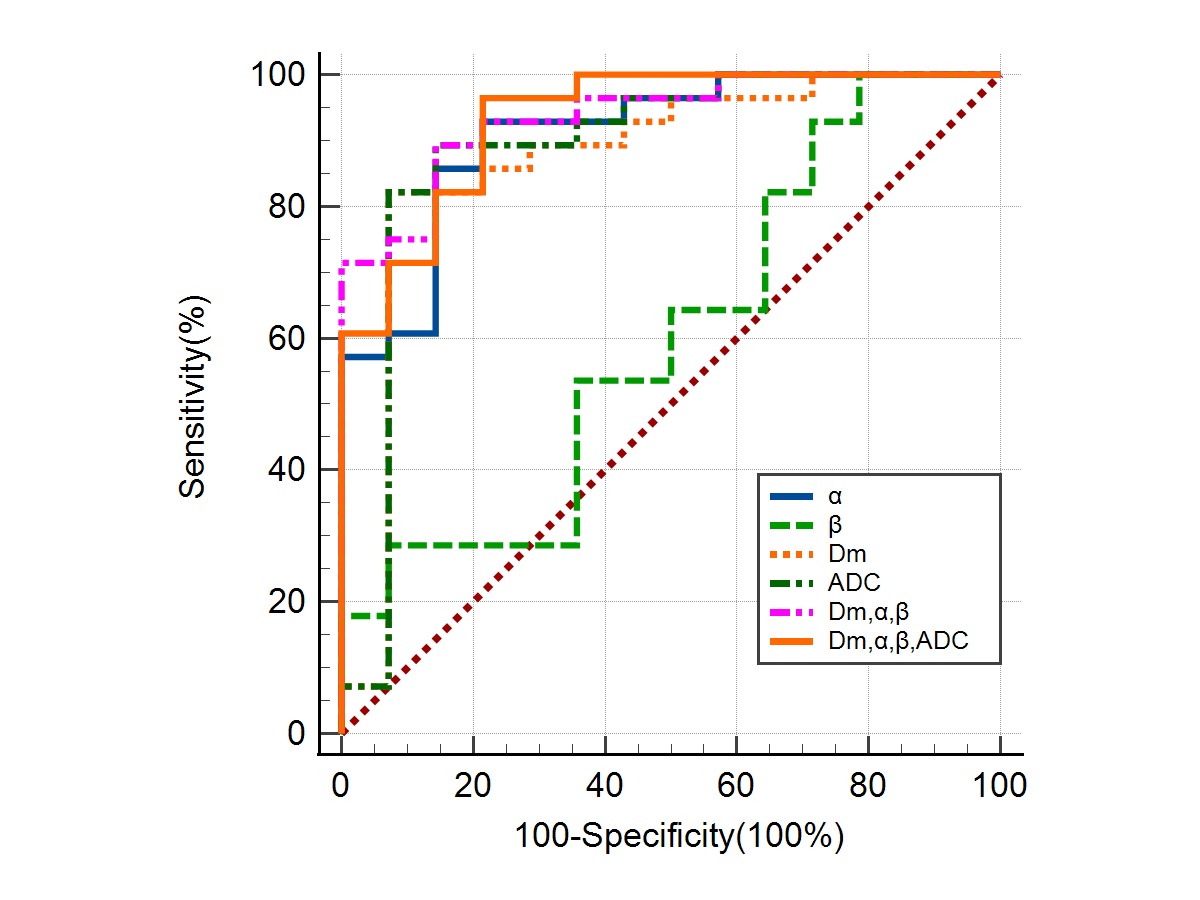
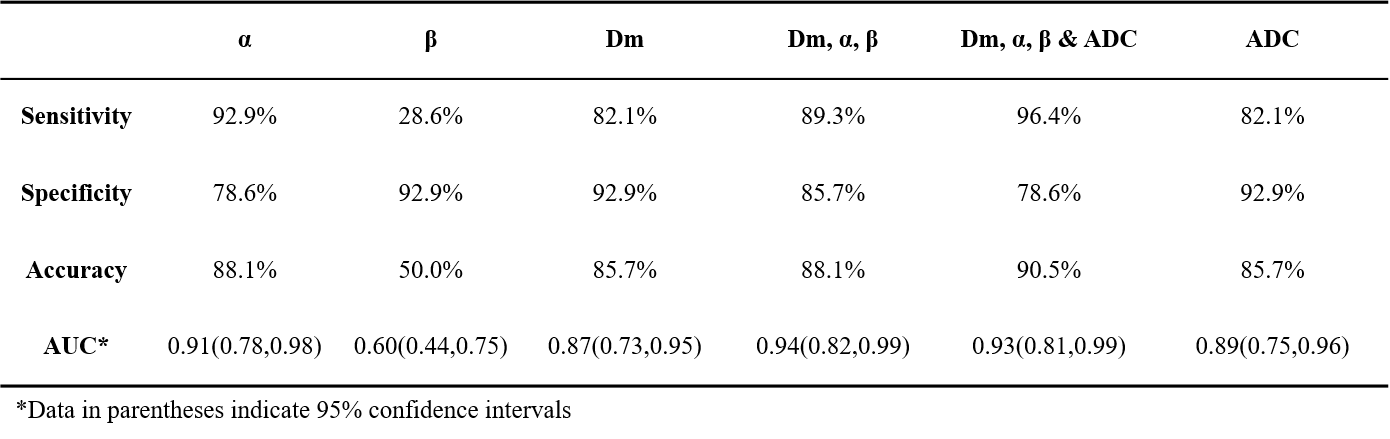
Significant differences between CP and PCa were observed in Dm and α (both p-values<0.001) (Figures 1 and 2), but not in β. The ROC analysis results are shown in Figure 3 and Table 1. For individual parameters: α produced the best diagnostic performance with highest sensitivity, accuracy and AUC (92.9%, 88.1% and 0.91), followed by ADC (82.1%, 85.7% and 0.89), Dm (82.1%, 85.7% and 0.87) and β (28.6%, 50.0% and 0.60); while Dm, β and ADC generated the same high specificity (92.9%) than α (78.6%). For the combination of parameters, the AUC values were improved by 0.94 (Dm, α, β) and 0.93 (Dm, α, β and ADC). Combination of Dm, α, β and ADC) yielded the best sensitivity (96.4%), accuracy (90.5%).Discussion
In this study, we have demonstrated the feasibility of using CTRW parameters to distinguish between PCa and CP. The histomorphological and molecular tumour characteristics of PCa are diverse and variable, which leads to the increased structural complexity of the tissue microenvironment4. Therefore water molecules can take drastically various periods of time to make a move and can diffuse with drastically different step lengths in cancer tissue 4. In contrast, CA is mainly proliferating inflammatory tissue, and has low microenvironmental tissue complexity. In this study, it was observed that α of PCa were significantly lower than CP, which is consistent with the more complex microstructure in PCa. Besides, CTRW parameter α had higher sensitivity, accuracy and AUC than ADC, it indicates that the parameter α of CTRW model can provide information on tissue heterogeneity to help in the differential diagnosis of PCa and CP. Dm accounts for non-Gaussian diffusion behaviour in biological tissues7. The lower the Dm value, the higher the degree of diffusion limitation. PCa tissue has a high cell density and small intercellular spaces, which restrict the diffusion of water molecules. Our results showed that the Dm values for PCa were significantly lower than those for CA, indicating that the diffusion of water molecules was more restricted in PCa tissue than in CA tissue. The lack of significant difference in β may be related to the small sample size.Combining CTRW parameters (Dm, α, β) with ADC produced the highest sensitivity and diagnostic accuracy in this study. The combining model includes both tissue cellularity and heterogeneity in its parameters, suggesting that incorporating the CTRW diffusion model into the conventional ADC could provide more comprehensive and multi-faceted information and facilitate more accurate identification of PCa from CP.
Conclusion
With its sensitivity to tissue heterogeneity and microstructure complexity, the CTRW model could provide additional biological information and added value for non-invasive prostate cancer diagnosis than ADC.Acknowledgements
No acknowledgementsReferences
1. Pernar CH, Ebot EM, Wilson KM, Mucci LA. The epidemiology of prostate cancer. Cold Spring Harbor perspectives in medicine. 2018;8(12):a030361.
2. Cai T, Santi R, Tamanini I, Galli I, Perletti G, Bjerklund Johansen T, Nesi G. Current Knowledge of the Potential Links between Inflammation and Prostate Cancer. International journal of molecular sciences. 2019;20(15).
3. Maclean, Fiona, Karczmar, Gregory, S., Varol, Celi, Prando, Adilson, Oto. Benign Conditions That Mimic Prostate Carcinoma: MR Imaging Features with Histopathologic Correlation. Radiographics. 2016;36(1):162-175.
4. Haffner M, Zwart W, Roudier M, True L, Nelson W, Epstein J, De Marzo A, Nelson P, Yegnasubramanian S. Genomic and phenotypic heterogeneity in prostate cancer. Nature reviews. Urology. 2021;18(2):79-92.
5. Ingo C, Sui Y, Chen Y, Parrish T, Webb A, Ronen I. Parsimonious continuous time random walk models and kurtosis for diffusion in magnetic resonance of biological tissue. Frontiers in physics. 2015;3.
6. Herminghaus S, Pilatus U, Setzer M, Marquardt G, Lanfermann H, Seiffert V, Zanella FE. Differentiating High-Grade and Low-Grade Neuroepithelial Brain Tumors: Stereotactic Biopsy versus Proton MR Spectroscopy.
7. Tang L, Zhou XJ. Diffusion MRI of cancer: From low to high b‐values. Journal of Magnetic Resonance Imaging. 2019;49(1):23-40.
Figures