2066
PCa Risk Prediction Model:Combined Clinical Characteristics AND mpMRI Parameters for Prediction of Risk of PCa1The First Affiliated Hospital of Bengbu Medical College, Bengbu, China, 2Beijing Deepwise & League, Beijing, China, 3Philips Healthcare, Beijing, China
Synopsis
Keywords: Prostate, Prostate
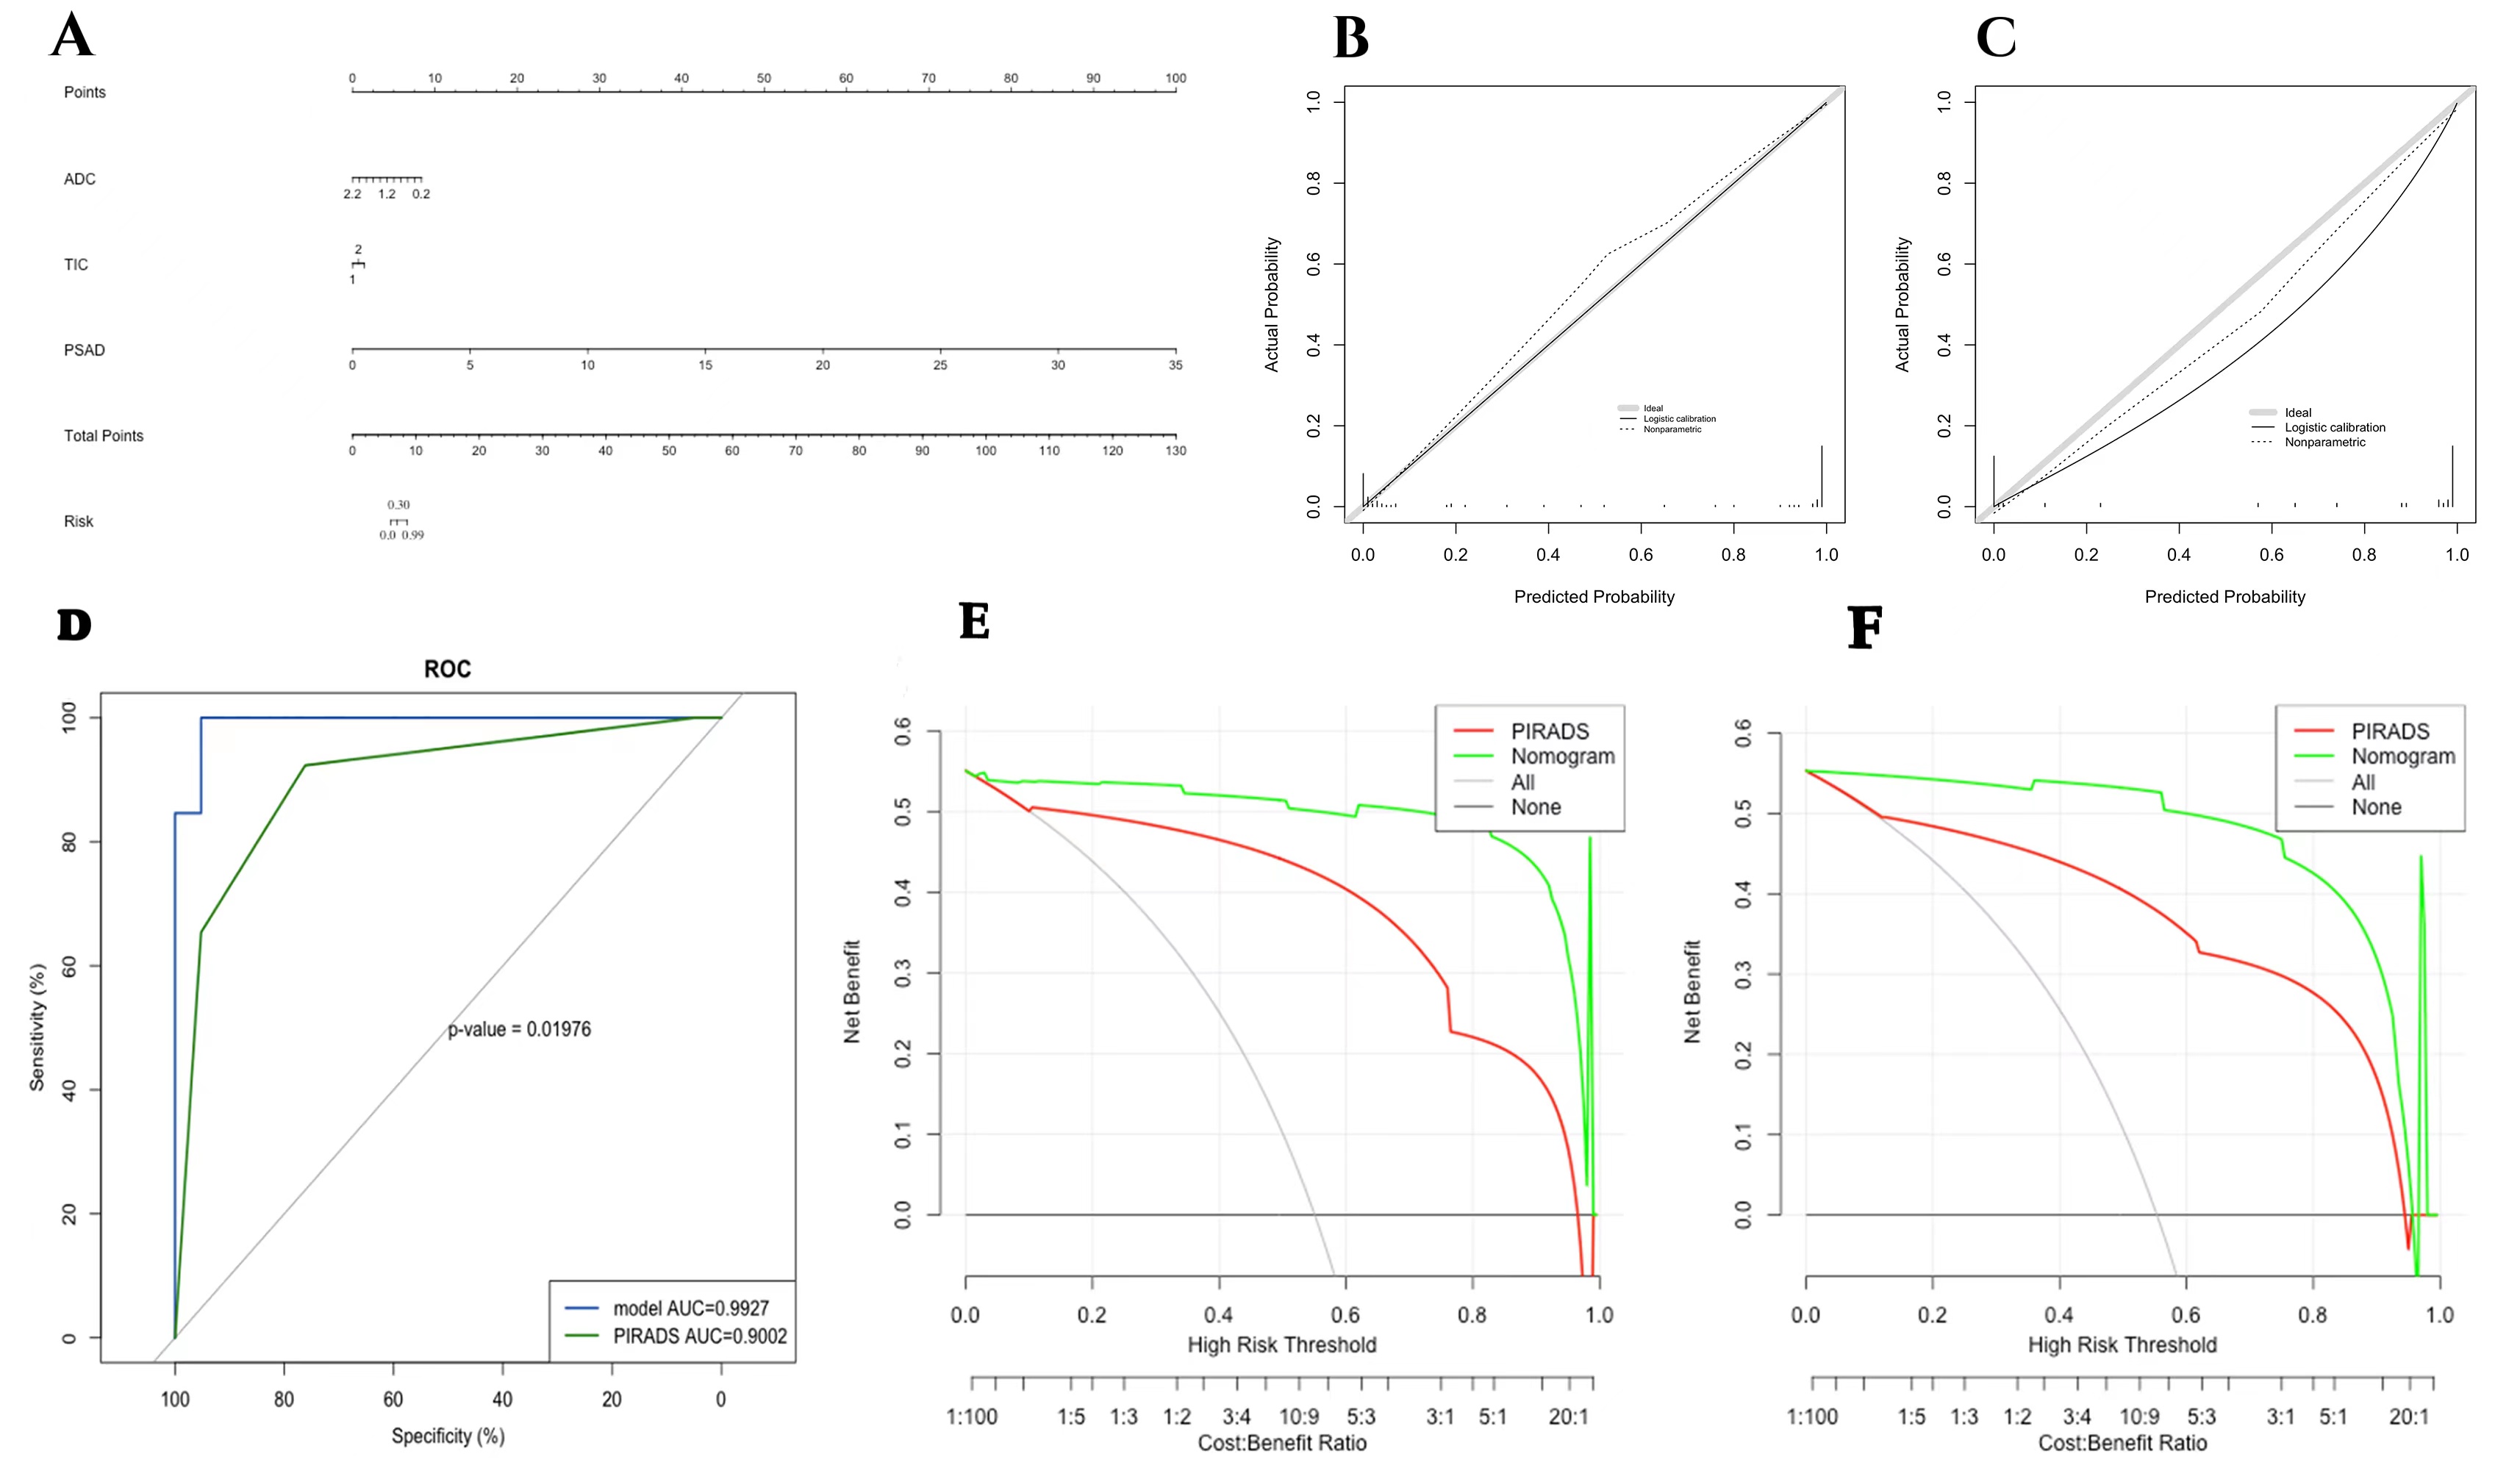
It’s still a challenge to accurately diagnose prostate cancer through MRI before operation. PI-RADS was capable of assessing the value of risk, but it did not combine clinical characteristics. we combined clinical characteristics and mpMRI parameters for the prediction of the risk of prostate cancer and compared them with PI-RADS. We found that the model was significantly better than PI-RADS (P=0.01976). The AUC of the model is higher than that of PI-RADS (0.99>0.90, p=0.019). This study demonstrated the feasibility of the model to predict the risk of prostate cancers early so that low-risk patients can avoid unnecessary needle biopsies.Introduction
Prostate cancer (PCa) is a progressive cancer disease that affects the quality of life of men, and it ranks 7th in the cancer incidence spectrum1,2,3. Studies have shown that the sensitivity of multiparametric MRI (mpMRI) in the diagnosis of prostate cancer is 93.3%4 . Although the prostate imaging reporting and data system version 2 (PI-RADS V2) scoring system based on mpMRI has certain reference values, the indexes involved are limited, and there is no analysis of clinical indicators. Therefore, the differences between the score and pathological results often occur in clinical practices5. The purpose of this study is to calculate parameters based on mpMRI data and to establish a PCa risk prediction model comparing the quantified risk value with the traditional PI-RADS v2 standard.Methods
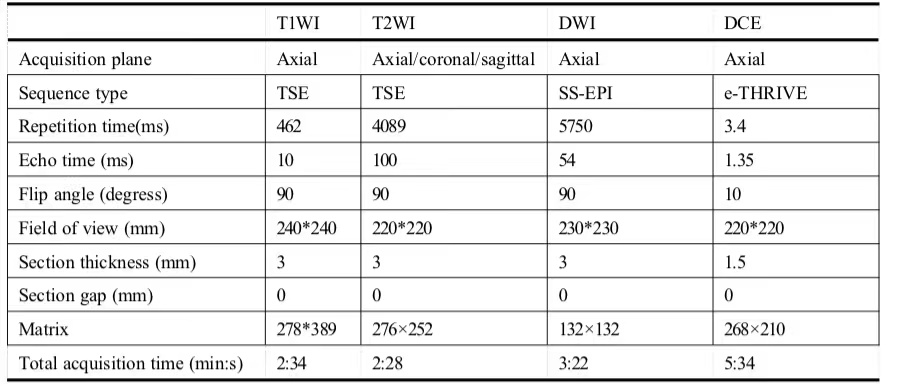
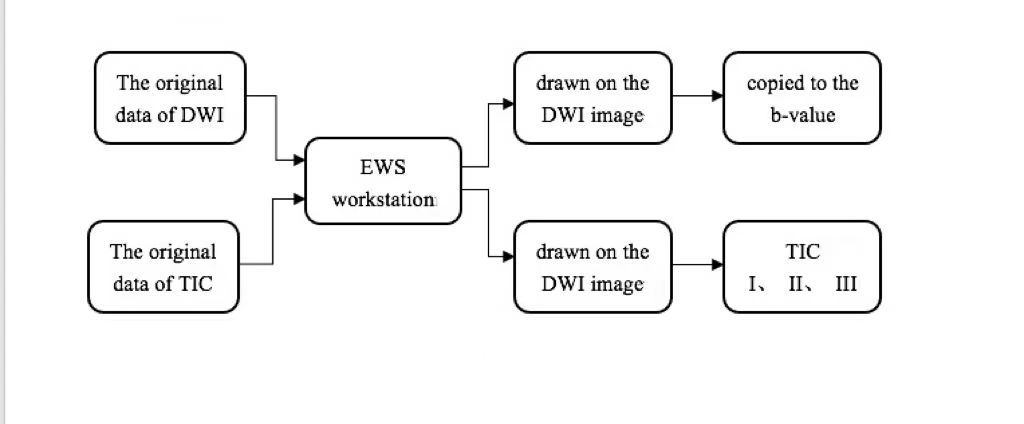
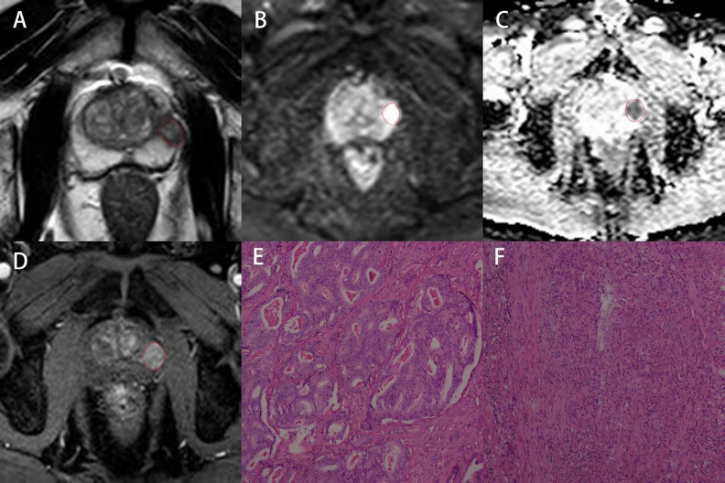
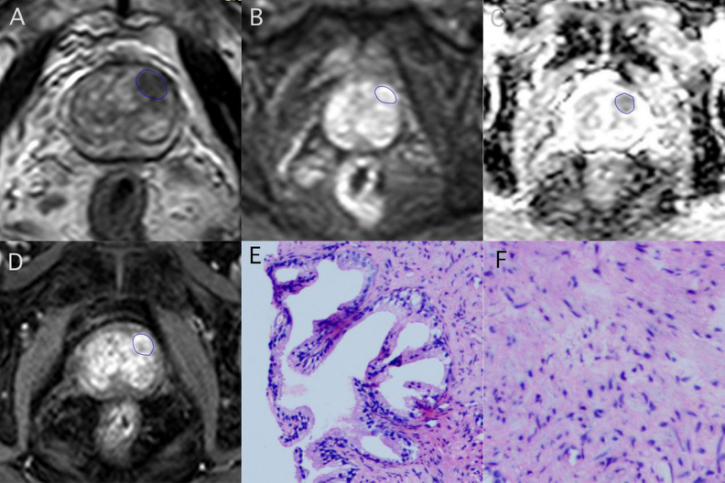
156 patients with suspected PCa (70 subjects with benign lesions, 86 subjects with malignant lesions) were included. All participants completed PI-RADS v2 assessment and serological tests, including prostate-specific antigen (TPSA), free prostate-specific antigen (FPSA), alkaline phosphatase (ALP), serum calcium, phosphorus, prostate volume (PV), and prostate-specific antigen density (PSAD). Prostate volume(PV)was calculated by the formula (PV= length x width x height x 0.52) 6. Prostate-specific antigen density(PSAD)was calculated by the formula (PSAD = TPSA / PV), and PV was the volume of the prostate. All patients were scanned using a 3.0T MR scanner (Achieva, Philips Healthcare, the Netherlands) with 16 channel abdominal phased array coil. The imaging protocol included a small field of view axial T1-weighted imaging, T2-weighted imaging (axial, coronal, sagittal), axial diffusion-weighted imaging(DWI), and dynamic contrast-enhanced(DCE)imaging. The detailed scan parameters have shown in Table 1. The maximum area of the lesion was selected to draw the region of interest(ROI), and the size of the ROI was 20~30 cm2. The parameters we collected include apparent diffusion coefficient(ADC)and time-intensity curve(TIC), and the measurement method is shown in Figures 1, 2, and 3. 70% of the data were randomly set as a training group, and the remaining 30% of data were considered as a testing group. Logistic regression was used to analyze the variables of the training group by single-factor analysis. The collinearity was diagnosed by calculating the coefficient of variance expansion. Low collinearity variables were screened out, and multivariate analysis was used. Using the selected variables, the nomogram model for predicting PCa was established. ROC curve was generated to analyze the PI-RADS v2 score and predict the diagnostic efficacy of the nomograph model. Finally, the clinical net benefits of this model and PI-RADS were compared according to the clinical decision curve.Result
According to the results of multivariate analysis, ADC, TIC, and PSAD were included in the nomogram model for predicting PCa. The goodness of fit of the training set H-L is p = 0.994, and that of the test set H-L is p = 0.845, both P > 0.05, indicating that the model calibration is good. The nomogram model is significantly better than PI-RADS in predicting PCa and the AUC of the model is higher than that of the PI-RADS standard (0.99>0.90, p=0.019). The sensitivity and specificity of the training group are 95.92% and 98.33%, respectively. The clinical decision curves of the training group and the testing group showed that the clinical net profit of the nomogram model was higher than that of the PI-RADS v2 standard, and it had higher clinical value, as shown in Figure 4.Discussion
The prostate cancer risk prediction model combined clinical characteristics and mpMRI parameters, including ADC, TIC, and PSAD. PI-RADS v2 scoring system was only based on the imaging of mpMRI. The score was not perfect because the AUC for clinically significant cancer was 0.797. In this study, PSAD was included in the prostate cancer risk prediction model innovatively. This model was made up for the limitation of PI-RADS, which was evaluated only from the perspective of MRI. Benson confirmed that PSAD could accurately reduce the misdiagnosis of hyperplasia of the prostate and improve the diagnostic accuracy of PCa because it considered PSA and prostate volume comprehensively8. In patients with PSA>10ng/mL, the AUC value of PSAD was 0.84, and the AUC value of PSA was 0.65. The effect of PSAD was significantly better than that of PSA alone9. Our results also demonstrated that PSA and PSAD were statistically significant differences in univariate analysis. After multivariate analysis, PSAD was an independent risk factor for prostate cancer (P<0.05). Further larger prospective studies are needed to implement in the future. To sum up, the clinical net profit of the model was higher than that of the PI-RADS v2 standard, and it had higher clinical value.Conclusion
The risk prediction model is a potential diagnostic tool for improving the diagnostic accuracy of PCa. It could provide complementary information regarding clinical characteristics and mpMRI parameters for the clinical diagnosis of PCa. It also could help clinicians to improve the diagnosis efficiency of PCa and select the best clinical treatment method for patients.Acknowledgements
Support for this work was provided by The First Affiliated Hospital of Bengbu Medical College. We would like to thank dr. Ma for his encouragementand guidance throughout this study.References
1. Siegel RL, Miller KD, Jemal A. Cancer statistics. CA Cancer Journal for Clinicians. 2015; 65(1):5-29.
2. Jagai JS, Messer LC, Rappazzo KM, et al. County-level cumulative environmental quality associated with cancer incidence. Cancer. 2017; 123(15):2901-2908.
3. Chen W, Zheng R, Baade PD, et al. Cancer statistics in China, 2015. CA: A Cancer Journal for Clinicians. 2016; 66(2):115-132.
4. Russo F, Regge D, Armando E, et al. Detection of prostate cancer index lesions with multiparametric magnetic resonance imaging (mp‐MRI) using whole‐mount histological sections as the reference standard. BJU International. 2016;118(1):84-94.
5. Ahmed F, Shelley S, Trafford C, et al. The role of mpMRI and PSA density in patients with an initial negative prostatic biopsy. World journal of urology. 2018;36(12):2021-2025.
6. Huang C, Song G, Wang H, et al. MultiParametric Magnetic Resonance Imaging-Based Nomogram for Predicting Prostate Cancer and Clinically Significant Prostate Cancer in Men Undergoing Repeat Prostate Biopsy. BioMed Research International.2018;2018:1-10.
7. Park SY, Jung DC, Oh YT, et al. Prostate Cancer: PI-RADS Version 2 Helps Preoperatively Predict Clinically Significant Cancers. Radiol. 2016; 280:108-116.
8. Benson M C, Mcmahon D J, Cooner W H, et al. An algorithm for prostate cancer detection in a patient population using prostate-Specific antigen and prostate-Specific antigen density[J]. World Journal of Urology, 1993, 11(4):206-213.
9. Jue J S, Barboza M P, Prakash N S, et al. Re-Examining PSA Density: Defining the Optimal PSA Range and Patients for Using PSA Density to Predict Prostate Cancer Using Extended Template Biopsy[J]. Urology, 2017, 105:123-128.
Figures