2063
The application of Amide proton transfer MR imaging in prostate cancer with different risk1Liaoning Cancer Hospital&Institute, Shenyang, China, 2Philips Healthcare, Beijing, China
Synopsis
Keywords: Prostate, Cancer, APT, Gleason score
Amide proton transfer (APT) imaging is a novel nonintrusive technique for the diagnosis of PCa. In this study, we evaluate the distinction between APT value for prostate cancer and benign region in different Gleason scores. The result shows that APT is a potential tool for evaluating the risk of prostate cancer.Introduction
Prostate cancer(PCa) has become a growing public health problem.[1] The Gleason scoring (GS) system is the golden standard for the diagnosis of PCa, which is commonly obtained through transrectal ultrasound (TRUS)-guided biopsy. The higher the GS, the more risk that cancer will grow and spread quickly. Moreover, the treatment strategies and prognosis of PCa are different for different GS.[2] But the biopsy is invasive. Magnetic resonance imaging (MRI) is considered the best nonintrusive technique for the diagnosis of PCa. Amide proton transfer (APT) imaging is a novel MRI technique that detects endogenous mobile proteins and peptides in tissue via off-resonance saturation pulses. It can be used as a promising method in diagnosing cancer because tumors present more cellular proteins and peptides than benign tissue.[3] Previous studies have investigated the application of APT in the evaluation of tumors such as Glioma[4] and PCa[3]. However, few studies discussed the relationship between APT SI and PCa risk. In this study, we evaluate the distinguish between APT value for prostate cancer and normal region in different risks according to Gleason scores.Method
This prospective study was approved by the local Institutional Ethics Committee, and all subjects signed the informed consent. From May 2022 to Sep 2022, 39 patients suspected of PCa were enrolled. The TRUS was performed for each patient and according to GS, the patient was categorized into three groups as fellow: low-risk group (GS <7), intermediate-risk group (GS = 7), and high-risk group (GS >7). 3 patients with diffuse prostate cancer (unable to measure the SI of benign tissues) and 2 patients with pathologically confirmed benign lesions were excluded. All patients underwent on a 3.0T MR scanner (Ingenia CX, Philips Healthcare) including routine T2WI, DWI(b0 and b1000) and 3D APT (TR, 13085 ms; TE, 7.8ms; FOV, 169x134x72 mm2; matrix, 84x67x12; layer thickness, 6 mm; slice, 12). After the acquisition was completed, the APT images were fused with the ADC images. According to the tumor boundary displayed, the ROI was manually placed by a radiologist with more than 8 years of clinical experience on the same location of the lesion in the fused image, and the APT value and ADC value were measured, respectively. The same areas of ROI were also placed on the noncancerous region and measured the APT value and ADC value, respectively. All statistical analyses were analyzed with GraphPad 9.0. Paired t-tests were used to compare the difference of the mean APT SIs and ADC values between the Pca region and noncancerous region in each GS group. The P value of 0.05 or less was considered to indicate a statistically significant difference.Result
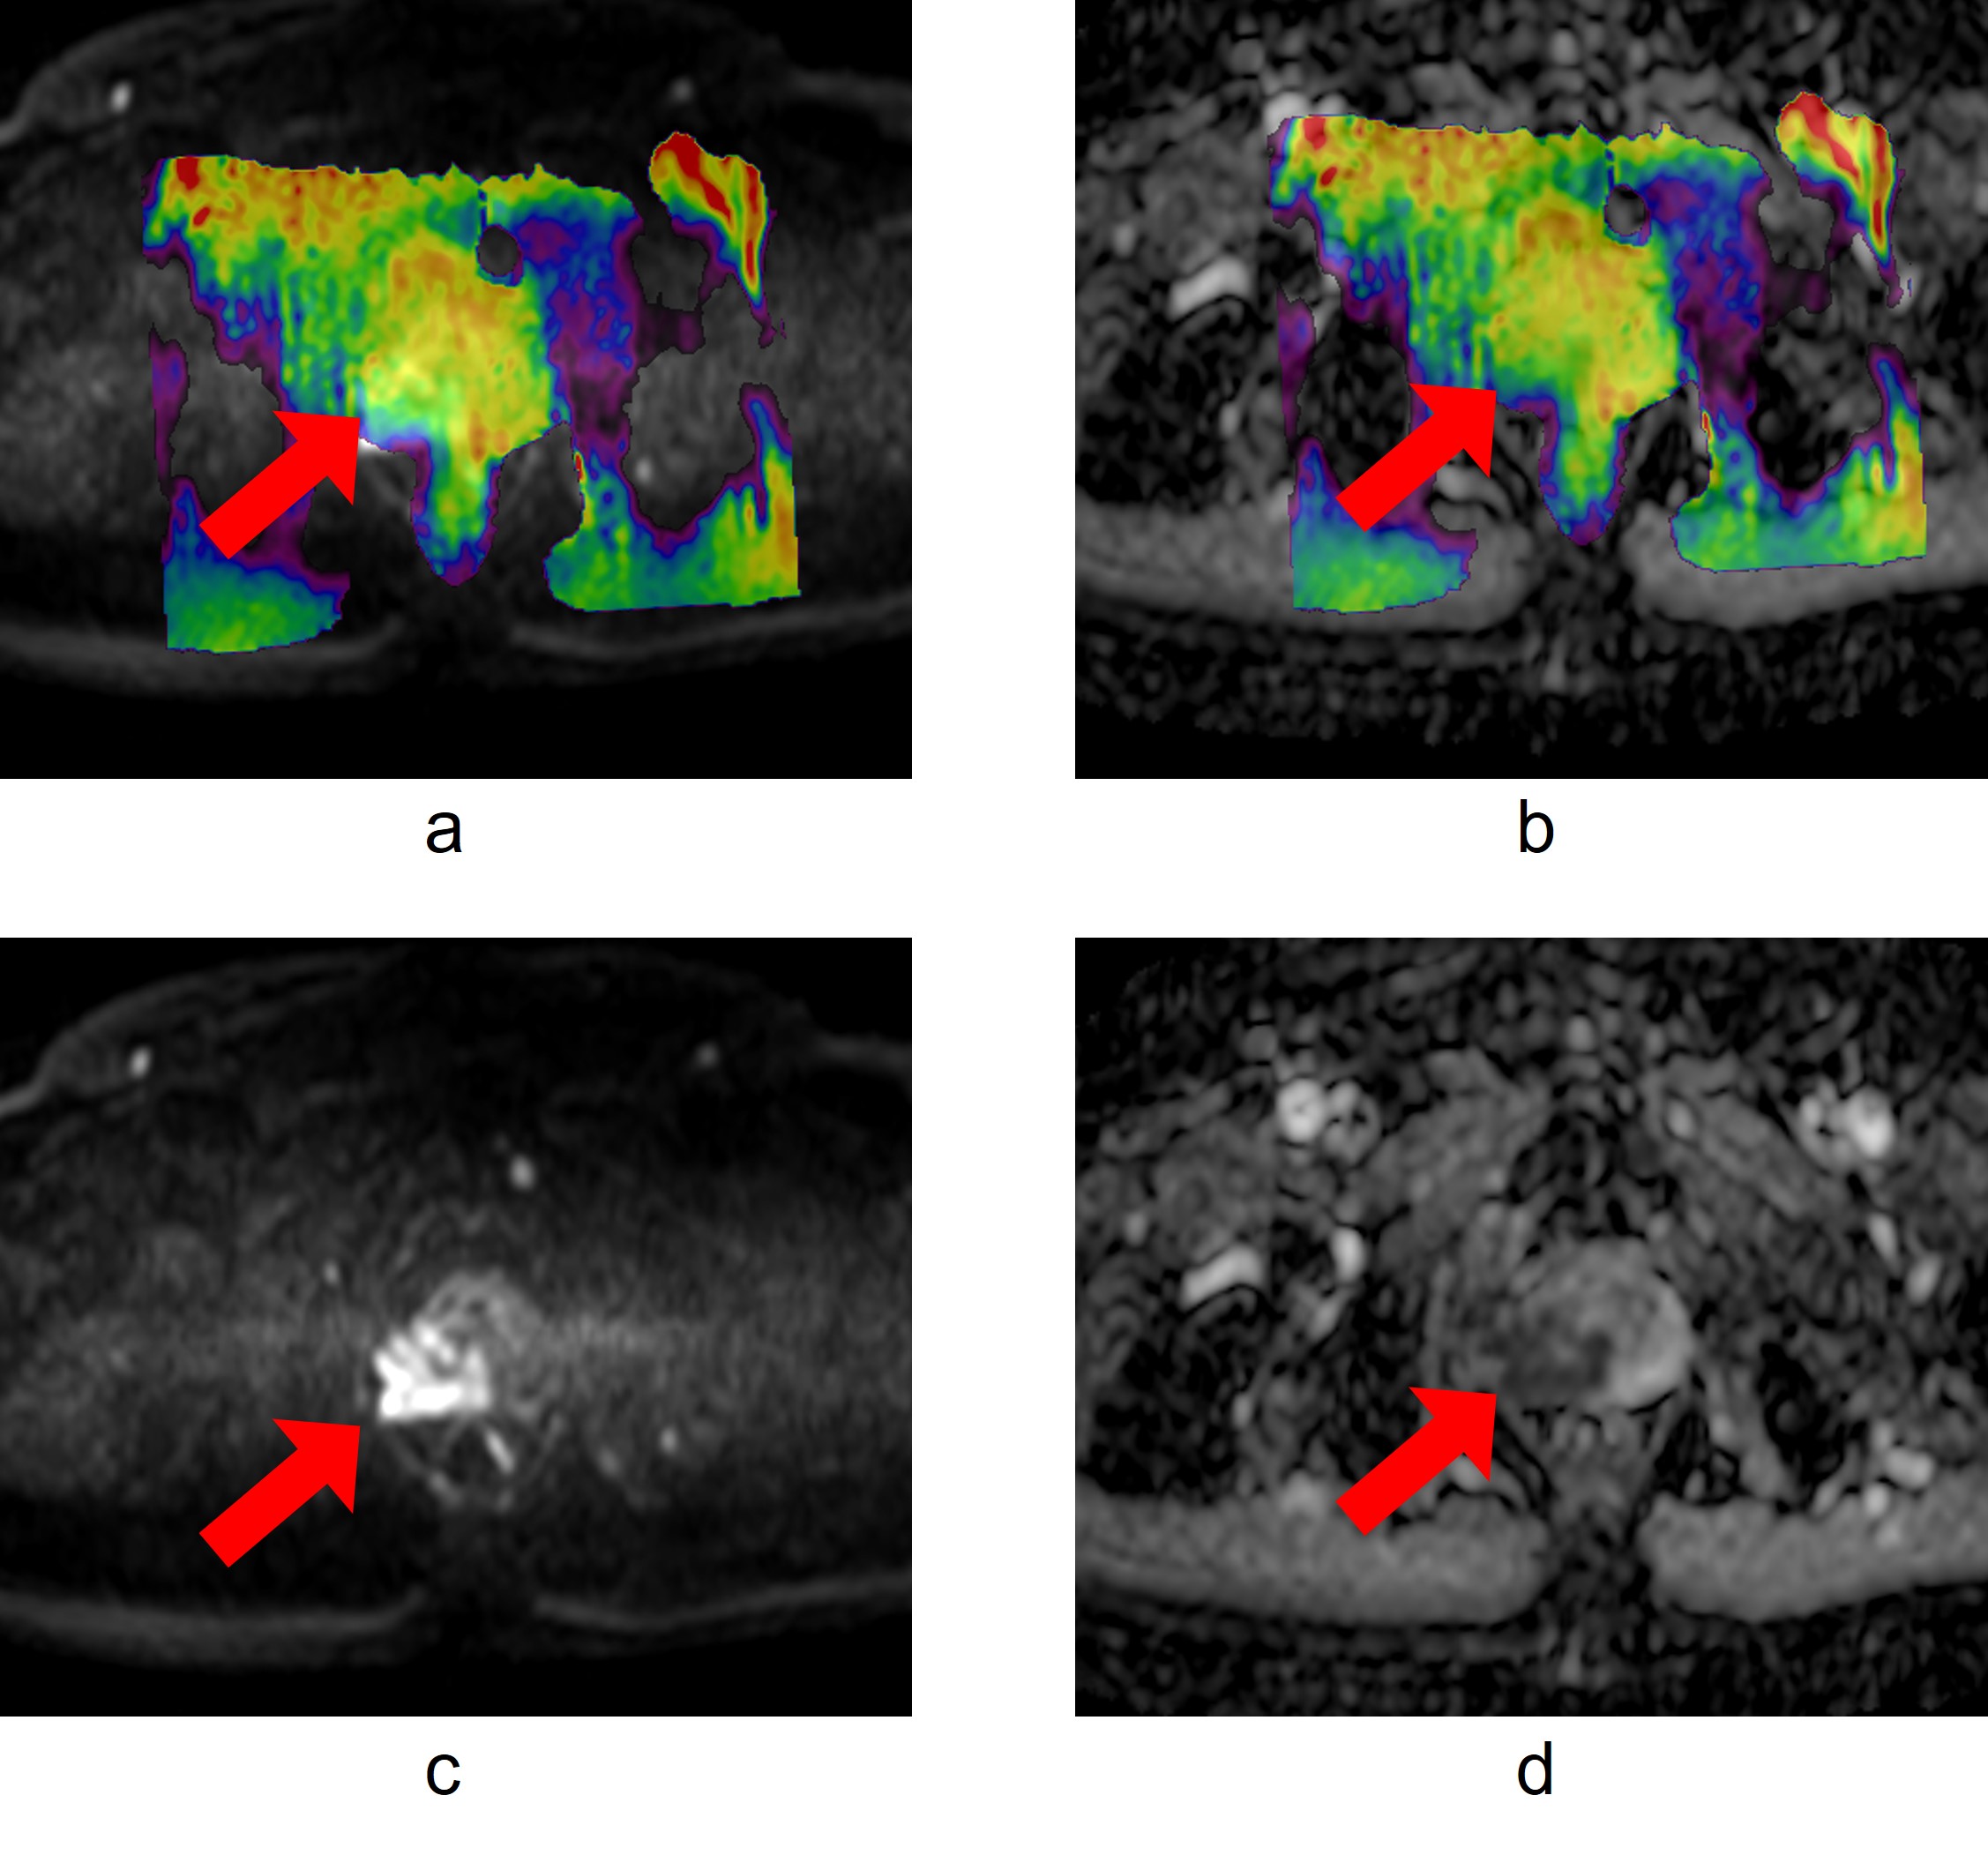
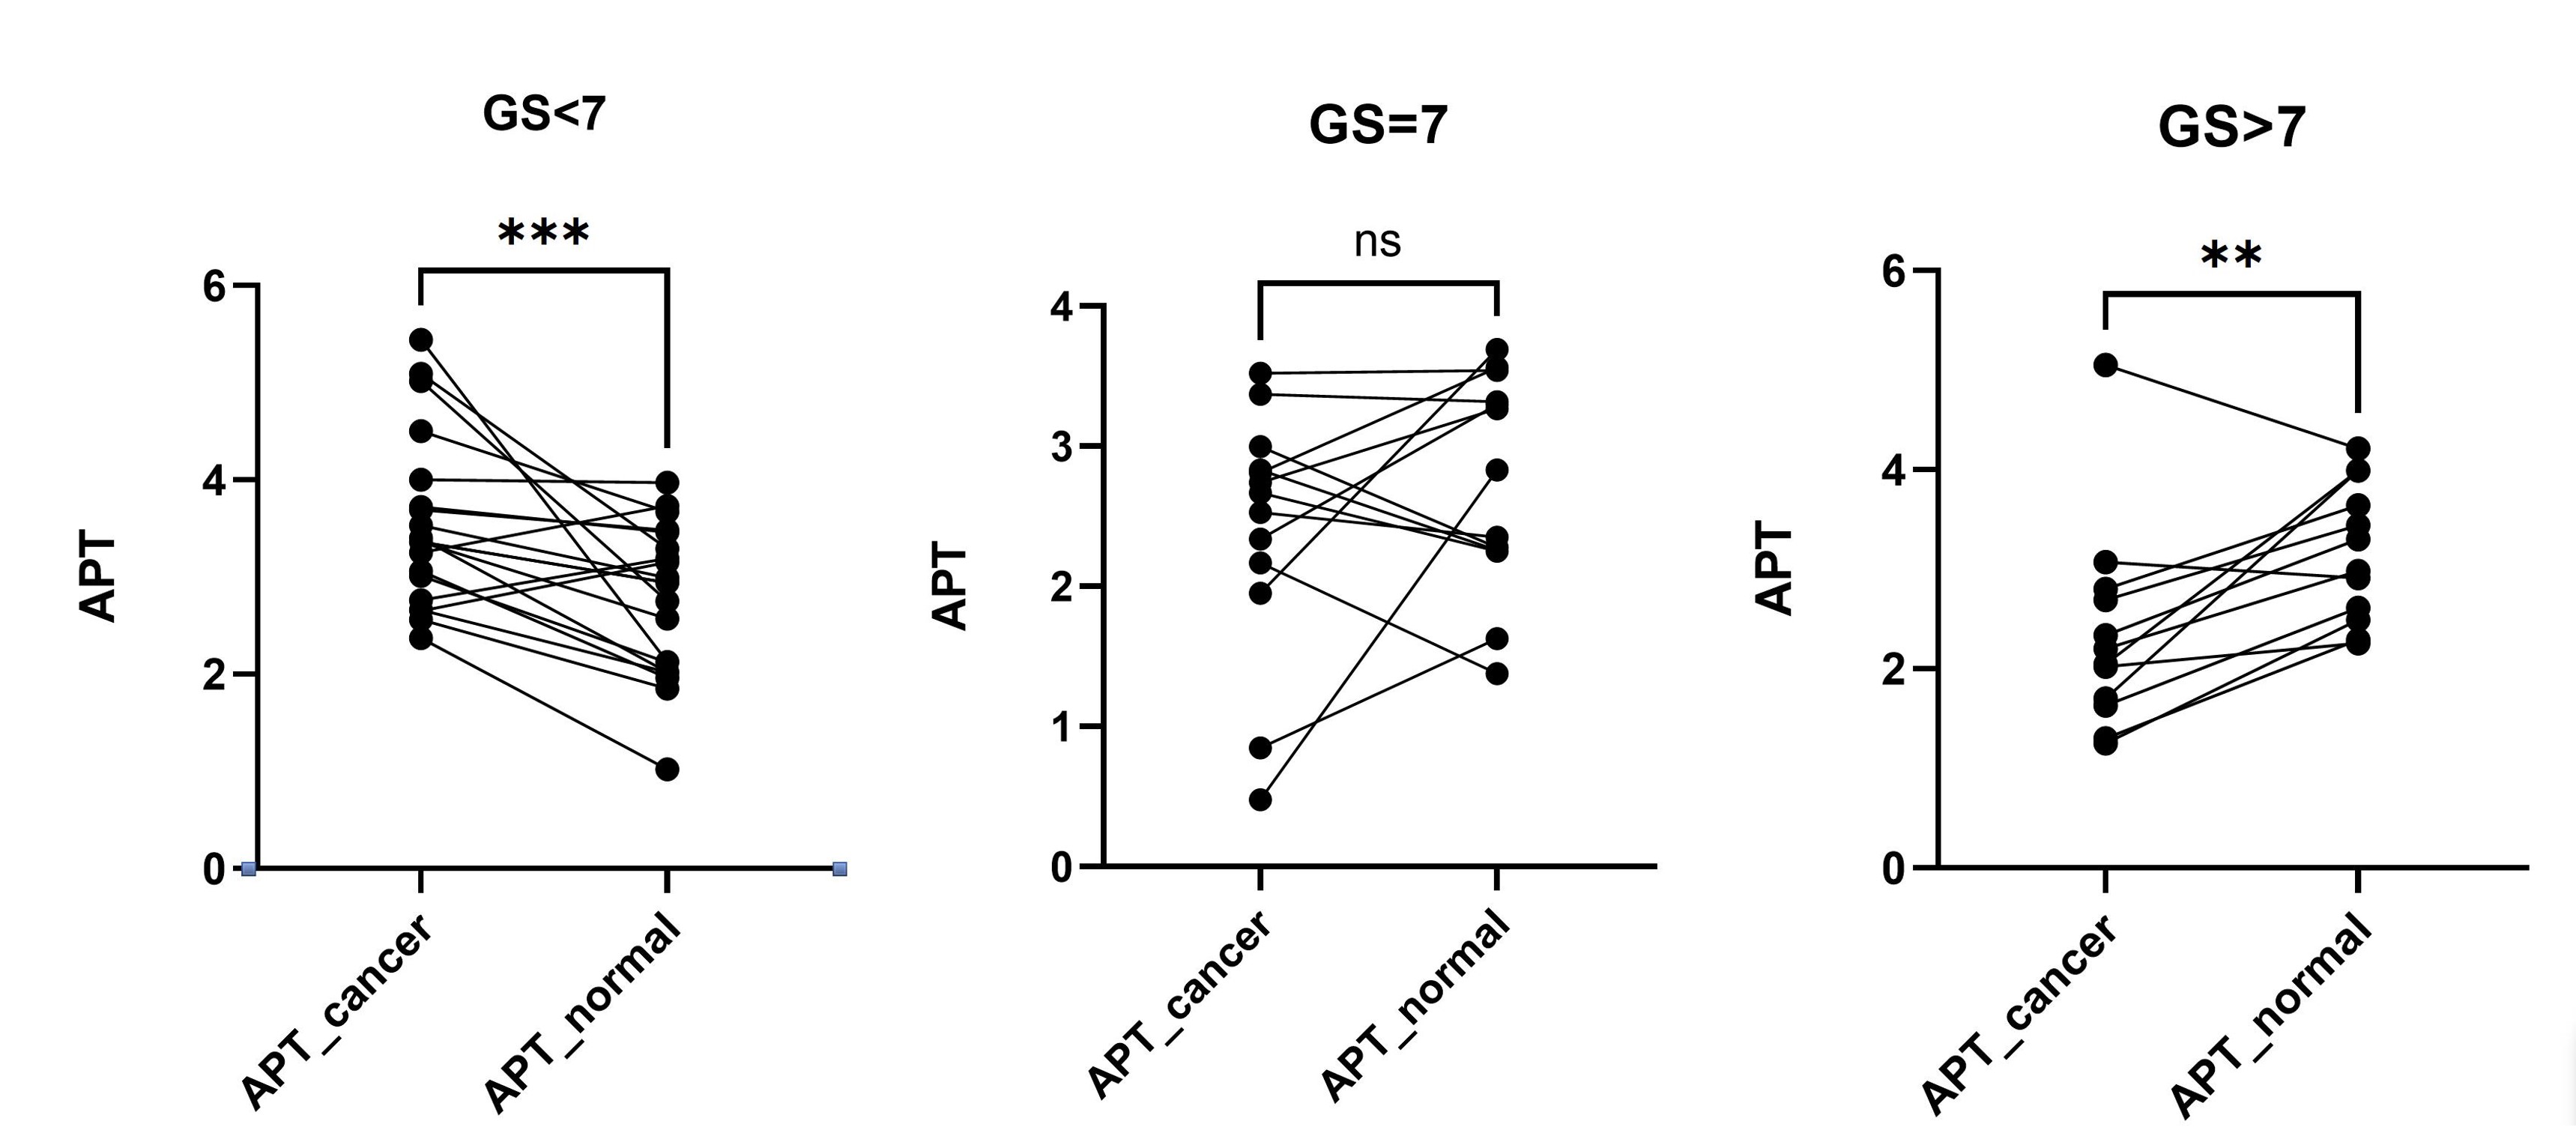
Figure 1 shows the representative images of a high-risk patient. The average APT signal intensity (SI) ± standard deviation (%) were 3.54±0.87 and 2.76±0.77 on the PCa region and benign region in the low-risk group(P<0.001), 2.45±0.88 and 2.73±0.76 in the intermediate-risk group(P>0.05), as well as 2.31±1.03 and 3.17±0.69 in the high-risk group(P<0.01), as shown in Figure 2.Discussion and Conclusion
In our study, we analyzed the APT value between malignant lesions (PCa) and benign regions in different GS risk groups. The result indicated that the APT values of Pca with low risk (GS<7) were significantly higher than those of the benign region, while the APT values of Pca with high risk(GS>7) were significantly lower than those of the benign region. These results differ from those of the previous study which simply believes that APT in prostate cancer ROIs was significantly higher than that in the benign regions[3]. One hypothesis is that microcystic tumor necrosis increased in GS >7 patients which may reduce the mobile protein and polypeptide in the tumor. Although further study is required, the APT is a potential tool to evaluate the risk of prostate cancer.Acknowledgements
No acknowledgement found.References
[1] Quinn M, Babb P. Patterns and trends in prostate cancer incidence, survival, prevalence and mortality. Part I: international comparisons. BJU Int 2002;90:162–173.
[2] Yin H, Wang D, Yan R, et al. Comparison of diffusion kurtosis imaging and amide proton transfer imaging in the diagnosis and risk assessment of prostate cancer[J]. Frontiers in Oncology, 2021, 11: 640906.
[3] Jia G, Abaza R, Williams J A D, et al. Amide proton transfer MR imaging of prostate cancer: a preliminary study[J]. Journal of Magnetic Resonance Imaging, 2011, 33(3): 647-654.
[4] Zhou J, Tryggestad E, Wen Z, et al. Differentiation between glioma and radiation necrosis using molecular magnetic resonance imaging of endogenous proteins and Peptides. Nature Med 2011;17:130-134.
Figures