2062
Effect of Echo Times on Prostate Cancer Detection on Diffusion Weighted Images at high b-value and Apparent Diffusion Coefficient maps1University of Chicago, CHICAGO, IL, United States, 2Sanford J. Grossman Center of Excellence in Prostate Imaging and Image Guided Therapy, Chicago, IL, United States
Synopsis
Keywords: Prostate, Diffusion/other diffusion imaging techniques
This study compared the effect of echo times on the detection of prostate cancer on DWI at high b-value and ADC maps. Contrast between benign tissue and cancer increased significantly with higher TE on ADC maps. However, due to increased noise at higher TEs, CNR (study endpoint) was highest at TE 57 ms; higher by 23, 26, 33% than that at TE 70, 150 and 200 ms on ADC maps. CNR, contrast ratio AND auc are higher at lower TE on DWI high-b image. Therefore, the use of lower echo times for DWI and ADC mapping may improve prostate cancer.Introduction
Diffusion weighted images (DWI) and apparent diffusion coefficient (ADC) maps remain an integral part of prostate MRI as per the latest PIRADS v2.1 guidelines(1). However, PIRADS guidelines provide very limited technical specifications which lead to variation in multiparametric MRI protocols across imaging centers making meta-data analysis and comparing images and radiologist performance across institutions difficult. PIRADS recommends an echo time (TE) ≤90ms be utilized for DWI. However, here is little information in the literature to back this up.For T2-weighted images, higher TE was shown to improve prostate cancer detection(2). Feng et. al showed that quantitative IVIM parameters are clearly affected by TE(3). Therefore, determining the optimal TE for detecting prostate cancer on DWI and ADC maps may be useful for improving prostate cancer diagnosis and to standardize protocols across institutions. This study aims to compare the effect of different echo times on the detection of prostate cancer on DWI at high b-value and ADC maps.
Materials and Methods
This study involved retrospective analysis of prospectively collected data. 35 participants (mean age 60 years, mean PSA 9.0ng/ml) with biopsy-confirmed prostate cancer underwent MR imaging with a 3T Philips MR scanner prior to radical prostatectomy. Axial images DW imagines were taken as part of the Hybrid Multi-dimensional MRI and acquired using b-values of 0, 150, 750, 1500 s/mm2 at each TE of 57, 70, 150, and 200 ms using a spin-echo module, single shot echoplanar imaging readout, fat saturation using spectrally adiabatic inversion recovery, TR=5000ms, resolution= .50mm×1.50mm×3.00mm.ADC maps were calculated at each TE using a mono exponential fit. ROIs were taken for the pathology confirmed index lesions and benign tissue on the contralateral side on T2W and transferred to DWI high b-value image (b=1500 s/mm2) and ADC maps for each TE keeping the size and shape the same. Mean ADC, signal at high b was measured for cancer and benign ROIs. Noise was measured as the standard deviation found in internal obturator muscles. We calculated the contrast to noise ratio or CNR (difference in ADC or DWI signal between cancer and benign tissue / noise) for each patient.
The difference between metrics was assessed by Friedman’s test. Receiver operating characteristic (ROC) analysis was used to evaluate the performance of parameters in differentiating cancer from benign prostatic tissue.
Results
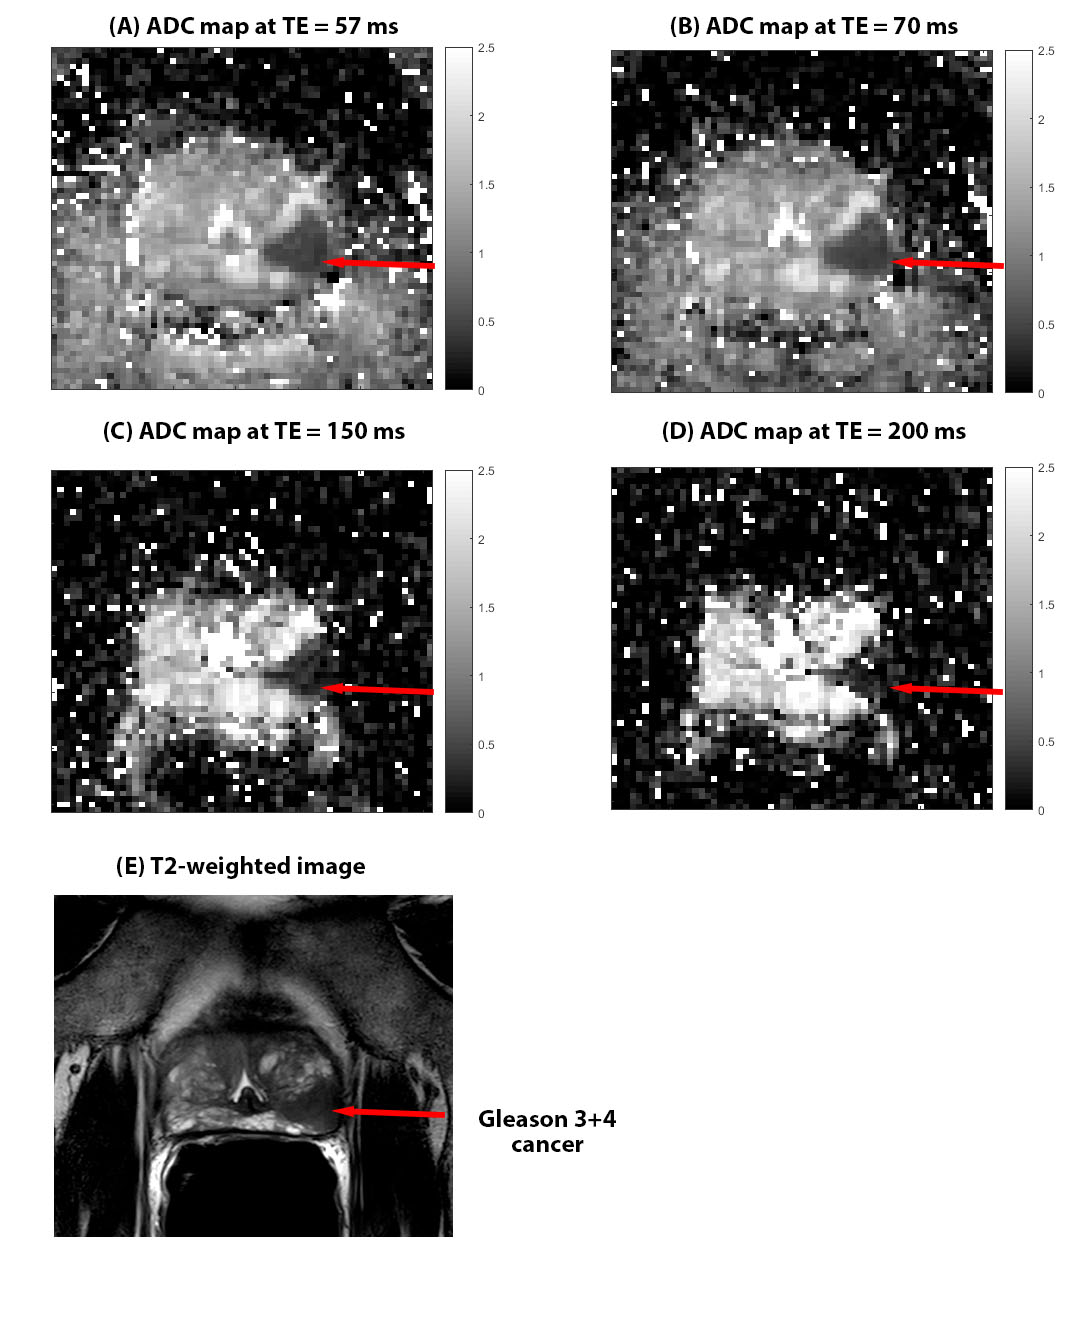
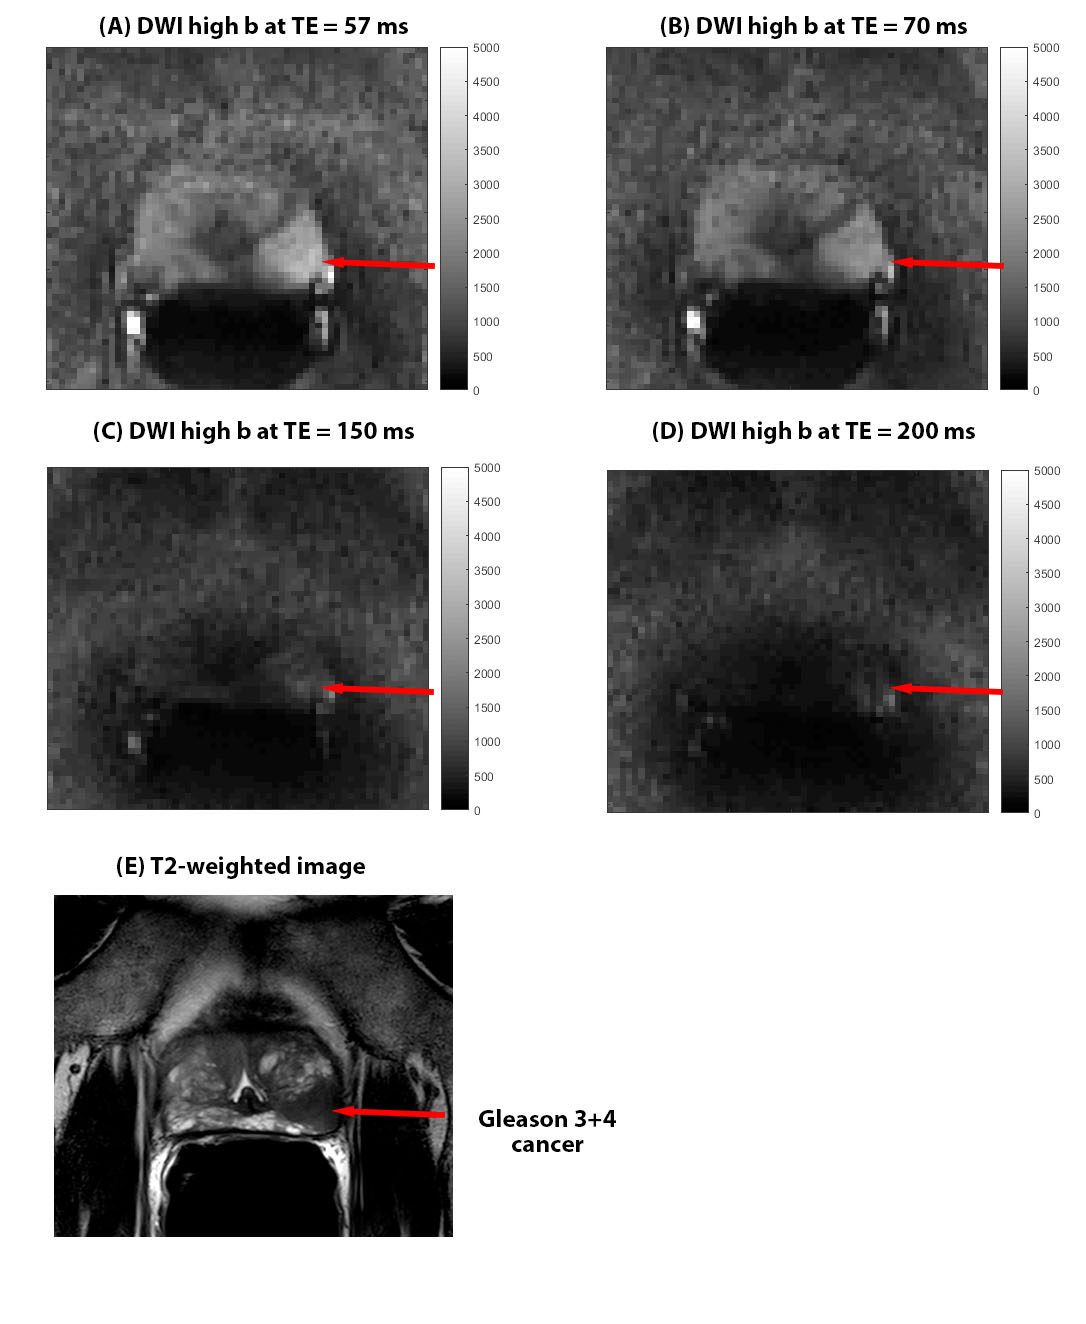
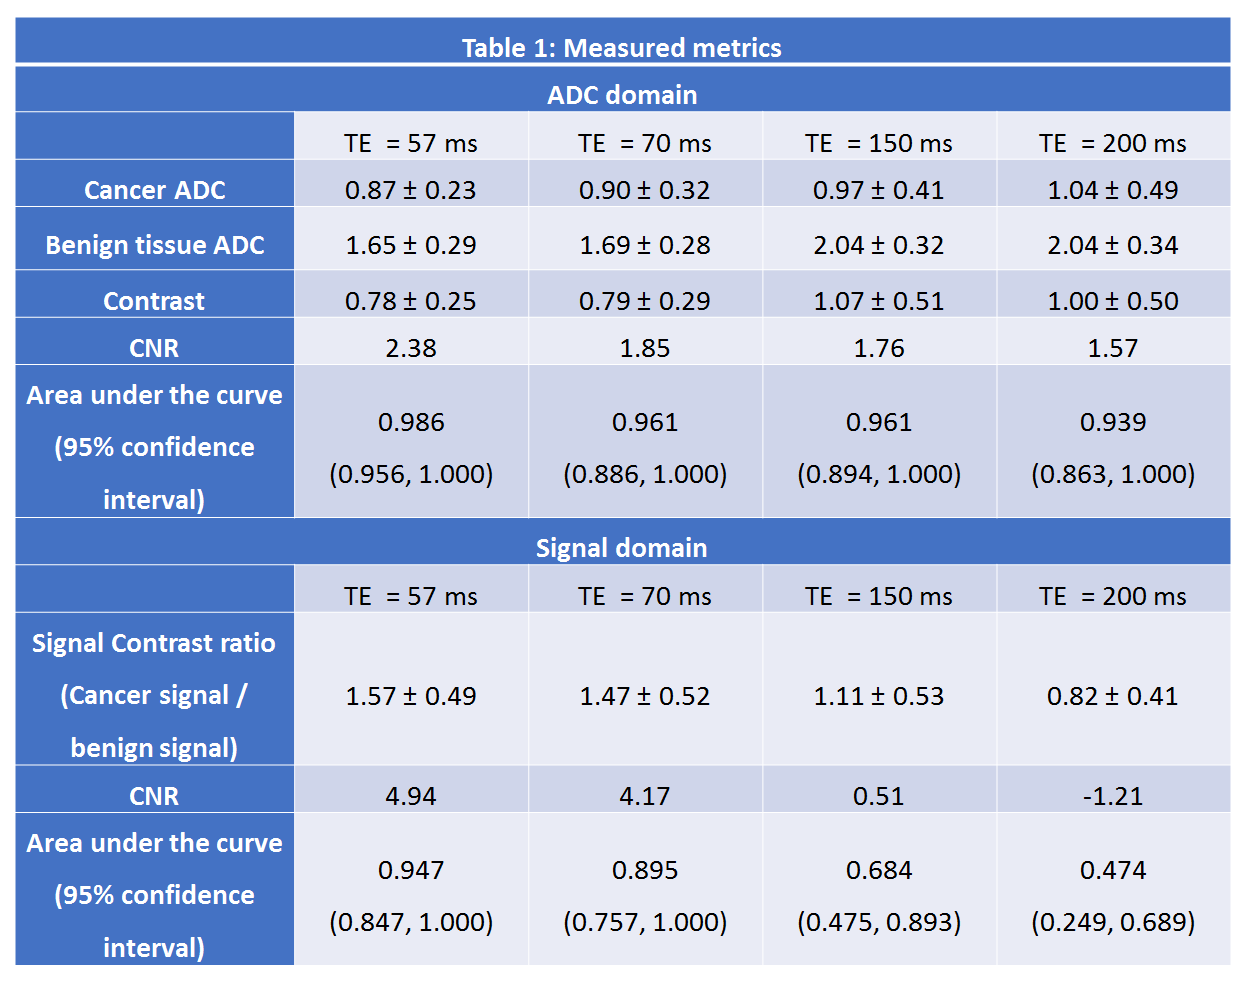
Figure 1 and 2 shows a representative images for a Gleason 3+4 cancer. Table 1 has detailed results of the study, summarizing the measured metrics.The average ADC values for benign tissue increased significantly with increased TE (χ2=25.042,p<0.001). However, no significant differences (χ2=3.379,p=0.34) in ADC values at different TEs was found for cancers. The contrast between benign tissue and cancer increased significantly (χ2=11.905, p=0.008) with higher TE. Contrast at TE 57 was significantly lower than that at TE 150 (p=0.01) and 200 ms (p=0.01), while contrast at TE 70ms is lower than that at TE 150 (p=0.01) and 200 ms (p=0.04). However, contrast is similar at TE 57 and 70ms (p=0.52). However, due to higher noise at higher TEs, our study endpoint, CNR significantly decreases at higher TE (χ2=12.158,p=0.007). CNR at TE 57 was significantly higher than that at TE 150 (26% higher, p=0.03) and 200 ms (34% higher, p=0.04), but not different from TE 70ms (p=0.17). Area under the ROC curve (AUC) was highest (nominally) using ADC values at TE 57ms (0.986) compared to 0.961, 0.961 and 0.939 at TE 70,150 and 200 ms, respectively.
Due to scaling differences contrast ratio between benign and cancer was used for DWI signal at high b-value, with significantly (χ2=15.821p=0.001) lower contrast ratio found at higher TEs (including post hoc tests). The CNR for high b DWI was significantly higher at lower TE (χ2=31.933,p<0.001), with CNR at TE 57 ms significantly higher than others. There is negative mean CNR at TE 200 ms, suggest cancers don’t show hyperintensity compared to surrounding benign tissue on DWI high b. AUCs at TE 57 and 70ms was significantly higher than at 150 and 200ms.
Discussion
Contrast on ADC maps improves at higher TE, especially as ADC of benign tissue increases with higher TE, which is similar findings of a previous paper(4). However due to higher noise at high TEs, CNR is better at lower TEs, which the other paper didn’t investigate. Furthermore, CNR on DWI high b-value was also best at lower TEs. This is supported by higher AUC for cancer diagnosis.Cancer has a higher fractional volume of epithelial cells which have lower T2(5). When higher TEs are used, there is very little signal even on DWI b=0 images. So even after signal suppression of fluid in lumen and stroma at higher b-values, cancers may not show hyperintensity compared to surrounding benign tissue. This is why we see negative CNR at TE 200ms at DWI high b. At lower TEs there is higher signal at b=0 from cancer cells, which are then suppressed less than benign tissue at higher b-value, showing higher CNR on DWI high b and ADC maps.
Conclusion
The use of lower echo times may improve prostate cancer detection with lower TEs showing better CNR on DWI high b-value and ADC maps.Acknowledgements
This study was supported by NIH (R01 CA227036, 1R41CA244056-01A1, R01 CA17280, 1S10OD018448-01), and Sanford J. Grossman Charitable Trust.References
1. Turkbey B, Rosenkrantz AB, Haider MA, Padhani AR, Villeirs G, Macura KJ, Tempany CM, Choyke PL, Cornud F, Margolis DJ, Thoeny HC, Verma S, Barentsz J, Weinreb JC. Prostate Imaging Reporting and Data System Version 2.1: 2019 Update of Prostate Imaging Reporting and Data System Version 2. European Urology 2019;76(3):340-351.
2. Chatterjee A, Nolan P, Sun C, Mathew M, Dwivedi D, Yousuf A, Antic T, Karczmar GS, Oto A. Effect of Echo Times on Prostate Cancer Detection on T2-Weighted Images. Academic Radiology 2020;27(11):1555-1563.
3. Feng Z, Min X, Wang L, Yan X, Li B, Ke Z, Zhang P, You H. Effects of Echo Time on IVIM Quantification of the Normal Prostate. Scientific Reports 2018;8(1):2572.
4. Sadinski M, Karczmar G, Peng Y, Wang S, Jiang Y, Medved M, Yousuf A, Antic T, Oto A. Pilot Study of the Use of Hybrid Multidimensional T2-Weighted Imaging–DWI for the Diagnosis of Prostate Cancer and Evaluation of Gleason Score. American Journal of Roentgenology 2016;207(3):592-598.
5. Chatterjee A, Mercado C, Bourne RM, Yousuf A, Hess B, Antic T, Eggener S, Oto A, Karczmar GS. Validation of Prostate Tissue Composition by Using Hybrid Multidimensional MRI: Correlation with Histologic Findings. Radiology 2022;302(2):368-377.
Figures