2061
Evaluation of the clinical value of Synthetic MRI in the prostate cancer diagnosis: a comparison of quantitative relaxation with conventional MRI12nd Affiliated Hospital of Nanjing Medical University, Nanjing, China, 2MR Research China, GE Healthcare, Beijing, China
Synopsis
Keywords: Prostate, Prostate
This study aimed to investigate the feasibility of synthetic MRI in distinguishing PCa from benign hyperplasia, and quantitative relaxation was compared with conventional MRI to evaluate the precision of obtained values with synthetic MRI. 38 patients (54 lesions) with cancer and/or hyperplasia were recruited. Quantitative MRI sequences, including T1, T2 mapping and MAGIC, were used. Significantly different T1 and T2 values were shown between cancer and noncancerous tissue, located in peripheral and center zones, as well as between cancer and glandular hyperplasia and stromal hyperplasia. These findings suggest synthetic-MRI may be effective in differentiating PCa from benign hyperplasia.Introduction
Prostate cancer (PCa) is the malignant tumor with the highest incidence and the second leading cause of death in European and American men, with an occurrence of about 20% and specific mortality rate of about 21.7%[1]. The number of new cases of prostate cancer in China is higher than that in European and American countries, and the incidence rate of urinary malignancy ranks second only to bladder cancer. Clinical diagnosis is based on serum prostate-specific antigen (PSA) assessment, digital rectal examination, and transrectal ultrasound (TRUS) guided biopsy. With the continuous development of medical device technology, magnetic resonance imaging (MRI) has been recognized as the best method for prostate examination. Quantitative relaxation MRI has become increasingly important in the imaging diagnosis of prostate cancer[2-3], combined with conventional MRI is still considered as the gold standard for the determination of quantitative relaxation value. However, its long scanning time and poor compliance during examination seriously affect the stability of quantitative delay value. In recent years, synthetic MRI technology can obtain up to 10 quantitative values such as T1, T2 and PD through a single acquisition[4], providing a new idea for the clinical diagnosis of prostate cancer. The difference of T1 and T2 values between synthetic MRI and quantitative relaxation with conventional MRI is also a question to be discussed in this study.Materials and Methods
SubjectsA total of 38 patients (mean age 69.87 ± 8.15 years ranging from 55-87 years) with clinically suspected PCa were recruited in the study. All patients underwent serum PSA assessment, digital rectal examination, MRI, and TRUS-guided biopsy after MRI examination.
MR Imaging
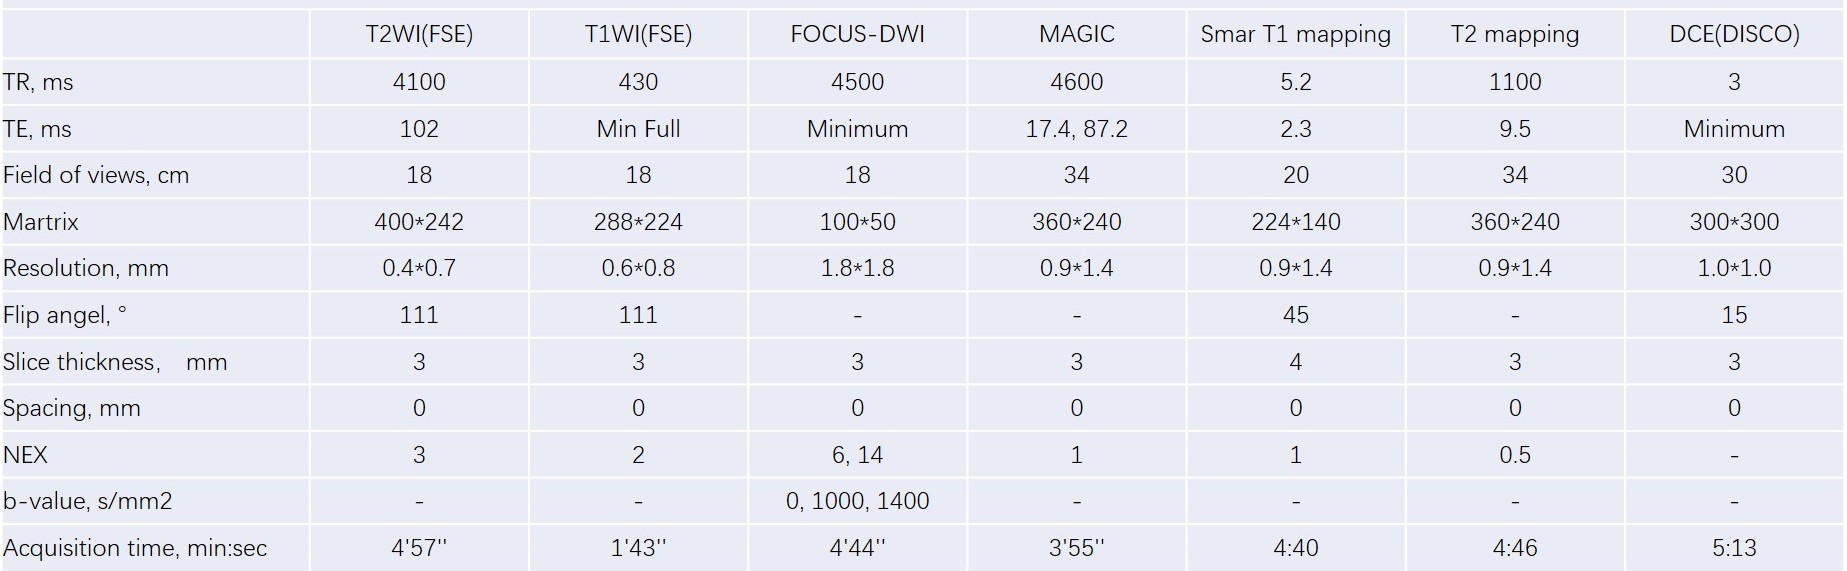
A 3.0T MR scanner (GE Medical Systems, PREMIER MR) with a 30-channel phased-array body coil was used for all subjects. MAGIC, SMART1 and T2 mapping were applied for T1 and T2 value measurement. Other scan parameters are presented in table 1.
Data analysis
All MRI data were post-processed using vendor-provided software on GE ADW4.7 workstation. The corresponding T1, T2, and ADC maps were obtained accordingly for each patient. Two radiologists were employed to manually draw regions of interest (ROI) in prostate lesions. The mean level of each metric was obtained for further analysis.
Statistical analysis
SPSS 20.0 statistic software and MedCalc software (version 15.2.2) were used. The paired t-test and independent sample t-test were applied to assess the differences between quantitative relaxation parameters of MAGIC and conventional MRI. The receiver operating characteristic curve (ROC) with the area under the curve (AUC) was used to evaluate the diagnostic of each quantitative parameter in PCa diagnosis.
Results
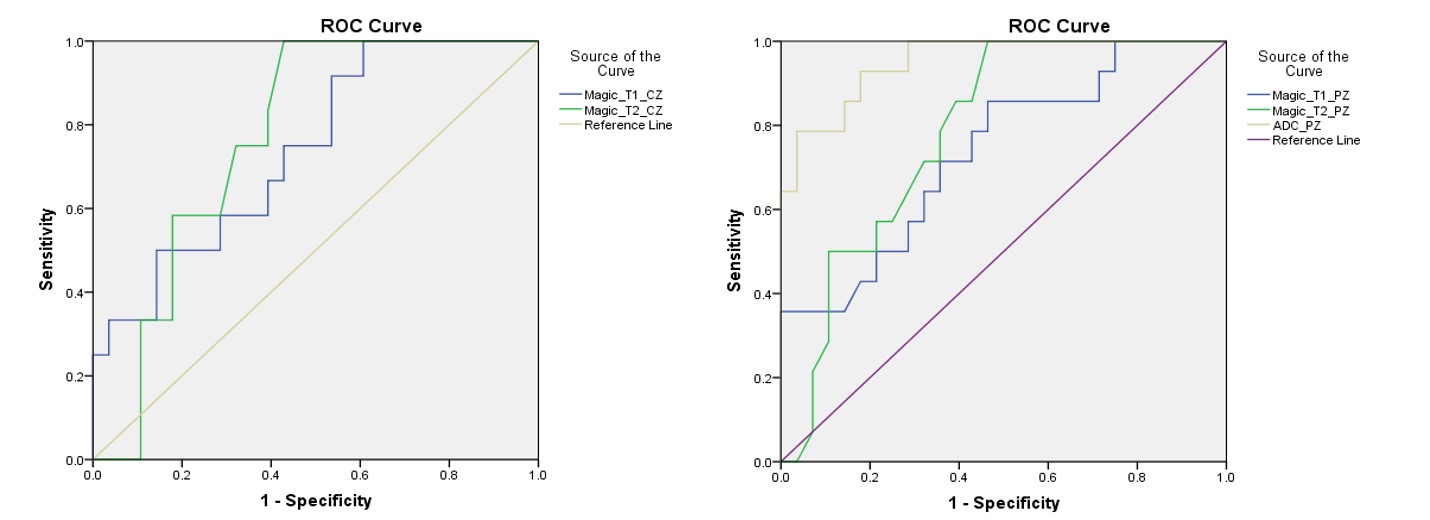
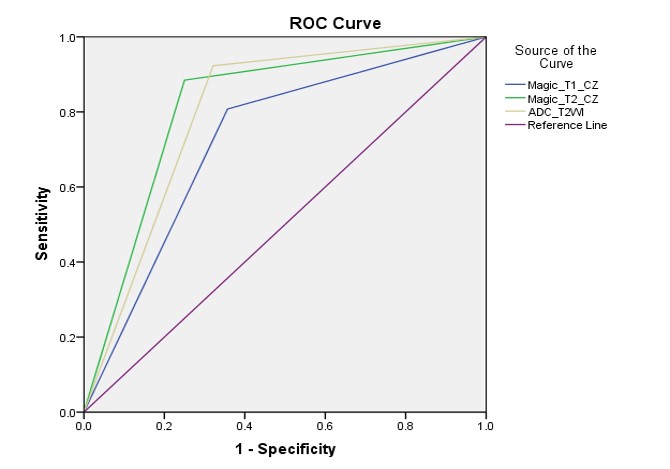
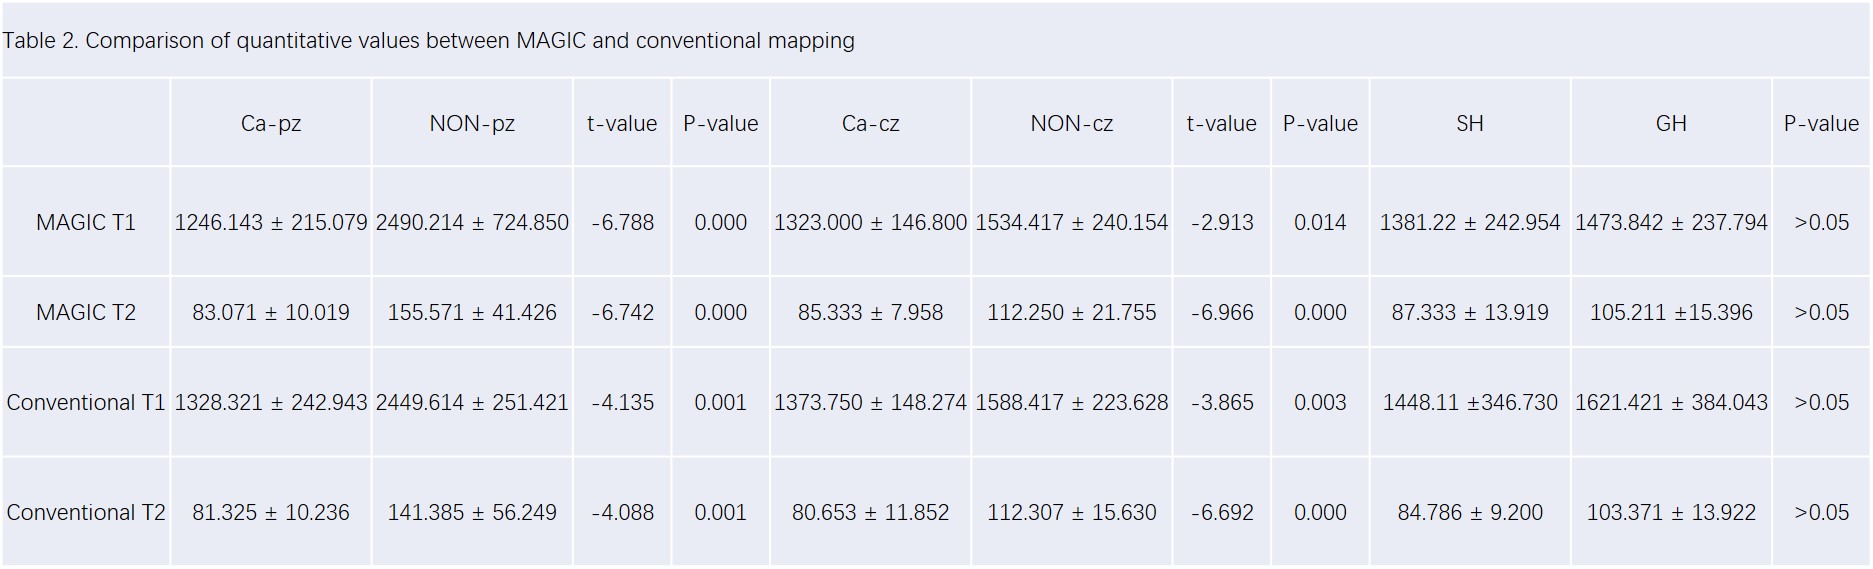
Excellent inter-observer agreement of each parameter measurement was confirmed by high intraclass correlation coefficients (ICC) (>0.90 for each parameter). T1 and T2 between MAGIC and conventional mapping MRI in cancers of center zone (PCa-cz), peripheral zone (PCa-pz), noncancerous peripheral zone (NON-pz), noncancerous center zone (NON-cz), stromal hyperplasia (SH), and glandular hyperplasia (GH) are presented in Table 2, and all p values were > 0.05. T1 values of MAGIC and conventional mapping MRI in PCa-cz and NON-cz were 1323.000 ± 146.800 and 1534.417 ± 240.154, 1373.750 ± 148.274 and 1588.417 ± 223.628, respectively. T1 values of those in PCa-pz and NON-pz were 1246.143 ± 215.079 and 2490.214 ± 724.850, respectively. T2 of those in PCa-cz were 85.333 ± 7.958 and 112.250 ± 21.755, 80.653 ± 11.852 and 112.307 ± 15.630, respectively. T2 of those in PCa-pz were 83.071 ± 10.019 and 155.571 ± 41.426, 81.325 ± 10.236 and 141.385 ± 56.249, respectively. All p values were < 0.05. T1 of those in SH and GH were 1381.22 ± 242.954 and 1473.842 ± 237.794, 1448.11 ± 346.730 and 1621.421± 384.043, respectively. T2 of those in SH and GH were 87.333 ± 13.919 and 105.211 ±15.396, 84.786 ± 9.200 and 103.371 ± 13.922, respectively. All p values were > 0.05. The AUC of T1 and T2 values of MAGIC values in CZ and PZ were 0.741 and 0.748 , 7.734 and 0.784 (Figure 1), respectively. The corresponding optimal diagnostic efficacy for T1, T2 of MAGIC and T2+DWI+ADC with AUC were 0.725, 0.817, and 0.801, respectively (Figure 2).Discussion and Conclusion
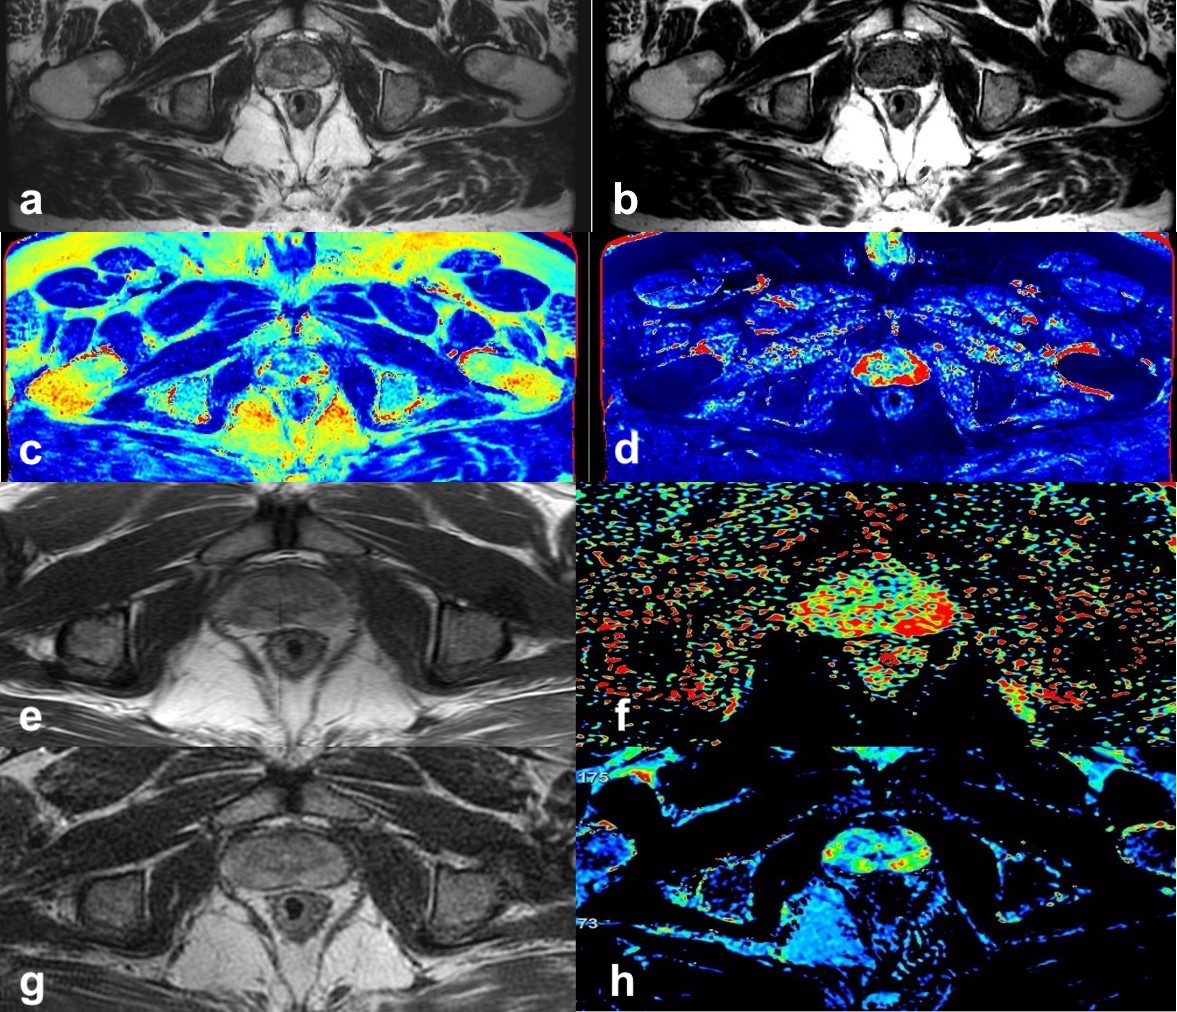
In terms of scanning time, the conventional mapping took approximately 10min, but MAGIC as synthetic MRI only took 3 minutes and 55 seconds. The accuracy of T1 and T2 in MAGIC has been demonstrated by conventional mapping methods. Clinical studies have also shown differential values between peripheral, center, and local lesions (Figure 3). In conclusion, MAGIC-derived quantitative maps can be considered effective in differentiating PCa from benign hyperplasiaAcknowledgements
No acknowledgments foundReferences
1. Siegel RL, Miller KD, Jemal A. Cancer statistics, 2019. CA: a cancer journal for clinicians, 2019, 69(1): 7-34.
2. Dongyeob Han, Moon Hyung Choi, Young Joon Lee, et al. Feasibility of novel three-dimensional magnetic resonance fingerprinting of the prostate gland: phantom and clinical studies. Korean Journal of Radiology, 2021, 22(8):1332-1340.
3. A. Hoang Dinh, R. souchon, C. Melodelima, et al. Characterization of prostate cancer using T2 mapping at 3 T: A multi-scanner study. Diagnostic and Interventional Imaging, 2015, 96: 365-372.
4. Tiebao Meng1, Ni He, Haoqiang He, et al. The diagnostic performance of quantitative mapping in breast cancer patients: a preliminary study using synthetic MRI. Cancer Imaging, 2020, 20(1): doi.org/10.1186/s40644-020-00365-4.
Figures