2055
Liver R2* with magnitude fitting in iron-overload patients – initial results on agreement between protocol settings and between 1.5T and 3T1MR Application Pevelopment, Siemens Healthcare GmbH, Erlangen, Germany, 2Department of Diagnostic and Interventional Radiology, Ulm University Medical Center, Ulm, Germany, 3Section for Experimental Radiology, Ulm University Medical Center, Ulm, Germany, 4MR R&D Collaborations, Siemens Medical Solutions, Inc., Los Angeles, CA, United States, 5Department of Pediatrics and Adolescent Medicine, Ulm University Medical Center, Ulm, Germany
Synopsis
Keywords: Liver, Quantitative Imaging, R2*, iron content
Purpose: Preliminary liver R2* comparison in patients across field strengths and protocols.
Methods: 3T R2* from 3D multi-gradient echo data with magnitude fitting was mapped to 1.5T R2*. Limits of agreement were calculated.
Results: Converted 3T R2* agreed well with 1.5T R2*. Best 95% limits of agreement were [-4.9% 7.6%] for 1.5T R2* [166s-1 865s-1] and [-34.5% 41.7%] for [49s-1. 865s-1].
Conclusion: 3T R2* agrees well with 1.5T R2* and can be used interchangeably for 3T R2* between 328s-1 and 1699s-1 with an optimized protocol. For low R2* values, protocols with longer echo times should be used.
Introduction
R2*-based liver iron concentration (LIC) estimation from 3D multi-gradient-echo imaging in combination with simultaneous proton density fat fraction (PDFF) estimation is a promising tool for characterizing diffuse liver disease. The comparability of R2* values across field strengths and protocol settings is of prime interest, as are the limits of reliable estimation, especially at higher field strengths. Recently, complex-based fitting was compared between field strengths, and good agreement was found1. We present here preliminary results from an ongoing study comparing liver R2* in the same subjects across 1.5T and 3T, as well as varying protocol settings, for magnitude-based nonlinear least-squares fitting.Methods
Raw data were collected of patients who underwent liver MRI at 1.5T (MAGNETOM Sola, Siemens Healthcare, Erlangen, Germany) for known or suspected liver iron overload, and who gave informed consent to also be scanned at 3T (MAGNETOM Vidafit, Siemens Healthcare, Erlangen, Germany) on the same day. Protocols with bipolar readout gradients and different echo times (TE) were used; settings are summarized in table 1.The raw data were retrospectively reconstructed in the scanner image reconstruction framework using multi-step adaptive pixel-wise fitting2,3 for simultaneous estimation of one “effective” R2* and PDFF, using magnitude data in the innermost core while accounting for the spectral complexity of fat.
Matching ROIs were drawn in the same anatomical locations on R2* maps for all protocols using custom software written in Matlab (MathWorks, Natick, MA, USA). 3T R2* ROI mean values were transformed into expected 1.5T R2* values using the theoretical relation
$$R_2^*(1.5T) = (R_2^*(3T)-R_{i,3T}) / E_R + R_{i,1.5T}$$
as described in reference4: The intrinsic relaxation rates were assumed to be $$$R_{i,1.5T} = R_{i,3T} = 20s^{-1}$$$, and the relaxation enhancement was calculated to be $$$E_R = 1.96$$$, considering the exact resonance frequencies of the systems. The transformed 3T R2* values were compared to those from 1.5T, as well as R2* values between different protocols. Bias and 95% limits of agreement (LOA) were calculated using Bland-Altman analysis. Upper limits of accurate R2* for 3T were estimated visually from the Bland-Altman plots using the 1.5T results from the “optimized” protocol (see table 1) as a reference, and the analysis was also done on corresponding sub-ranges of R2*.
Results
At this point, raw data of 20 patients from both 1.5T and 3T have been collected, with age distribution (mean ± std) 41.0±20.8 years (range 16.9-70.4 years). Two data sets were excluded from analysis since they did not comprise all relevant protocols, and one data set was excluded because of strong image artifacts.R2* values of the remaining 17 cases ranged between 49s-1 and 865s-1 at 1.5T, and between 60s-1 and 1699s-1 at 3T, corresponding to a range of LIC between ~1mg/g and ~26mg/g Fe in dry weight. PDFF ranged between 1.8% and 21.8%, excluding the case with the highest R2*.
Exemplary R2* maps are shown in figure 1. A plot of correlation is shown in figure 2, and Bland-Altman plots in figure 3. Table 2 lists bias and LOA for selected combinations of R2* and different R2* ranges.
Discussion
The preliminary results from this study are in good agreement with the existing literature, with R2* at 3T following almost exactly the predicted relationship with that of 1.5T. The TE range has a large impact on the range of accurate R2* estimation at 3T: For the two protocols studied here, the upper limit of accurate R2* seems to differ by at least a factor of 2 for moderate differences in TE.The currently used protocols exhibit high variability in the low R2* range, which appears plausible given that the highest TE is considerably lower than the T2* of normal liver. For completeness, a comparison of R2* in healthy controls using protocols with longer TEs should be performed. Protocols with both short initial TEs and a larger TE range will require noise correction for the magnitude fit5,6, which has not yet been applied to the raw data collection.
Strengths of the current study are the minimal delay between the 1.5T and 3T acquisitions, as well as the simultaneous, co-localized prescription of the manual ROIs, which minimizes spurious variability. Limitations include the current low number of cases, and the single-center nature of the study.
Conclusion
It appears possible to perform accurate iron quantification at 3T up to and beyond ~1600s-1 R2* (~25mg/g Fe in dry weight LIC), using magnitude fitting. Optimized protocols are crucial to achieve this range.Acknowledgements
No acknowledgement found.References
1. Hernando D, Zhao R, Yuan Q, et al. Multicenter Reproducibility of Liver Iron Quantification with 1.5-T and 3.0-T MRI. Radiology. 2022 Oct 4. Online ahead of print.
2. Zhong X, Nickel MD, Kannengiesser SAR, et al. Liver fat quantification using a multi-step adaptive fitting approach with multi-echo GRE imaging. Magn Reson Med. 2014;72(5):1353-65.
3. Wunderlich AP, Schmidt SA, Mauro V, et al. Liver Iron Content Determination Using a Volumetric Breath-Hold Gradient-Echo Sequence With In-Line R2 * Calculation. J Magn Reson Imaging. 2020;52(5):1550-1556.
4. Ghugre NR, Doyle EK, Storey P, and Wood JC. Relaxivity-iron calibration in hepatic iron overload: Predictions of a Monte Carlo model. Magn Reson Med. 2015;74(3):879-83.
5. Zhong X, Dale BM, Nickel MD, et al. Improved accuracy of apparent diffusion coefficient quantification using a fully automatic noise bias compensation method: Preliminary evaluation in prostate diffusion weighted imaging. J Magn Reson. 2019;305:22-30.
6. Healy GM, Kannengiesser SAR, Espin-Garcia O, et al. Comparison of Inline R2* MRI versus FerriScan for liver iron quantification in patients on chelation therapy for iron overload: preliminary results. Eur Radiol. 2021;31(12):9296-9305.
7. Breuer FA, Blaimer M, Mueller MF, et al. Controlled aliasing in volumetric parallel imaging (2D CAIPIRINHA). Magn Reson Med. 2006;55(3):549-56.
Figures
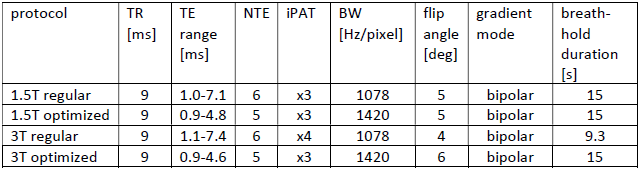
Table 1: Key protocol parameters. NTE = number of echoes, BW = bandwidth, iPAT = acceleration factor (CAIPIRINHA7).
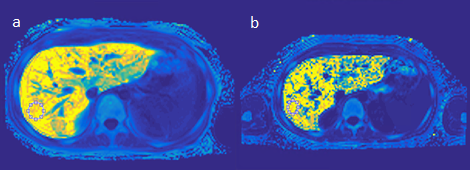
Figure 1: Exemplary R2* maps and ROIs of a patient with 1.5T R2* of 865s-1 (a, optimized protocol, displayed values 0-900) and 3T R2* of 1699s-1 (b, optimized protocol, displayed values 0-1750).
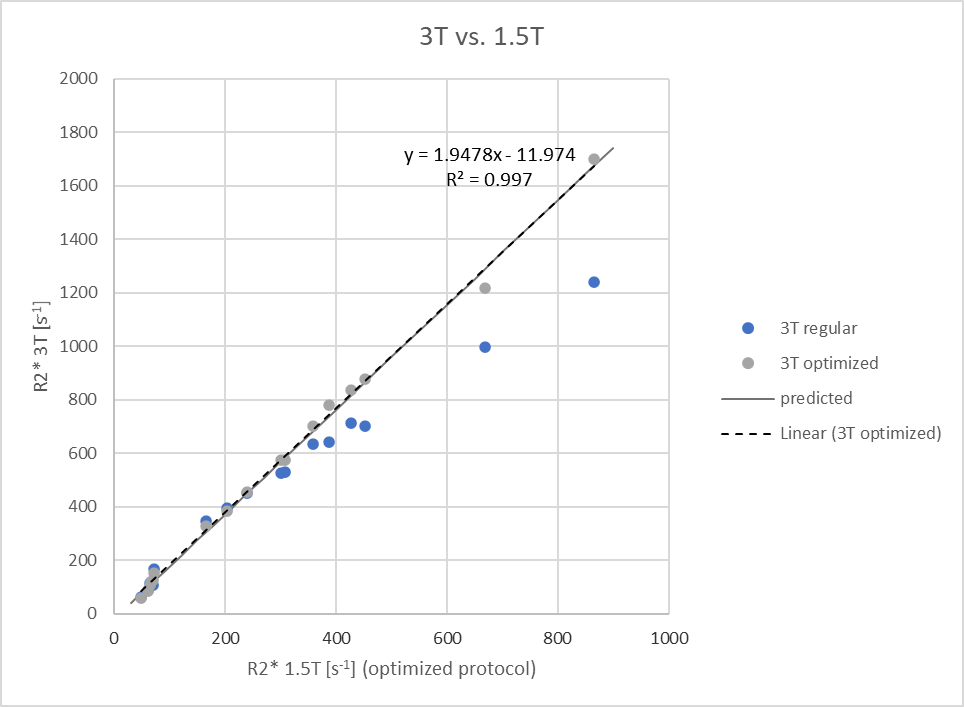
Figure 2: Correlation plot of R2* between 1.5T (optimized protocol) and 3T. The predicted relationship is that from Ghugre et al.4; The linear regression for the optimized protocol agrees very well with it.
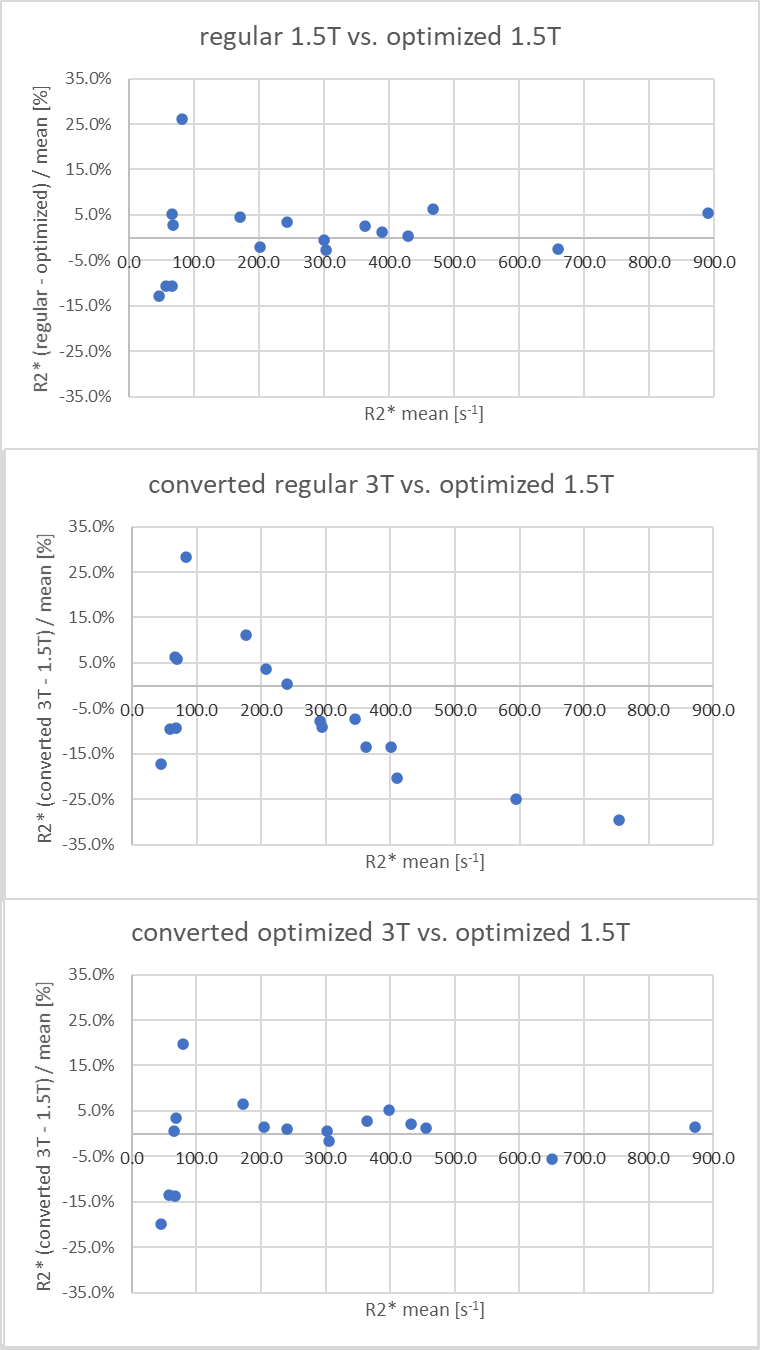
Figure 3: Plots of relative R2* differences vs. mean R2* between field strengths and protocols. The regular 3T protocol shows progressive R2* under-estimation with higher mean R2*, while the optimized 3T protocol does not. Bias and LOA from Bland-Altman analysis over different R2* ranges are listed in table 2.
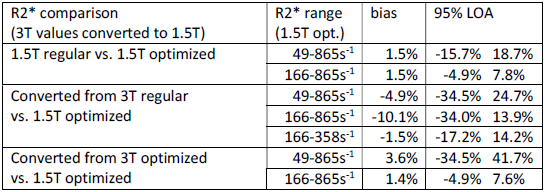
Table 2: Results from Bland-Altman analysis for different combinations of R2* estimations and R2* ranges of the optimized 1.5T protocol.