2054
3D liver R2, R2* and quantitative susceptibility maps in a single breath-hold1Applied and engineering physics, Cornell university, New York, NY, United States, 2Biomedical engineering, Cornell university, New York, NY, United States, 3Weill Cornell Medicine, New York, NY, United States
Synopsis
Keywords: Liver, Multi-Contrast
In this work, a 3D stack-of-spiral spoiled gradient echo sequence was implemented using T2 prepared single and multi-echo gradient echo acquisition for simultaneous R2, R2* and QSM mapping in a single breath hold within 24 secs.Introduction
Multi-contrast images in MRI provide comprehensive characteristics for diagnosis but normally take a few breath-holds and requires retrospective co-registration for ROI alignment. R2 maps generated from single-echo GRE acquisition provide the anatomy information of a subject while multi-echo GRE images can be used to calculate R2* relaxation and susceptibility maps. The differential effect of vessel size on R2 and R2* after the administration of allows its estimation in vivo [1]. In this work, we show our preliminary results using variable density 3D stack-of-spiral GRE sequence for the simultaneous mapping of R2, R2* and susceptibility within a single breath-hold.Methods:
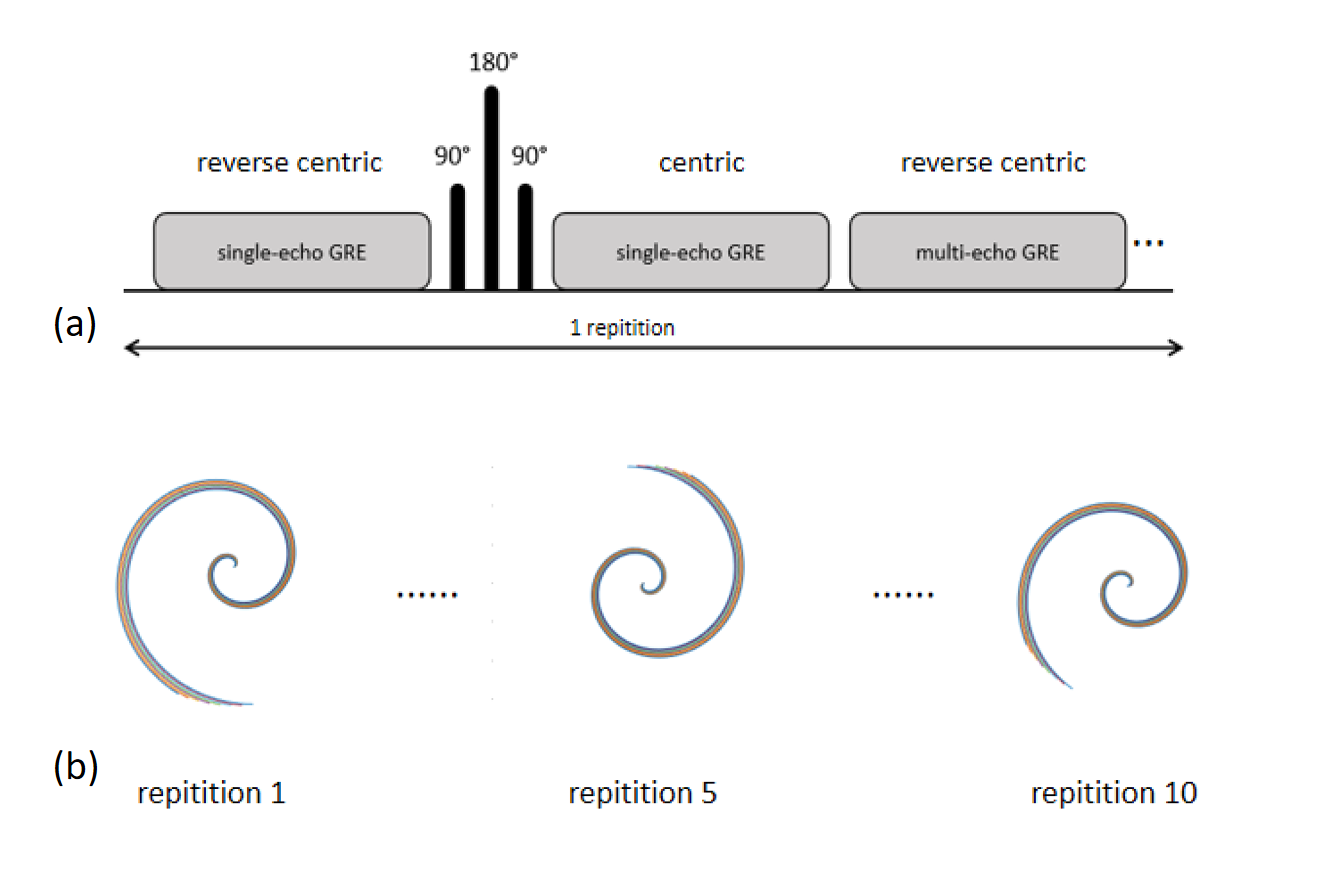
A multi-contrast gradient-echo sequence including both single-echo and multi-echo readouts and T2 preparation was implemented to acquire 3 sets of images (Fig.1a) in a number of segments. In each segment, eight consecutive leaves rotated based on 2*pi/#leaves are acquired for each slice. The first set is acquired with reverse centric slice order, the second set (after the T2-preparation using TE=27.2) with a centric slice order, and the third set (acquiring multi-echo readouts) with a reverse centric slice order. The whole image volume consisted of 80 leaves, and therefore the 3 sets in Fig.1(a) was repeated 10 times (Fig.1b). A small flip angle of 6 degree was used to reduce T1 weighting. The sequence was tested on a 3T scanner on healthy volunteers with 5mm slice thickness under a breath hold within 24sec, 516 readout points per leaf, matrix size 256×256×12, and FOV = 420mm. The number of echoes for the multi-echo readouts is Ne= 4, TE1/TR/ΔTE = 0.4/15.4/3.6ms, and TR for the single echo readout is 4.6ms. The T2 map was estimated by a single exponential fit to the first two sets of images. T2* was estimated using multi-echo complex signal fitting. A field map was fit to the multi-echo complex data and unwrapped using a graph-cut based method, with iterative decomposition of water and fat with echo asymmetry and least squares estimation (IDEAL) [2] for water fat separation. QSM is then computed from the field map using morphology enabled dipole inversion (MEDI) [3]. Positive and negative susceptibility source quantification is also used to diagnose certain diseases such as liver fibrosis [4-5], and recently a susceptibility source separation from gradient echo data using QSM and R2* maps was proposed [6]. We also demonstrate that our sequence can be used for susceptibility source separation.Results
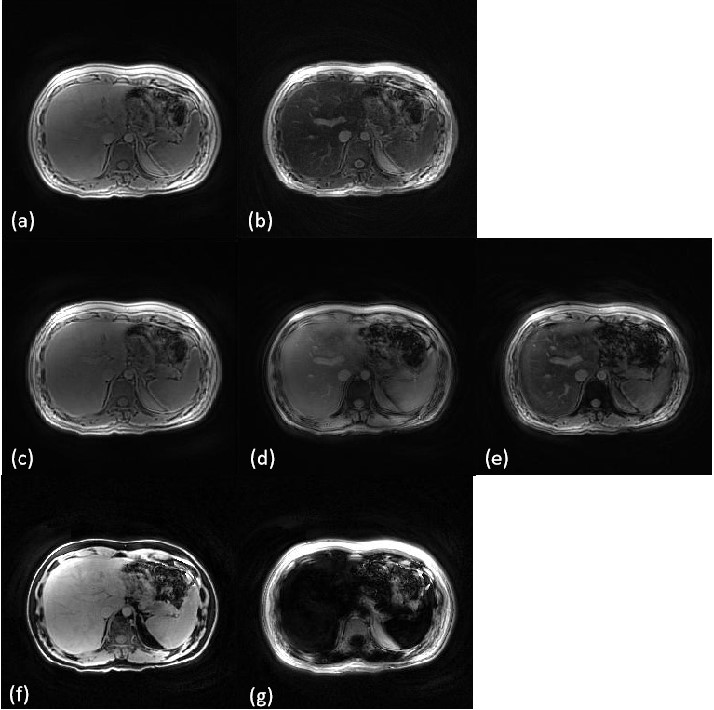
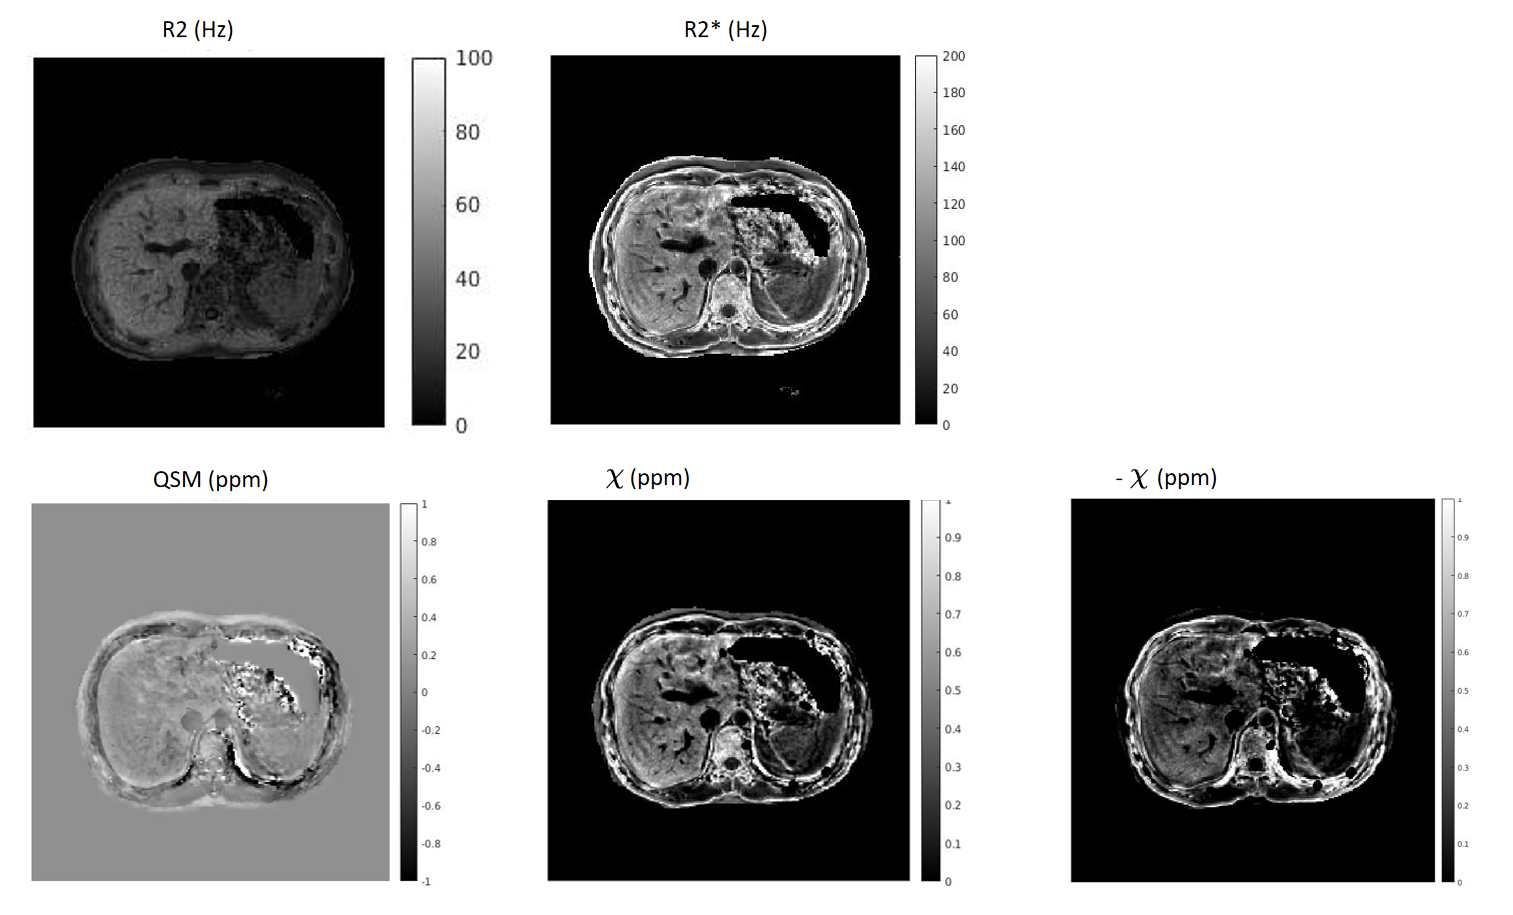
Fig.2 (a-e). shows the 3 image elements sampled including the single-echo images right before and after the T2 preparation and the multi-echo image. Fig.2(f-g) displays the water and fat images calculated from the multi-echo signals and our echo spacing 3.6ms is ideal for in/out phase water/fat separation.Fig.3 includes the R2 and R2* maps computed by fitting the single-echo and multi-echo images respectively. The R2 and R2* values for the liver falls approximately in 30-40 Hz and 50 -80 Hz respectively. The positive and negative sources $$$\chi$$$ and $$$-\chi$$$ was also shown in Fig.3.Discussion and conclusions
In conclusion, we designed and implemented a stack-of-spiral spoiled gradient echo sequence for multi-parametric liver imaging. Preliminary results demonstrates that our sequence is able to provide 3D R2, R2* and QSM images in a single breath hold within 24 secs, allowing susceptibility source separation in the liver.Acknowledgements
No acknowledgement found.References
1. Kiselev, V. G., Strecker, R., Ziyeh, S., Speck, O., & Hennig, J. (2005). Vessel size imaging in humans. Magnetic Resonance in Medicine: An Official Journal of the International Society for Magnetic Resonance in Medicine, 53(3), 553-563.
2. Reeder, S. B., Pineda, A. R., Wen, Z., Shimakawa, A., Yu, H., Brittain, J. H., Gold, G. E., Beaulieu, C. H., & Pelc, N. J. (2005). Iterative decomposition of water and fat with echo asymmetry and least-squares estimation (IDEAL): application with fast spin-echo imaging. Magnetic resonance in medicine, 54(3), 636–644. https://doi.org/10.1002/mrm.20624
3. Liu, J., Liu, T., de Rochefort, L., Ledoux, J., Khalidov, I., Chen, W., Tsiouris, A. J., Wisnieff, C., Spincemaille, P., Prince, M. R., & Wang, Y. (2012). Morphology enabled dipole inversion for quantitative susceptibility mapping using structural consistency between the magnitude image and the susceptibility map. NeuroImage, 59(3), 2560–2568. https://doi.org/10.1016/j.neuroimage.2011.08.082
4. Wei, H., Decker, K., Nguyen, H., Cao, S., Tsai, T. Y., Dianne Guy, C., Bashir, M., & Liu, C. (2020). Imaging diamagnetic susceptibility of collagen in hepatic fibrosis using susceptibility tensor imaging. Magnetic resonance in medicine, 83(4), 1322–1330. https://doi.org/10.1002/mrm.27995
5. Jafari, R., Hectors, S. J., Koehne de González, A. K., Spincemaille, P., Prince, M. R., Brittenham, G. M., & Wang, Y. (2021). Integrated quantitative susceptibility and R2 * mapping for evaluation of liver fibrosis: An ex vivo feasibility study. NMR in biomedicine, 34(1), e4412. https://doi.org/10.1002/nbm.4412
6. Dimov, A. V., Nguyen, T. D., Gillen, K. M., Marcille, M., Spincemaille, P., Pitt, D., ... & Wang, Y. (2022). Susceptibility source separation from gradient echo data using magnitude decay modeling. Journal of Neuroimaging.
Figures