2052
Association Between NAFLD and Blood Flow: Portal 4D-flow, 2D-flow, Hepatic Elasticity and Spleen Volume
Jonatan Eriksson1,2, Wolf Bartholomä2,3, Nils Dahlström2,3, Jens Tellman1,2, Stergios Kechagias4, Patrik Nasr4, Mattias Ekstedt2,4, Johan Kihlberg2,3, and Peter Lundberg1,2
1Department of Medical Radiation Physics, and Department of Health, Medicine and Caring Sciences, Linköping University, Linköping, Sweden, 2Center for Medical Imaging Science and Visualization, Linköping University, Linköping, Sweden, 3Department of Radiology in Linköping and Department of Health Medicine and Caring Sciences, Linköping University, Linköping, Sweden, 4Division of Diagnostics and Specialist Medicine, Department of Health, Medicine and Caring Sciences, Linköping University, Linköping, Sweden, Linköping, Sweden
1Department of Medical Radiation Physics, and Department of Health, Medicine and Caring Sciences, Linköping University, Linköping, Sweden, 2Center for Medical Imaging Science and Visualization, Linköping University, Linköping, Sweden, 3Department of Radiology in Linköping and Department of Health Medicine and Caring Sciences, Linköping University, Linköping, Sweden, 4Division of Diagnostics and Specialist Medicine, Department of Health, Medicine and Caring Sciences, Linköping University, Linköping, Sweden, Linköping, Sweden
Synopsis
Keywords: Liver, Blood vessels, 4D Flow, 2D Flow, MRE, Spleen
A group of 6 healthy and 9 NAFLD-patients underwent a multi-parametric MRI examination, including 4D-, 2D-flow, MRE and relaxometry. 2D-flow results were successfully extracted from 4D-flow data, showing good match with 2D-flow, indicating that 4D-flow provides the opportunity to both provide regular flow values as well as additional information e.g. flow visualizations. Correlation between 4D-flow and spleen volume indicate that 4D-flow could provide markers for early portal hypertension.
Introduction
Non-alcoholic fatty liver disease (NAFLD) is the most common chronic liver disease in the world. Patients with NAFLD are at risk of developing fibrosis, i.e. excessive accumulation of extracellular matrix. Liver fibrosis can progress to cirrhosis, ultimately leading to portal hypertension, with the risk of liver decompensation (e.g. development of ascites and esophageal varices) [1]. By assessing the flow conditions in the portal system, early signs of the disease might be detectable. 4D-flow MRI data enables visualization of vascular anatomy and flow patterns (Figure 1) as well as quantification of e.g. flow volumes through the blood vessels in a single acquisition [2]. Other causes of portal hypertension are stiffened liver, which can be assessed by Magnetic Resonance Elastography (MRE) [3] and that the size of the spleen increases [4], a possible proxy of liver fibrosis. The aim of this study is to investigate the correlation between 4D-flow, 2D-flow, MRE, proton density fat fraction (PDFF) and spleen volume.Method
MR-AcquisitionNine NAFLD-patients, and six healthy subjects underwent an MRI examination during fasting conditions, 3 T (Philips Ingenia, the Netherlands).
MRE-data where acquired in four slices according to a conventional protocol [5], using a research SE-based pulse sequence: field-of-view (FoV) of 450x405 mm2; matrix, 76x66 (reconstructed to 320); slice thickness, 10 mm; EPI single shot SE with repetition time (TR) 1000 ms and echo time (TE) 54 ms, fat suppression, using an acoustic transducer at 60 Hz with a weight-based adjustment of amplitude (Resoundant, Rochester, MN), acquisition time (TA) during one breath hold of 13 s.
4D-flow data was acquired in a volume positioned over the central part of the liver. FoV, 300x300 mm2; matrix, 100x100 (reconstructed to 112); 45 slices, thickness 3 mm; retrospective cardiac triggering; k-space segmentation factor, 3; reconstructed into 40 phases, navigator respiratory gated, compressed sensing factor 8, TR/TE 5.1/3.4 ms, flip angle 5°, VENC 50 cm/s, TA ~4 minutes.
2D-flow data were acquired in a plane positioned in height with the portal vein. FoV, 300x248 mm; matrix 120x97 (reconstructed to 256); slice thickness, 8.0 mm; retrospective cardiac triggered, phase contrast imaging in one direction, TR/TE 4.6/3.0 ms, flip angle 10°, VENC 50 cm/s, TA during breath hold of 15 s.
The mDixon acquisition covered the whole liver, FoV of 400x350 mm2, matrix 160x140 (reconstructed to 192); slice thickness, 6 mm (reconstructed into 3mm); gradient multi echo; TR/TE1/delta TE, 5.7/0.97/0.7 ms, 16 s TA during one breath hold.
Post processing
Both 4D- and 2D-flow data were post processed and analyzed using software GTFlow (GyroTools LLC, Zürich, Switzerland). Background correction was applied by fitting a first order polynomial through the phase of static tissue. Regions of interest (ROI) covering the cross section of the portal vein were manually drawn in 2D-flow images and registered onto the corresponding 4D-flow volumes.
Average flow (AF), flow volume (FV), Peak flow (PF) and peak velocity (PV) were calculated through the ROI. Max velocity was defined as the maximum velocity in a single voxel within the ROI. MRE elastograms were derived by using the scanner integrated software and ROIs were drawn by an experienced radiologist, according to recommended routines to avoid vessels, bile ducts and hot spots [5]. A proxy for spleen volume was determined from mDixon images by measuring three dimensions [6] by an experienced radiologist.
Results
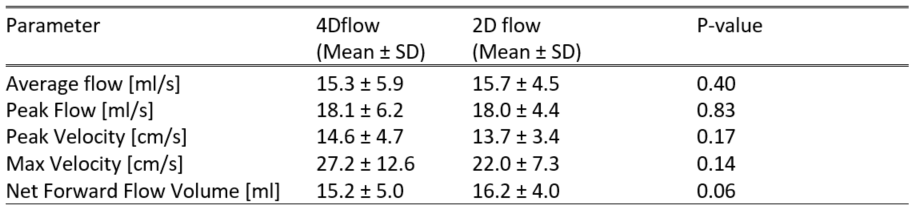
A total of 15 subjects successfully underwent an MRI examination. There was no significant difference when testing pairwise AF, PF, PV and FV from 2D- and 4D-flow (Table 1). The correlation between 4D and 2D acquisitions were strong: AF (R2=0.912), PF (R2=0.896), PV (R2 = 0.713) and FV (R2=0.857) (Figure 2). Correlation between 4D acquisitions and spleen volume was observed for AF (R2=0.526) and PF (R2 = 0.437), but not for PV (R2=0.010) and FV (R2=0.066) (Figure 3). No correlation between 4D-flow and MRE or PDFF was observed (Figure 4).Discussion
In this pilot sub study of a large cohort of NAFLD-patients and healthy subjects, multimodal MR-data were acquired, including MRE, 4D- and 2D-flow, PDFF as well as spleen volume. 4D-flow that ensured coverage of the entire hepatic volume, enable retrospective free positioning of planes for volume flow quantification in the entire scanned volume, as opposed to the fixed position and angulation of 2D-flow measurements. We found a convincing agreement between 4D-measurements and the regular 2D-flow, in the selected position. In an affected patient population, alteration in flow properties such as peak velocities and peak flow, are particularly interesting measures as a liver, stiffened by fibrosis, may gain access to a timely and early disease detection, using the flow associated measures. These observations are of particular interest as the patients included in this study were affected by mild disease only. Enlarged spleen can indicate portal hypertension. 4D-flow correlated with spleen volume, which indicate that 4D-flow could provide markers for early portal hypertension.Conclusion
2D-flow results were successfully extracted from 4D-flow data, showing good match with 2D-flow, indicating that 4D-flow provides the opportunity to both provide regular flow values as well as additional information e.g. flow visualizations. Correlation between 4D-flow and spleen volume indicate that 4D-flow could provide markers for early portal hypertension.Acknowledgements
No acknowledgement found.References
- Møller S, Bendtsen F (2018) The pathophysiology of arterial vasodilatation and hyperdynamic circulation in cirrhosis. Liver Int 38:570-580
- Roldán-Alzate A, Francois CJ, Wieben O, Reeder SB (2016) Emerging applications of abdominal 4D flow MRI. AJR American journal of roentgenology 207:58
- Ehman RL (2022) Magnetic resonance elastography: from invention to standard of care. Abdominal Radiology 47:3028-3036
- Berzigotti A, Seijo S, Arena U et al (2013) Elastography, spleen size, and platelet count identify portal hypertension in patients with compensated cirrhosis. Gastroenterology 144:102-111.e101
- Committee QMB (2022) MR Elastography of the Liver, Quantitative Imaging Biomarkers Alliance. Profile Stage: Technically Confirmed. Available via https://qibawiki.rsna.org/images/5/54/MRE-QIBAProfile-2022-02-14-TECHNICALLY-CONFIRMED.pdf
- Prassopoulos P, Daskalogiannaki M, Raissaki M, Hatjidakis A, Gourtsoyiannis N (1997) Determination of normal splenic volume on computed tomography in relation to age, gender and body habitus. European Radiology 7:246-248
Figures
Table
1. Flow parameters acquired from 4D-flow and 2D-flow. Pairwise comparisons by Students' t-tests for 2D- vs 4D-flow characteristics. No significant differences were seen.
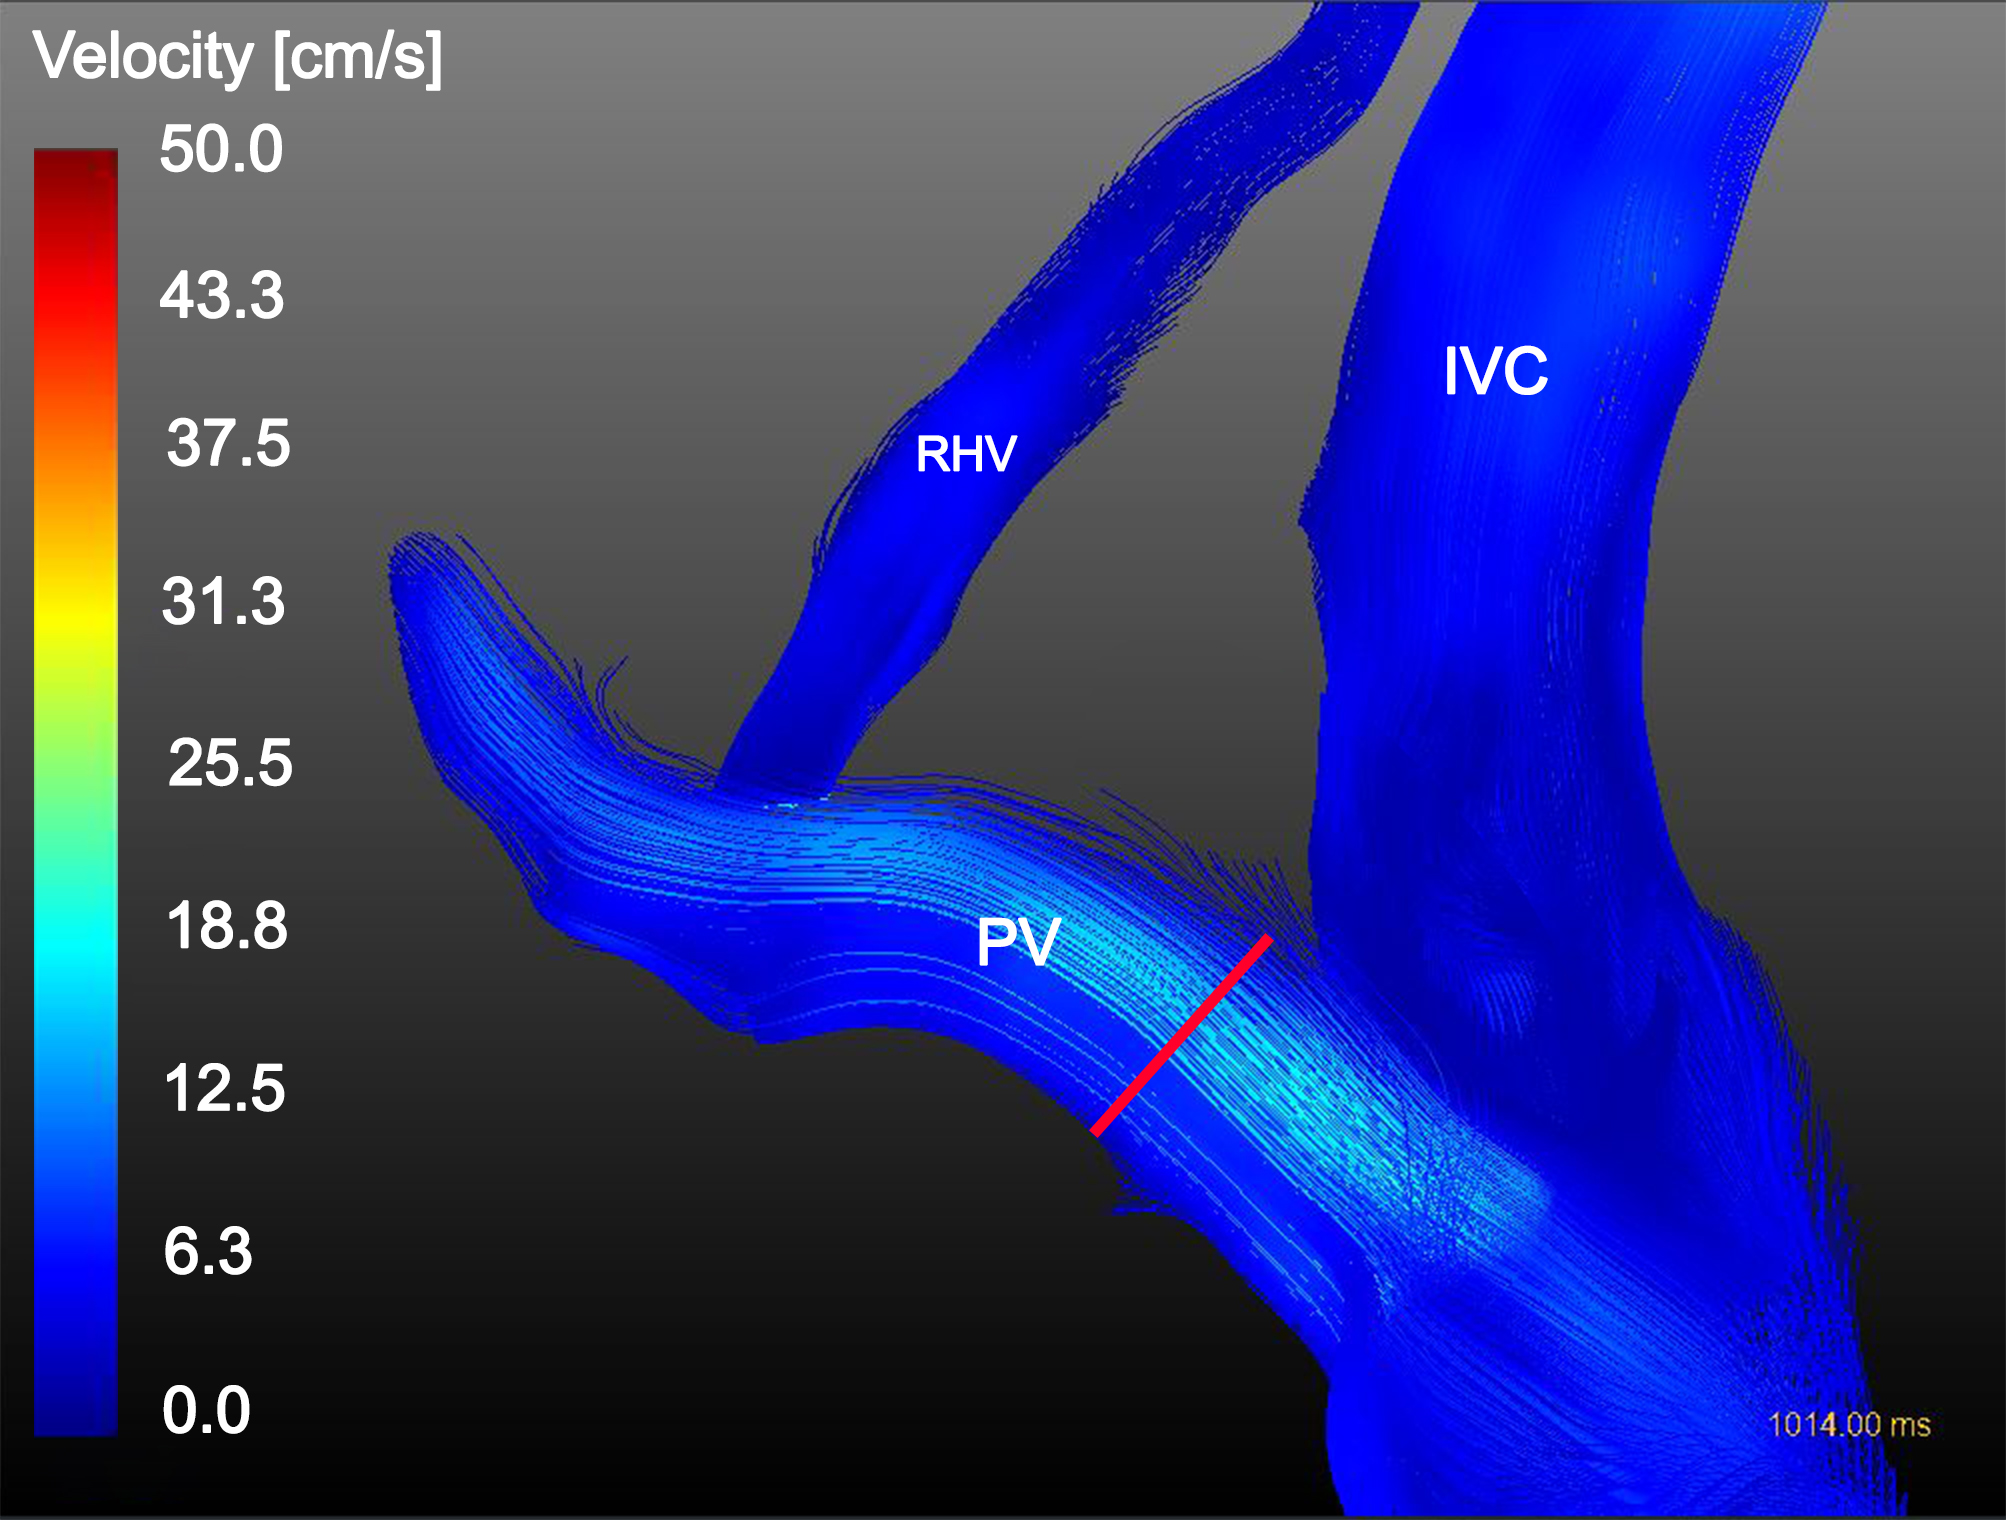
Figure 1. Streamline visualization of blood flow in the portal vein (PV), right hepatic vein (RHV) and inferior vena cava (IVC) with registered ROI from 2D flow acquisition (red marker).
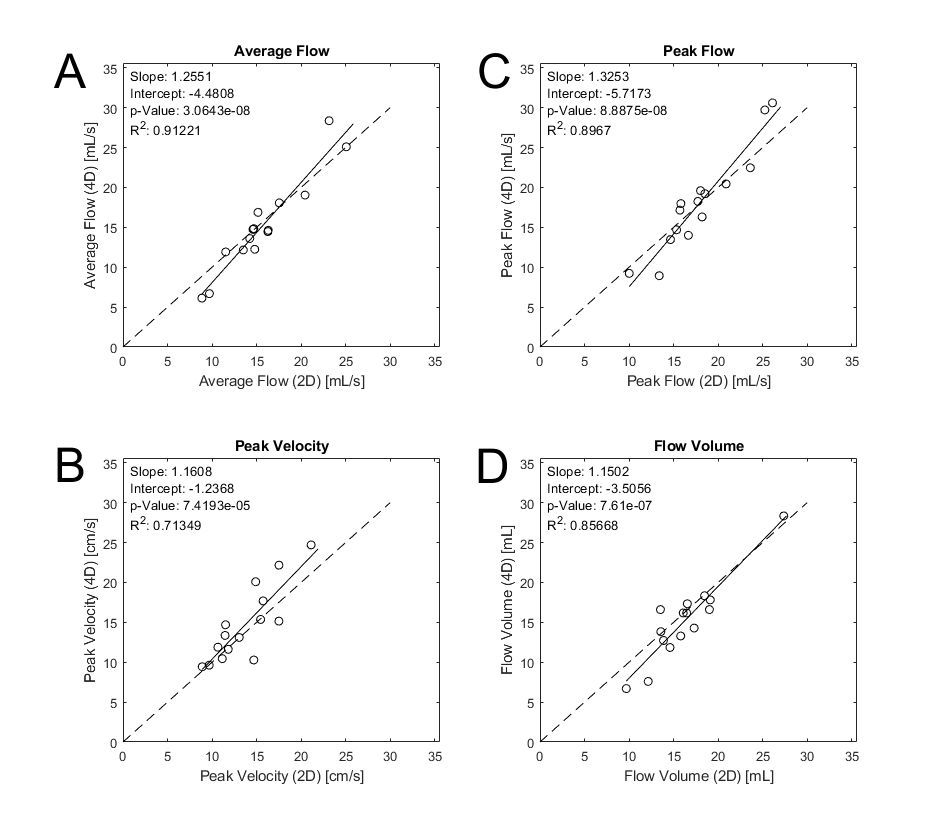
Figure 2. Scatter plots of 4D vs 2D acquisitions. Strong correlation was observed for average flow (A), peak velocity (B), peak flow (C) and flow volume (D).
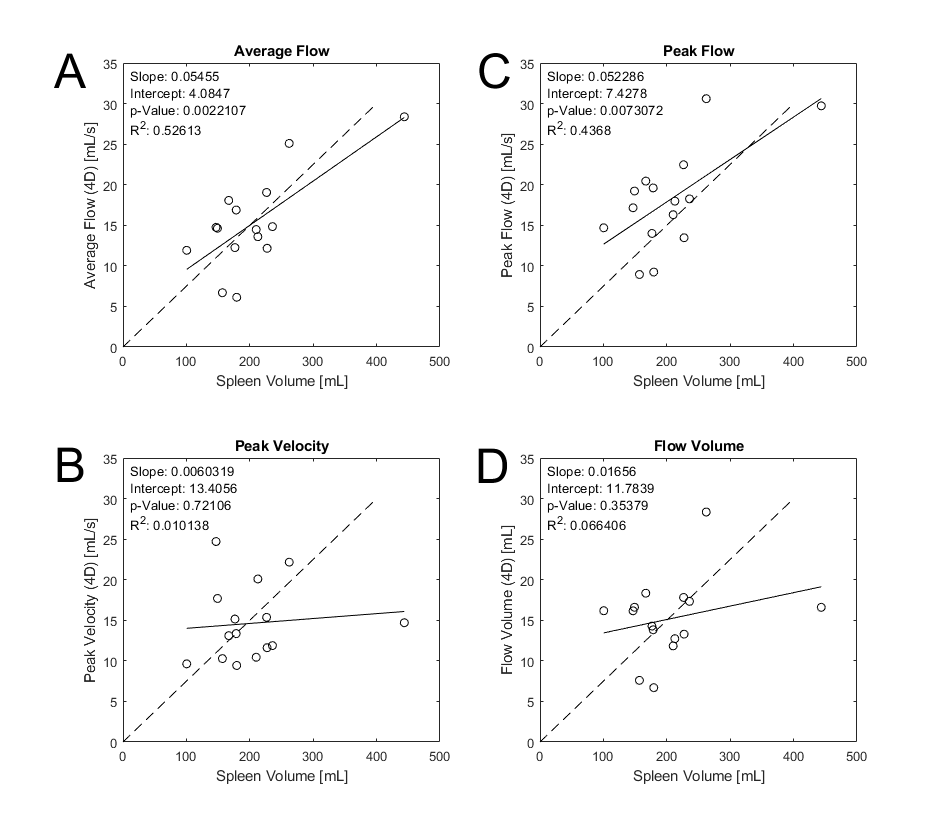
Figure 3. Scatter plots of 4D-flow parameters vs spleen volume. Correlation with spleen volume was observed for average flow (A) and peak flow (C). No correlation observed for peak velocity (B) or flow volume (D).
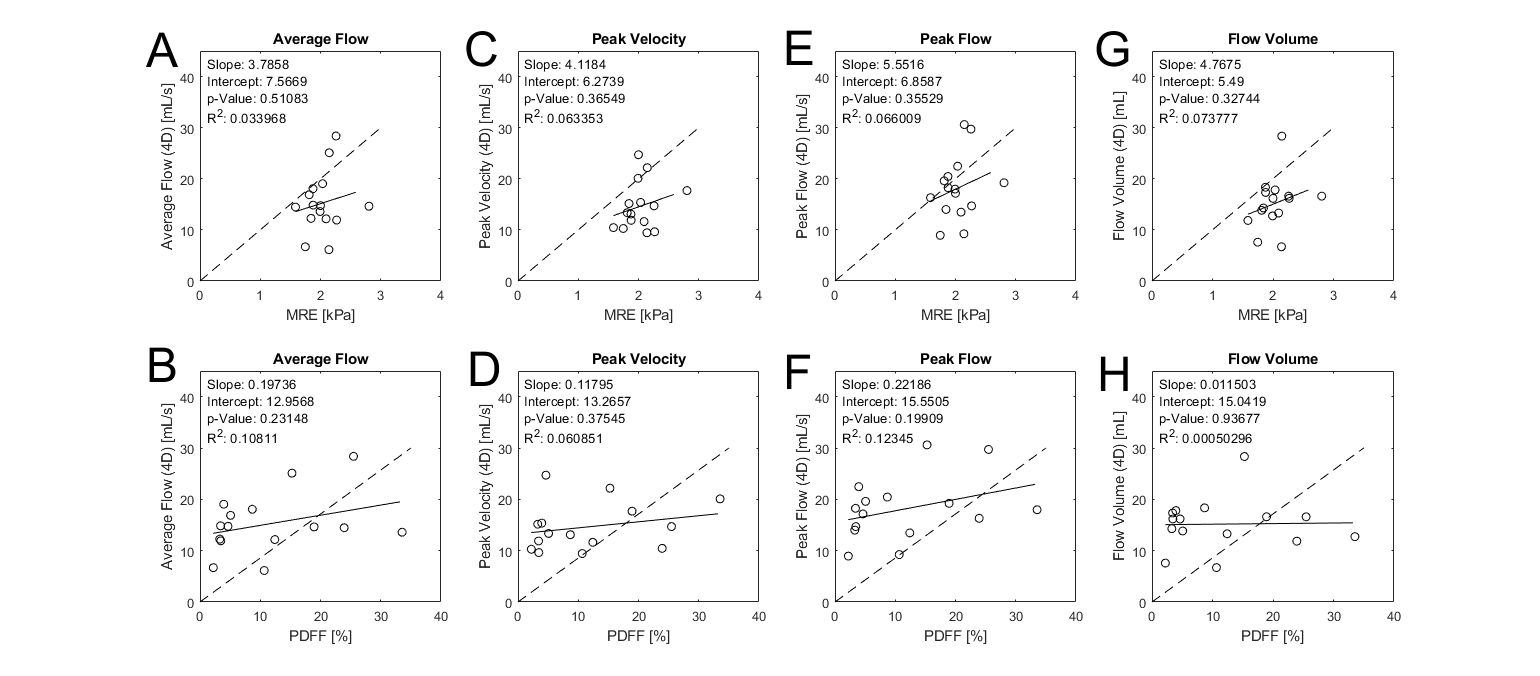
Figure 4. Scatter plots of 4D flow parameters vs MRE and PDFF. No correlation observed for flow parameters vs MRE stiffness (A, C, E and G) or flow parameters vs PDFF (B, D, F and H).
DOI: https://doi.org/10.58530/2023/2052