2051
Performing Quality Control of your MRI Liver Fat/Iron Quantification Studies: A Critical Requirement1Radiology and Imaging Sciences, Emory University, Atlanta, GA, United States
Synopsis
Keywords: Liver, Quantitative Imaging, Quality Control
Liver fat/iron quantification with MRI is essential for detection of iron/fat overload that can lead to NAFLD and cirrhosis. The two widely used tools for this purpose are chemical shift-encoded MR sequences and HISTO. Both methods can fail due to various preventable technical factors. We analyzed various quality factors of technical acceptability for these studies and determined that >25% of all quantification studies performed over six months at our institution were technically unacceptable or had data handling errors. We then developed a checklist for MR technologists to confirm acceptability of the study and decrease potential errors before sending for interpretation.Purpose
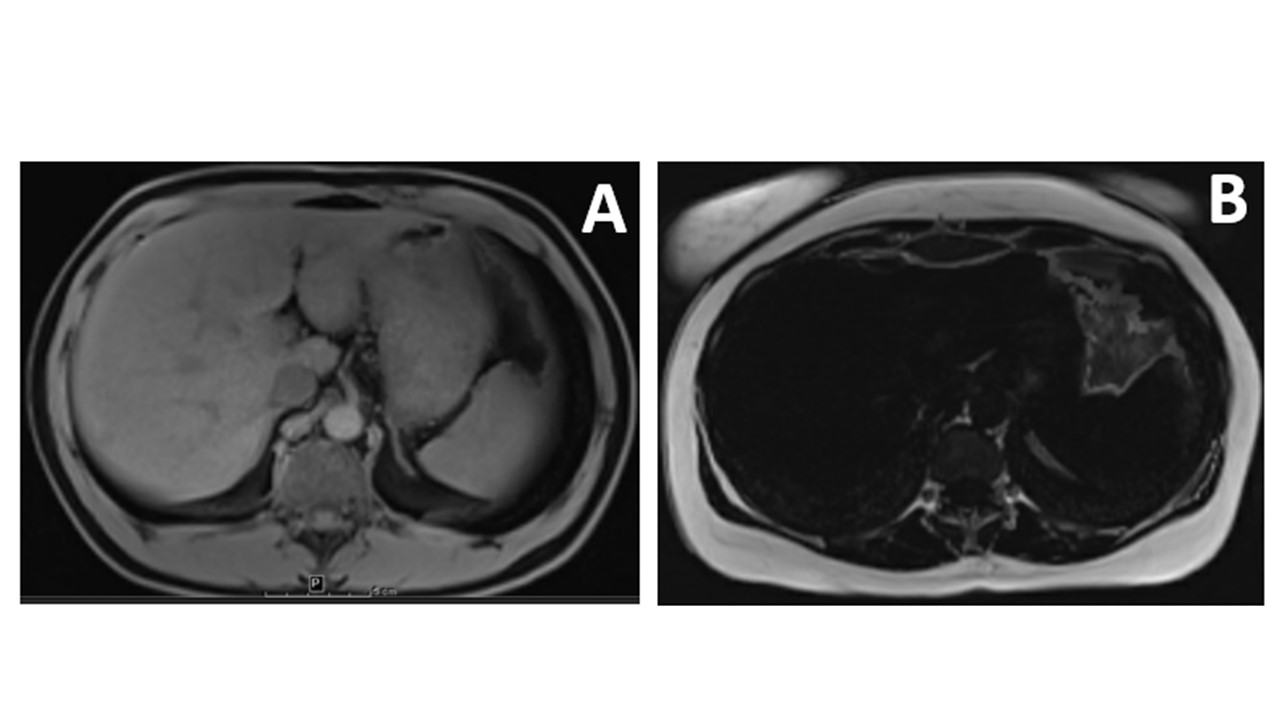
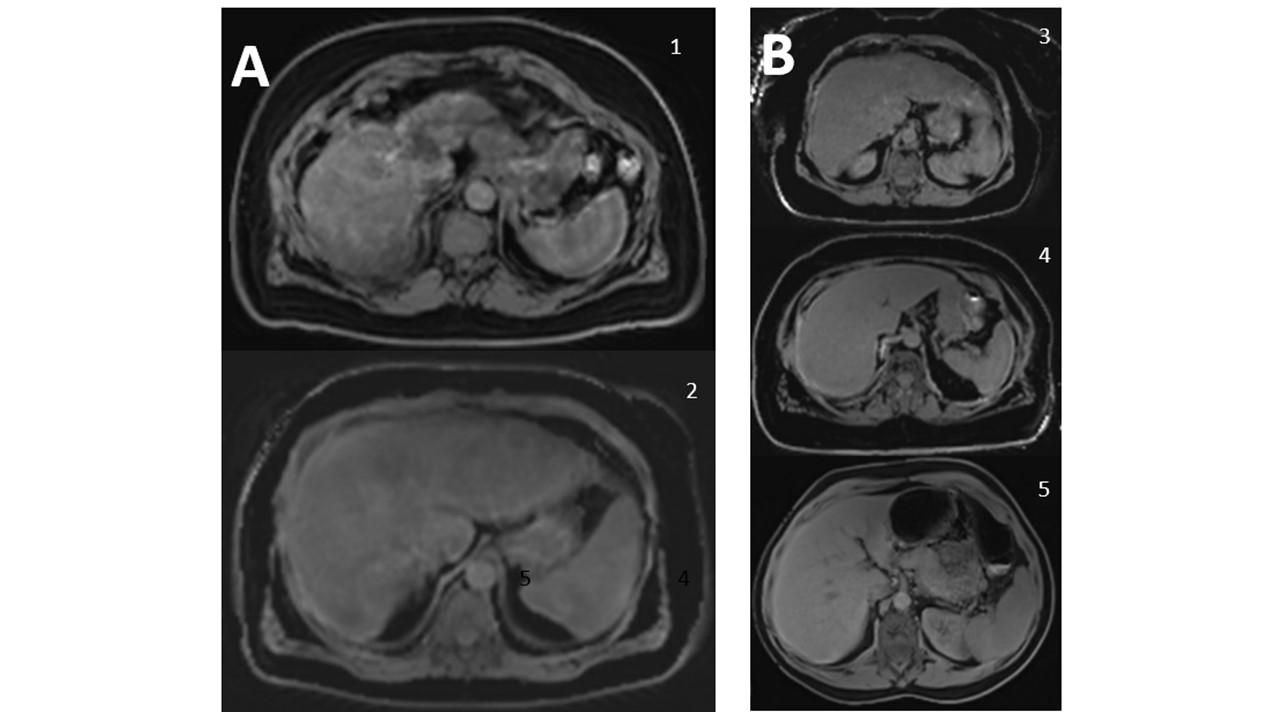
MR quantification studies require specific technical adequacy control for clinical use as they can be prone to errors such as fat-water swap1, liver truncation, other artifacts2 (aliasing3, ringing4), and motion artifact causing blurring, ghosting, and signal voids.1-5 We aimed to assess the technical acceptability of the MR liver fat and iron quantification studies and to develop a formal training and quality improvement program at our institution for these studies, if necessary.Methods
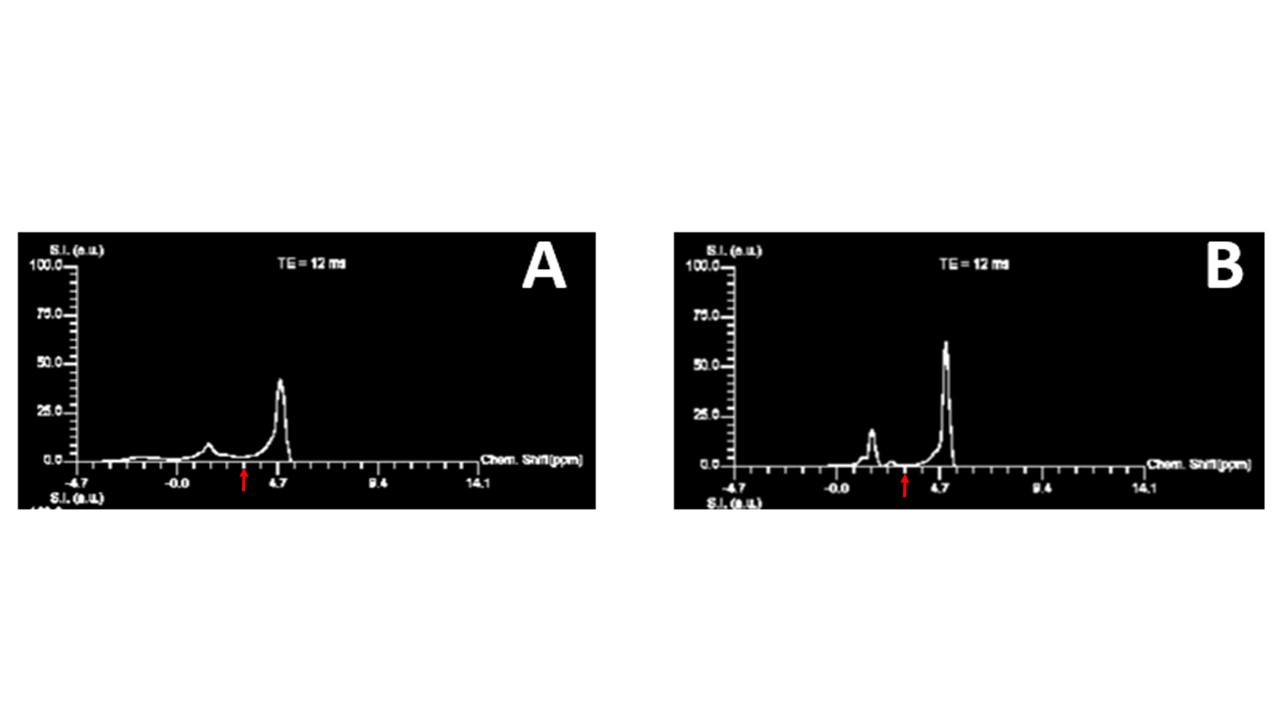
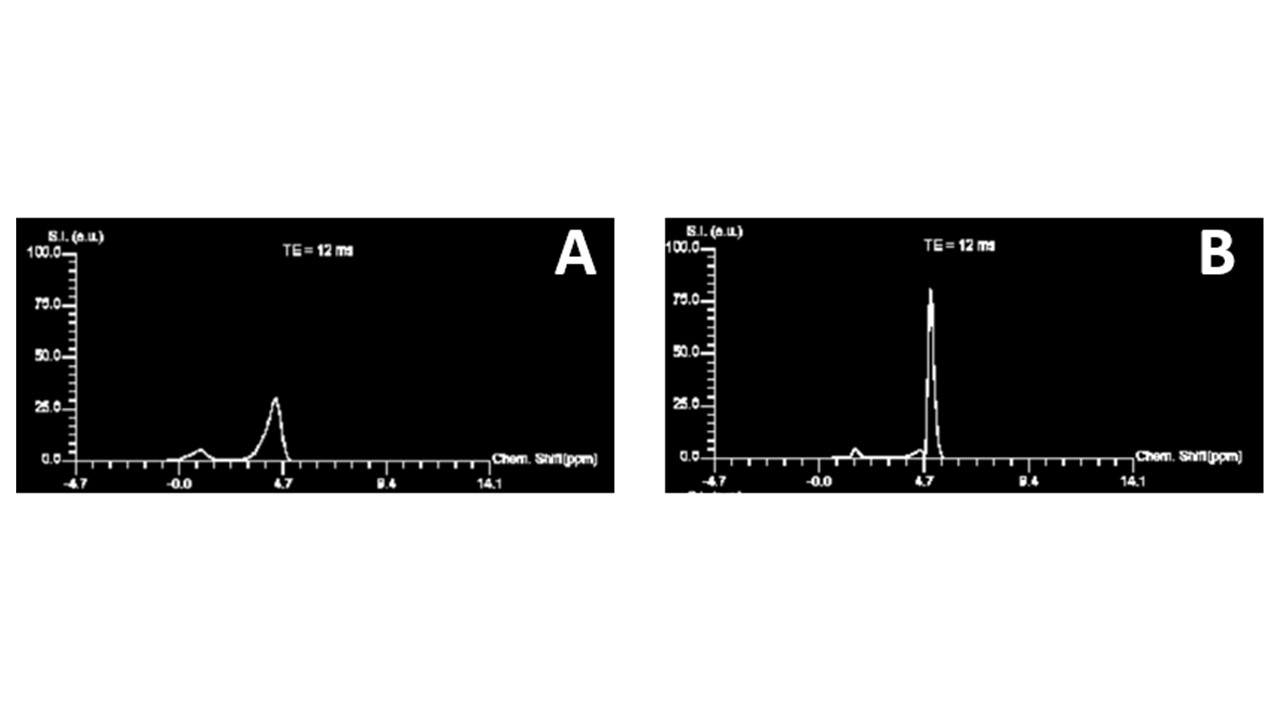
IRB waived retrospective quality improvement review of 87 fat/iron MR studies performed over a six-month period were evaluated. Technical acceptability/unacceptability for chemical shift encoded MR sequences (q-Dixon and IDEAL-IQ) included data handling errors (missing maps), full versus truncated liver coverage, insignificant vs significant fat/water swap, motion or other artifacts resulting in a technically unacceptable study. Similarly, data handling (missing table/spectroscopy), curve fit, separation of fat and water peaks and sharpness of water-peak were evaluated for HISTO technical acceptability.Results
Data handling errors were found in 11% (10/87) of studies performed with missing maps or entire sequence (HISTO or q-Dixon). 27% (23/86) of the q-Dixon/IDEAL-IQ were technically unacceptable (liver-field truncation (39%), other artifacts (35%), significant/severe motion (18%), global fat/water swap (4%), and multiple reasons (4%). 28% (21/75) of HISTO sequences were unacceptable (water-peak broadness (67%), poor curve-fit (19%) overlapping fat and water peaks (5%), and multiple reasons (9%)). Of the CSE-based acquisitions identified as unacceptable, 96% (22/23) were not recognized by the technologist as requiring a repeat acquisition. In 1 study, the acquisition was correctly identified as unacceptable (liver coverage) and repeated appropriately. Of the HISTO acquisitions identified as unacceptable, 86% (18/21) were not recognized by the technologist as requiring repeat acquisition. Three HISTO acquisitions were repeated with two of them being technically acceptable upon final repetition.Conclusions
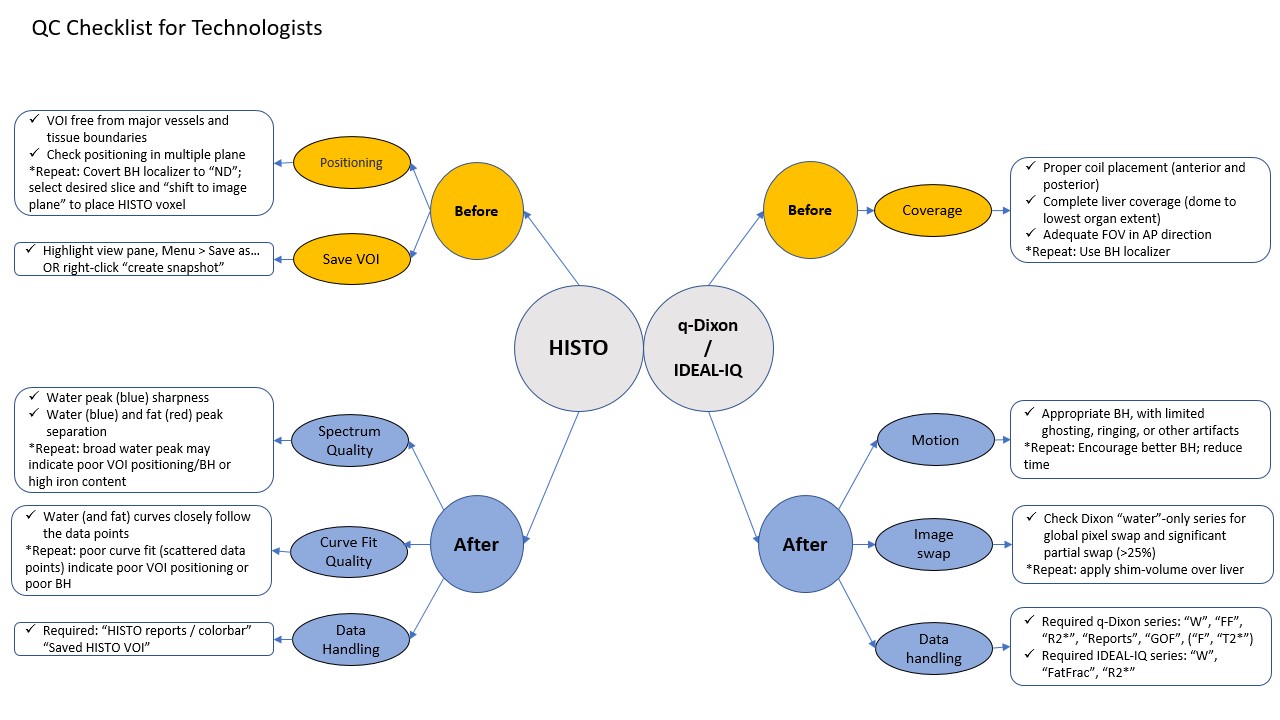
A high rate of preventable errors in fat/iron MR quantification studies indicate the need for routine quality improvement evaluation of technologist performance and technical deficiencies that may exist within a radiology practice. A potential solution entails the development and implementation of a targeted checklist for technologists during each acquisition procedure to ensure acceptability before sending for interpretation (Figure 5). Future studies may demonstrate its efficiency in improving these acquisitions.Acknowledgements
No acknowledgement found.References
1. Kirchgesner T, Acid S, Perlepe V, Lecouvet F, Vande Berg B. Two-point Dixon fat-water swapping artifact: lesion mimicker at musculoskeletal T2-weighted MRI. Skeletal Radiol. 2020;49(12):2081-2086. doi:10.1007/s00256-020-03512-x
2. Zhuo J, Gullapalli RP. MR artifacts, safety, and quality control. Radiographics. 2006;26(1):275-297.
3. Pusey E, Yoon C, Anselmo ML, Lufkin RB. Aliasing artifacts in MR imaging. Comput Med imaging Graph Off J Comput Med Imaging Soc. 1988;12(4):219-224. doi:10.1016/0895-6111(86)90003-0
4. Kellner E, Dhital B, Kiselev VG, Reisert M. Gibbs-ringing artifact removal based on local subvoxel-shifts. Magn Reson Med. 2016;76(5):1574-1581. doi:10.1002/mrm.26054
5. Barish MA, Jara H. Motion artifact control in body MR imaging. Magn Reson Imaging Clin N Am. 1999;7(2):289-301.
Figures