2049
MR-based segmental quantification of hepatic lipid content in patients with suspected iron overload1Diagnostic and Intervnetional Radiology, Ulm University, Medical Center, Ulm, Germany, 2Section for Experimental Radiology, Ulm University, Medical Center, Ulm, Germany, 3Department of Pediatrics and Adolescent Medicine, Ulm University, Medical Center, Ulm, Germany, 4MRI Development, Siemens Healthcare GmbH, Erlangen, Germany
Synopsis
Keywords: Liver, Fat, segmental hepatic fat distribution
Purpose
To investigate the segmental distribution of hepatic fat fraction in hematologic patients.
Methods
The liver of 44 patients examined with 3D MR multi-echo gradient-echo was segmented semiautomatically and subdivided into nine segments. Segmental fat content was determined on PDFF maps and tested for statistically significant differences.
Results
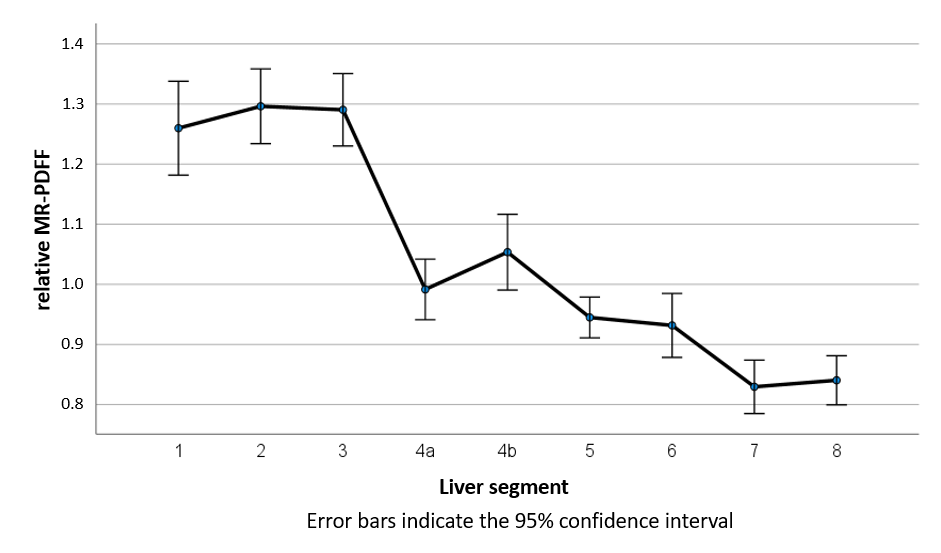
Highly significant differences were detected. Segments 1 to 3 had the highest fat content, segments 7 and 8 the lowest.
Conclusions
Our results suggest that liver segments may represent functional aspects in fat metabolism and/or storage in addition to their anatomical significance. Fat distribution in hematologic patients was similar to living donors.
Purpose
The objective of this work was to evaluate the segmental distribution of hepatic MRI proton density fat fraction (PDFF) in hematological patients with suspected iron overload based on volumetric MRI data.Methods
44 patients (24 m, 20 f, age 23.7 ± 13 years (mean ± SD), age range 4.1 to 60.6 years) were examined in a 1.5 T MRI scanner (MAGNETOM Avanto, Siemens Healthcare, Erlangen, Germany) with a volumetric multi-gradient echo sequence (6 echos, TEs 1.2-9 ms) as previously published1,2. A multiecho 3D gradient-echo sequence was used to acquire the entire liver in a single breath hold. Immediately after data acquisition, voxel-by-voxel PDFF and R2* values were obtained using a nonlinear multi-step fit process and stored as a parameter map.Liver segmentation was performed using the LiverHealth® software tool, a part of the IntelliSpace Portal (ISP, Philips, Hamburg, Germany), which was described previously1,2. The liver contour on axial slices as well as coronal and sagittal reconstructions was checked after an initial automatic segmentation and corrected if necessary. Subsequently, the liver was subdivided into segments using manually placed anatomical landmarks. We used the subdivision according to Couinaud/Bismuth with a total of 9 segments with differentiation of segment 4 into 4a and 4b. The landmarks required by the software for the segment division were: right portal bifurcation, inferior vena cava, right and middle hepatic vein, umbilical fissure, left portal bifurcation, left hepatic apex, superficial venous ligament, attachment of venous ligament to portal vein, and attachment of venous ligament to vena cava. Mean PDFF values were stored for the whole liver and for the individual segments.
PDFF values of the segments were normalized by dividing each segmental value by the PDFF value of the whole liver. Segmental PDFF and the normalized, or relative, PDFF values (rFF) were averaged segment by segment over all patients and tested for differences between the segments.
All statistical analyses were done using SPSS software (version 27.0, IBM, Armonk/NY, USA). All variables were initially tested for normal distribution using the Shapiro-Wilk test. The relative values rFF of the individual segments were tested for statistically significant differences using analysis of variance with repeated measures (ANOVA) and Bonferroni correction. The test for variance homogeneity required for ANOVA was performed using Mauchly's test followed by Greenhouse-Geisser's epsilon factor correction.
Significance levels for statistical analyses were set to p < 0.05 for significant and p < 0.01 for high significant differences.
Results
Our patient cohort contained 24 thalassemia patients, additionally 5 with Diamond-Blackfan-Anemia, 4 with primary hemochromatosis, the others include leukemia, other forms of anemia, myelo-dysplastic syndrome and pyruvate kinase deficiency.Whole-liver R2* values ranged from 39.9 and 586.2 s-1, PDFF values from 3.6 to 20% for the whole liver and from 2.9 to 21.1% in individual segments. Relative PDFF values were observed between 0.51 and 1.87.
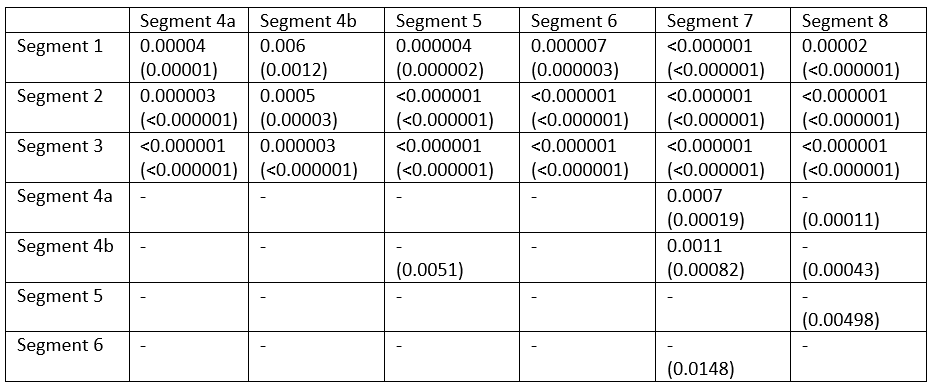
Fig. 1 shows an overview of the rFF values of the individual segments. Highly significant differences were found between segments 1 to 3 (S1-3) on the one hand and S4a-8 on the other. Equally highly significant differences occurred between S4a and S7 and S8. Significant differences were also observed between S4b and S5, S7 and S8, between S5 and S8 as well as S6 and S7. The p-values of the segment-wise differences are shown in Table 1 for rFF and actual MR-PDFF.
Discussion
Liver fat content has been the subject of several publications, but, so far, mainly in patients with lipid metabolic diseases such as nonalcoholic fatty liver disease (NAFLD). Here, we investigated hepatic fat content in a collective of patients with hematologic diseases and iron resorption disorders, the effect of which is primarily liver iron overload as measured by the transverse relaxation rate R2*. R2* distribution deviated from PDFF distribution: R2* is by far lowest in S1 and highest in S71,2.Increased fat storage in the right liver lobe compared to the left liver lobe, i.e. the opposite as described here, has already been reported in several papers, although mostly only whole liver lobes and not the individual segments were examined3,4. Papers that analyzed fat distribution using the Coinaud/Bismuth segmental subdivision in NAFLD patients found lower fat content in S1-3 compared to the others5-7. This finding is remarkable since both conditions, iron overloaded as well as NAFLD, are associated with increased hepatic fat content. The fat fractions in the extended right lobe of the liver (S4-8) reported in these NAFLD papers, however, are comparable to results observed in our patient population, i.e., higher in segment 4 and with a decreasing tendency toward segment 8 with basically similar PDFF values.
A work in healthy living liver donors showed fat fractions comparable to those in our patients, i.e., highest fat content in segments 1-3, but with overall lower PDFF values8. These observations suggest that fat distribution obviously depend on the individual condition, i.e., healthy person or different disease patterns – hematologic vs. lipid metabolic diseases.
Our data support the fact that the division into liver segments includes functional aspects in addition to its purely anatomical basis. Whether this additional insight can also be used in practice, for example, for therapy management, should be investigated in further clinical studies.
Acknowledgements
No acknowledgement found.References
1. Wunderlich A.P., C.H., Kannengießer S., Grunau V., Hering L., Götz M., Beer M., Schmidt S.A. Volumetric evaluation of 3D multi-gradient-echo MRI data to assess whole liver iron distribution by segmental R2* analysis: first experience. RoFo (accepted) (2022).
2. Wunderlich A. P., C.H., Kannengießer S., Grunau V., Götz M., Beer M., Schmidt S.A. 3D multi-echo GRE MRI of the whole liver: First experiences of a volumetric segmental R2* analysis. ISMRM Annual Meeting (London, 2022), 3387.
3. Hua, B., Hakkarainen, A., Zhou, Y., Lundbom, N. & Yki-Järvinen, H. Fat accumulates preferentially in the right rather than the left liver lobe in non-diabetic subjects. Dig Liver Dis 50, 168-174 (2018).
4. Hui, S.C.N., et al. Validation of water-fat MRI and proton MRS in assessment of hepatic fat and the heterogeneous distribution of hepatic fat and iron in subjects with non-alcoholic fatty liver disease. European journal of radiology 107, 7-13 (2018).
5. Bonekamp, S., et al. Spatial distribution of MRI-Determined hepatic proton density fat fraction in adults with nonalcoholic fatty liver disease. JMRI 39, 1525-1532 (2014).
6. Kang, B.K., Kim, M., Song, S.Y., Jun, D.W. & Jang, K. Feasibility of modified Dixon MRI techniques for hepatic fat quantification in hepatic disorders: validation with MRS and histology. Brit Jou Radiol 91, 20170378 (2018).
7. Lee, H., et al. Estimating of hepatic fat amount using MRI proton density fat fraction in a real practice setting. Medicine 96, e7778 (2017).
8. Choi, Y., et al. Heterogeneous living donor hepatic fat distribution on MRI chemical shift imaging. Annals of surgical treatment and research 89, 37-42 (2015).
Figures