2048
Feasibility of fat quantification of in vivo mouse liver at 9.4T1Wuhan United Imaging Life Science Instrument Co., Ltd., Wuhan, China, 2Department of Endocrine and Metabolic Diseases, Shanghai Institute of Endocrine and Metabolic Diseases, Ruijin Hospital, Shanghai Jiao Tong University School of Medicine, Shanghai, China, 3Department of Radiology, Ruijin Hospital, Shanghai Jiao Tong University School of Medicine, Shanghai, China, 4Clinical Neuroscience Center, Ruijin Hospital Luwan Branch, Shanghai Jiao Tong University School of Medicine, Shanghai, China, 5United imaging healthcare, Shanghai, China, 6Institute for medical imaging technology, Department of Radiology, Ruijin Hospital, Shanghai Jiao Tong University School of Medicine, Shanghai, China
Synopsis
Keywords: Liver, Liver
The feasibility of determination of fat in living mouse liver is demonstrated at 9.4T using gradient-echo sequence and the Fat Analysis and Calculation Technique (FACT)—Transition Region Extraction (TREE) algorithm. The proton density fat fraction map is obtained, which is positively correlated with steatosis. The proposed technique is a promising non-invasive tool for diagnosing fatty liver diseases.Introduction
Non-alcoholic fatty liver disease (NAFLD) has become the most common chronic liver disease in the world1,2. In the clinic, MRI is believed to be the most promising method for the quantification of fat in the liver due to its noninvasiveness. The fat quantification technique, fat-water separation, has made great progress in the clinic3–5. However in preclinical research, there are some reports of fat quantification of rats at 3T6, but remains limited at high magnetic fields. In this work, we aimed to evaluate a gradient-echo sequence with a fat-water separation Transition Region Extraction (TREE) algorithm7 on mice at 9.4T, and demonstrated the feasibility of fat quantification of in vivo mouse liver at 9.4T.Methods
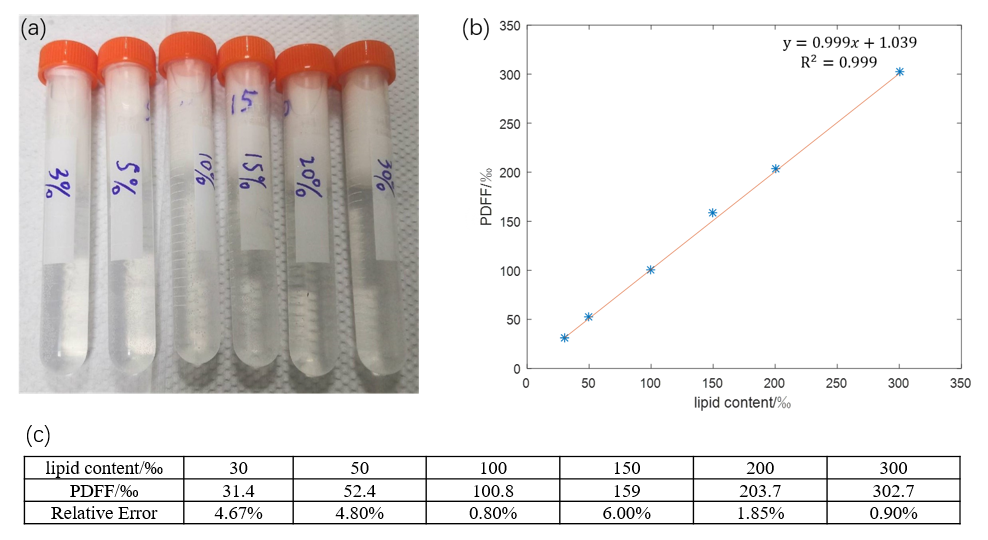
Phantom: To mimic the clinical criteria of healthy liver (e.g. fat content < 5%) from nonalcoholic fatty liver disease (e.g. fat content > 12%)8, a sets of soybean oil-in-water emulsion (Intralipid® 30%) with 3%, 5%, 10%, 15%, 20% and 30% lipid contents9 were prepared and sealed in centrifugation eppendorfs. Then the known lipid solution was immersed in pure water and stored in tubes, as shown in Figure 1a.Animal preparation: All experiments were conducted in accordance with the guidelines of the Institutional Animal Care and Use Committee of Shanghai Jiao Tong University School of Medicine and were approved by the SJTUSM. All 8 male C57BL/6J mice were maintained on a normal chow diet (Slacom, P1101F-25, Shanghai, China) until 8 weeks of age. Then a high-fat diet (HFD) with 60 kcal% fat (5.24 kcal/g, catalog No. D12492, Research Diets Inc., USA) was supplied to 4 mice for 16 weeks and 4 controls (CTRL) mice were further maintained on the normal chow diet. Every mouse was induced anesthesia and maintained using isoflurane for MRI scan thereafter. Throughout the entire procedure, the mouse body temperature was maintained via circulating warm water.
MRI scan: MR experiments were performed in a horizontal 30cm-inner-diameter 9.4T magnet (uMR 9.4T, United Imaging Healthcare, P.R. China) with a gradient insert (a maximum gradient strength at 1000mT/m with a maximum slew rate at 10000T/m/s slew rate). A 2-channel 42-cm inner diameter volume coil was used for transmitting and receiving. After localizers, 3D shimming, and a gradient-echo sequence was performed.
Phantom Parameters of gradient echo (GRE) were: transverse FOV=32mm*30mm, matrix=154*144, slice thickness=2mm, flip angle=5°, TE=1.13/2.32/3.51/4.70/5.89/7.08ms, TR=20ms, bandwidth=1200Hz/pixel, NEX=16.
The in vivo parameters of GRE were: transverse FOV=20mm*32mm, matrix=98*176, slice thickness=1mm, TE=1.52/2.71/3.90/5.09/6.28/7.47ms, TR=30 ms, bandwidth=1200Hz/pixel, NEX=64. Since the known lipid phantoms contains more free water and has higher T1 than that of mouse liver, a slightly larger flip angle, 16°, was used for in vivo experiments to gain SNR with very minimal T1 bias10.
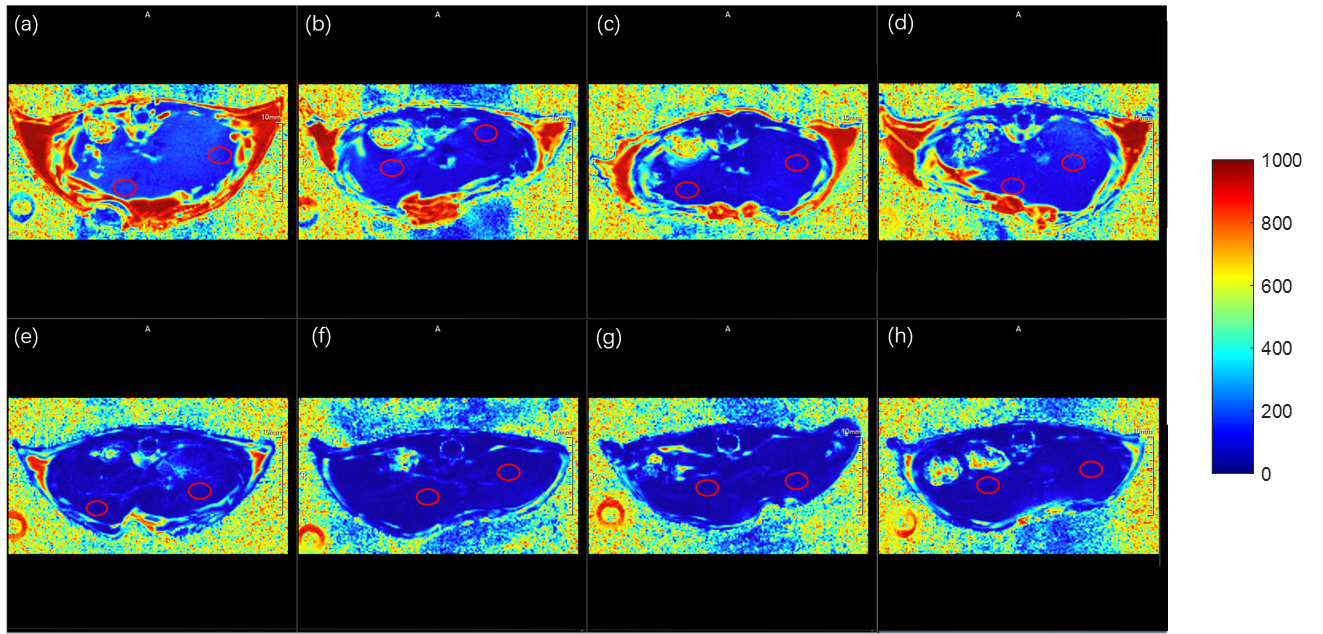
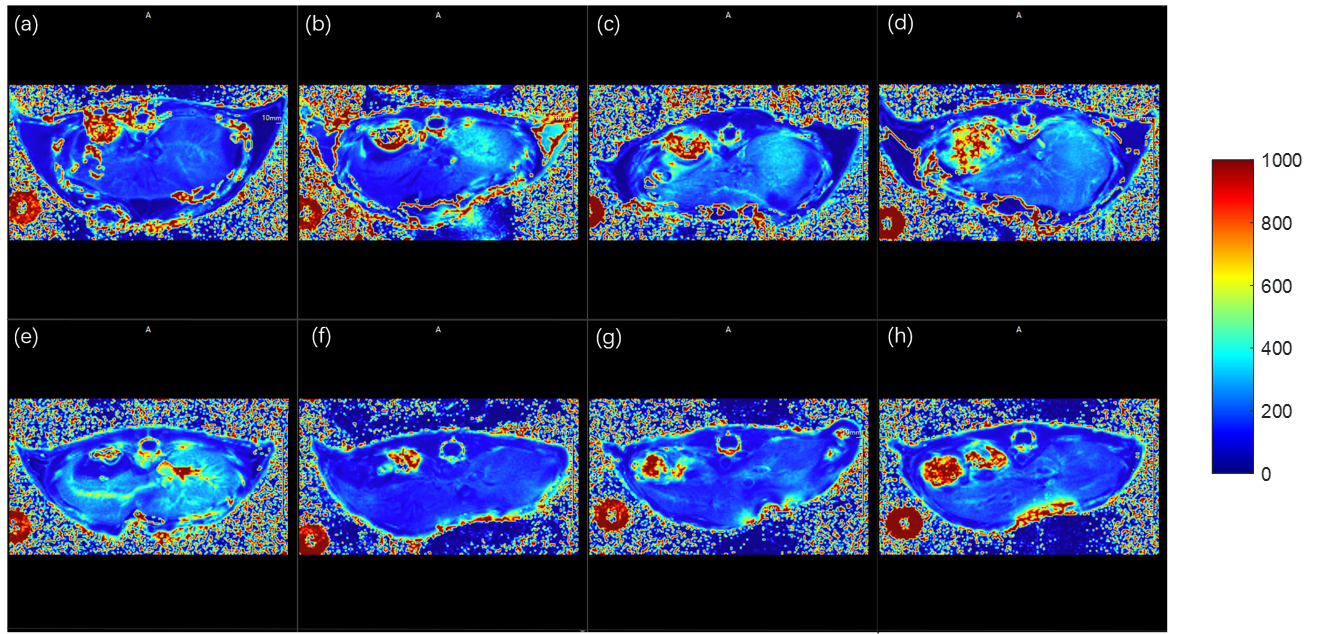
Data Analysis: The multiple GRE images were directly reconstructed by scanners' inline reconstruction pipeline, and further quantification was performed offline with the TREE algorithm which has been shown to be a robust fat-water separation method7. Finally, the proton density Fat Fraction (PDFF) and R2* Map were calculated accordingly. The averaged PDFF value of mouse liver was measured by manually drawing two region-of-interests (ROIs) from both sides of mouse liver for statistics.
Results
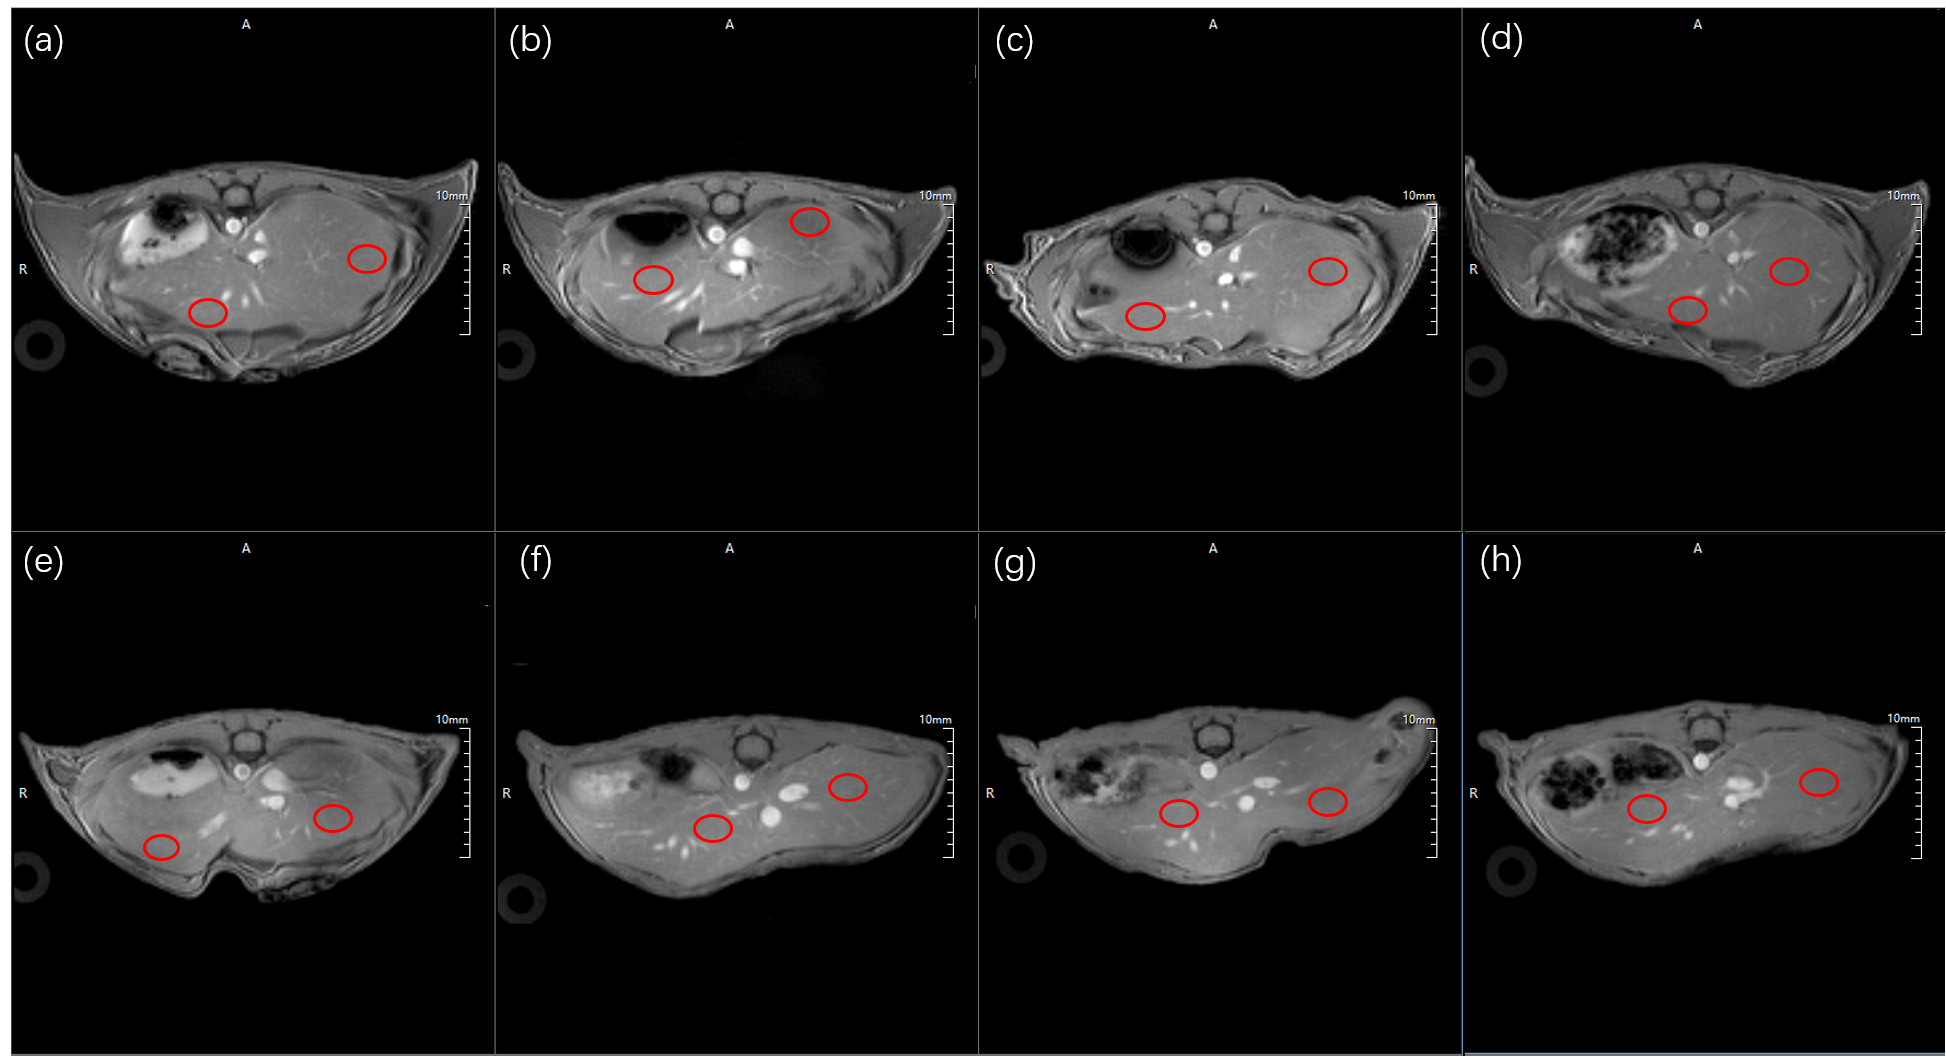
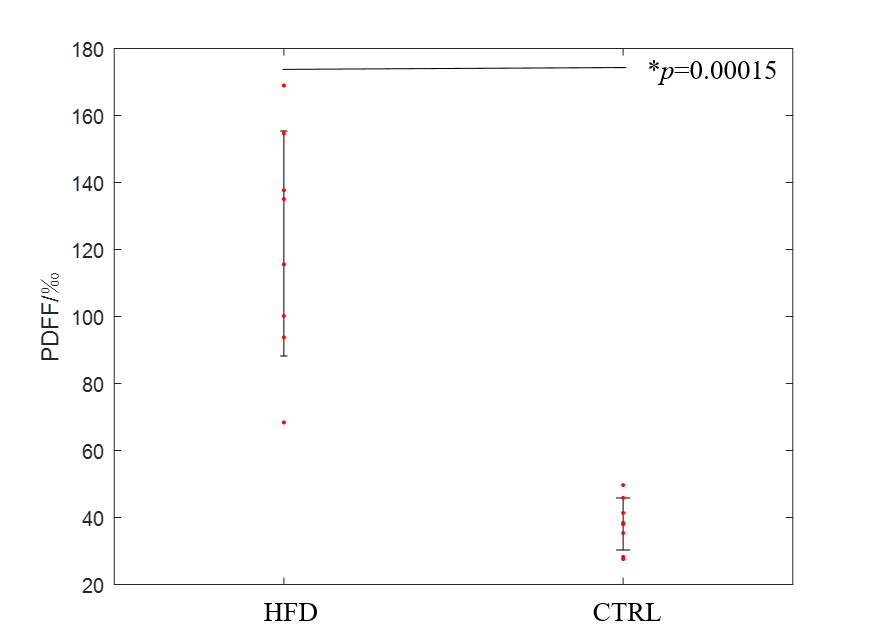
The offline calculated PDFF results using the FACT technique from the prepared lipid phantom (Figure 1a) were summarized in Figure 1c and the PDFF values were nearly correlated in an identical fashion with the known lipid contents, i.e. R2=0.999, as shown in Figure 1b. With the quality GRE images of living mouse liver, the magnitude of the first echo image of mice in Figure 2, the corresponding PDFF and R2* maps of both HFD and CTRL mice with high quality were obtained and shown in Figure 3 and 4. Further statistical analyzing HFD and CTRL results revealed substantial hepatic PDFF difference between groups, as in Figure 5. The MRI results are well consistent with the finding that diet-induced obesity is associated with lipid accumulation in liver11,12.Discussion and Conclusion
The PDFF results of the known lipid-content phantom (Figure 1b and 1c ) suggested that the obtained PDFF from the FACT technique together with the TREE algorithm offers a nearly identical lipid measurement method. Further in vivo studies of HFD and CTRL mice clearly showed the significant difference in their fat contents, i.e. PDFF (p=0.00015, unpaired student ttest), as shown in Figure 5. The slightly increase flip angle used in vivo did not either change the linearity of determination of fat content using the FACT with the TREE algorithm (data not shown), or affect the existing observation of in vivo studies. We demonstrated the feasibility of in vivo fat quantification mapping of mouse liver at ultra-high field 9.4T. The additional R2* Map could provide details in iron contents, which may be applicable for diagnosing other liver diseases. Taking together, MRI fat quantification in mice can be a promising tool for preclinical research in human liver diseases.Acknowledgements
No acknowledgement found.References
1. Feldstein AE, Charatcharoenwitthaya P, Treeprasertsuk S, Benson JT, Enders FB, Angulo P. The natural history of non-alcoholic fatty liver disease in children: a follow-up study for up to 20 years. Gut. 2009;58(11):1538-1544.
2. Eslam M. A new definition for metabolic dysfunction-associated fatty liver disease: An international expert consensus statement. J Hepatol. 2020;73(1):202-209.
3. Glover GH, Schneider E. Three-point dixon technique for true water/fat decomposition with B0 inhomogeneity correction. Magn Reson Med. 1991;18(2):371-383.
4. Xiang QS. Two-point water-fat imaging with partially-opposed-phase (POP) acquisition: An asymmetric Dixon method. Magn Reson Med. 2006;56(3):572-584.
5. Cheng C, Zou C, Liang C, Liu X, Zheng H. Fat-Water Separation Using a Region Growing Algorithm With Self-Feeding Phasor Estimation. Magn Reson Med. 2017;77(6):2390-2401.
6. Wan Q, Peng H, Lyu J, et al. Water Specific MRI T1 Mapping for Evaluating Liver Inflammation Activity Grades in Rats With Methionine‐Choline‐Deficient Diet‐Induced Nonalcoholic Fatty Liver Disease. J Magn Reson Imaging. 2022;56(5):1429-1436.
7. Peng H, Zou C, Cheng C, et al. Fat‐water separation based on Transition REgion Extraction (TREE). Magn Reson Med. 2019;82(1):436-448.
8. Idilman IS, Aniktar H, Idilman R, et al. Hepatic Steatosis: Quantification by Proton Density Fat Fraction with MR Imaging versus Liver Biopsy. Gastrointest IMAGING. 2013;267(3):767-775.
9. Soares AF, Lei H, Gruetter R. Characterization of hepatic fatty acids in mice with reduced liver fat by ultra-short echo time 1H-MRS at 14.1 T in vivo. NMR Biomed. 2015;28(8):1009-1020.
10. Ong HH, Webb CD, Gruen ML, Hasty AH, Gore JC, Welch EB. Fat-water MRI of a diet-induced obesity mouse model at 15.2T. J Med Imaging. 2016;3(2):026002.
11. Lu Y, Liu X, Jiao Y, et al. Periostin promotes liver steatosis and hypertriglyceridemia through downregulation of PPARα. J Clin Invest. 2014;124(8):3501-3513.
12. Lu Y, Ma Z, Zhang Z, et al. Yin Yang 1 promotes hepatic steatosis through repression of farnesoid X receptor in obese mice. Gut. 2014;63(1):170-178.
Figures