2047
In vivo investigation of a Healthy Liver Lipid composition by 2D L-COSY Using 3T1Human Magnetic Resonance Center, University of Massachusetts, Amherst MA, Amherst, MA, United States, 2Radiological Sciences, University of California Los Angeles, Los Angeles, CA, United States
Synopsis
Keywords: Liver, Spectroscopy
In vivo magnetic resonance spectroscopy has the potential to provide information about both the quantity and composition of fat within the liver. We have demonstrated the feasibility of detecting cross peaks using the 2D L-COSY technique at 3T in a healthy liver. This can be used to study fatty liver to derive quantitative indexes.Introduction
Proton (1H) MRS has been evaluated in both research and clinical studies to assess liver fat noninvasively in vivo (1,2). Non-invasive diagnostic techniques for studying hepatobiliary pathology were investigated using MRS (3-5). Fat and water are the most visible peaks in the one-dimensional (1D) MRS liver spectrum obtained from the clinical MR scanners. While water shows a single peak at approximately 4.7ppm, fat shows multiple peaks due to its complex chemical components. Each peak of lipid spectra reflects unsaturated, saturated, monounsaturated, and polyunsaturated fatty acids. The primary advantages of two-dimensional localized correlated spectroscopy (2D L-COSY) over 1D MRS are that connectivity between distinct individual spins is delineated and J-coupled multiplet resonance peaks are spread over two spectral dimensions (6,7). The degree of unsaturation measured noninvasively may serve as a biomarker for lipid metabolic defects associated with pathology. The present study aims to evaluate the use of 2D L-COSY to analyze lipid composition in the liver in a healthy volunteer at 3T.Materials and Methods
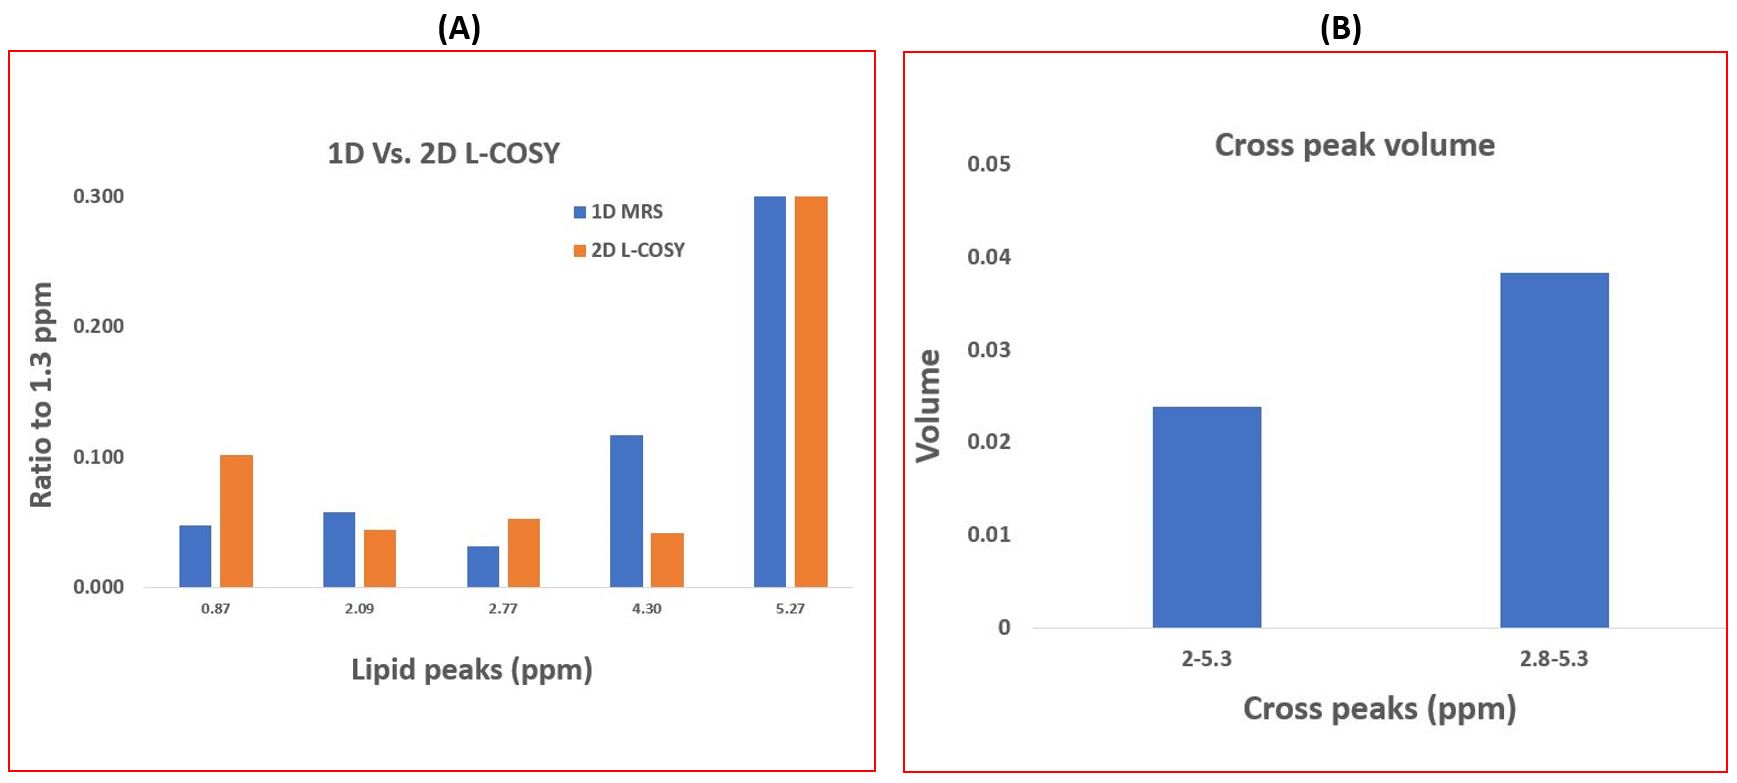
Five healthy volunteers (24.2 ± 3.2 yrs) participated in this study. MRS was performed on a 3T Siemens Skyra scanner using the body coil for excitation, and an 18-channel phased array combined with a spine matrix coil for signal reception. The MRS voxel was positioned in the right hepatic lobe, avoiding the inclusion of the diaphragm and edges of the liver and the vascular and biliary structures. Single voxel 1H MRS was acquired during free-breathing, using a PRESS with the parameters TR 2000 ms, TE 30 ms, spectral bandwidth 2000 Hz, vector size 2048, voxel size 3x3x3cm3 (27cm3) with 128 averages (Scan time 4:30 min). The following parameters were used for 2D L-COSY: TR/TE=2000s/30ms, 3x3x3cm3, 2048 complex points, 8 averages per Δt1 and 64 Δt1 increments (Scan time=17:30min). 1D MRS data were processed using jMRUI and all the metabolites and lipids were quantified using the AMARES non-linear least squares algorithm, and 2D L-COSY data was processed with Felix NMR software. Both 1D PRESS and 2D L-COSY peak integrals/volumes were presented with respect to the 1.3 ppm lipid methylene peak (Fig.4A).Results
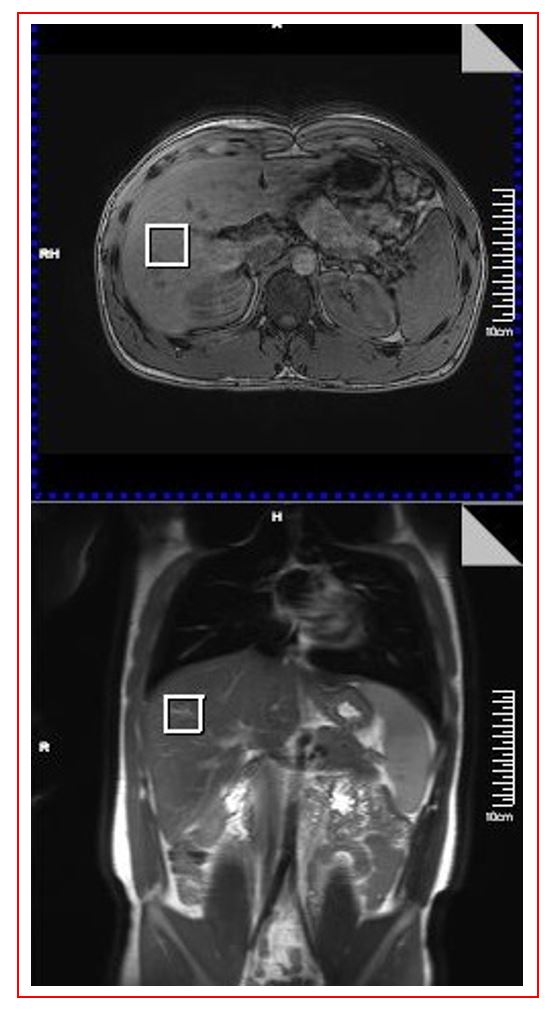
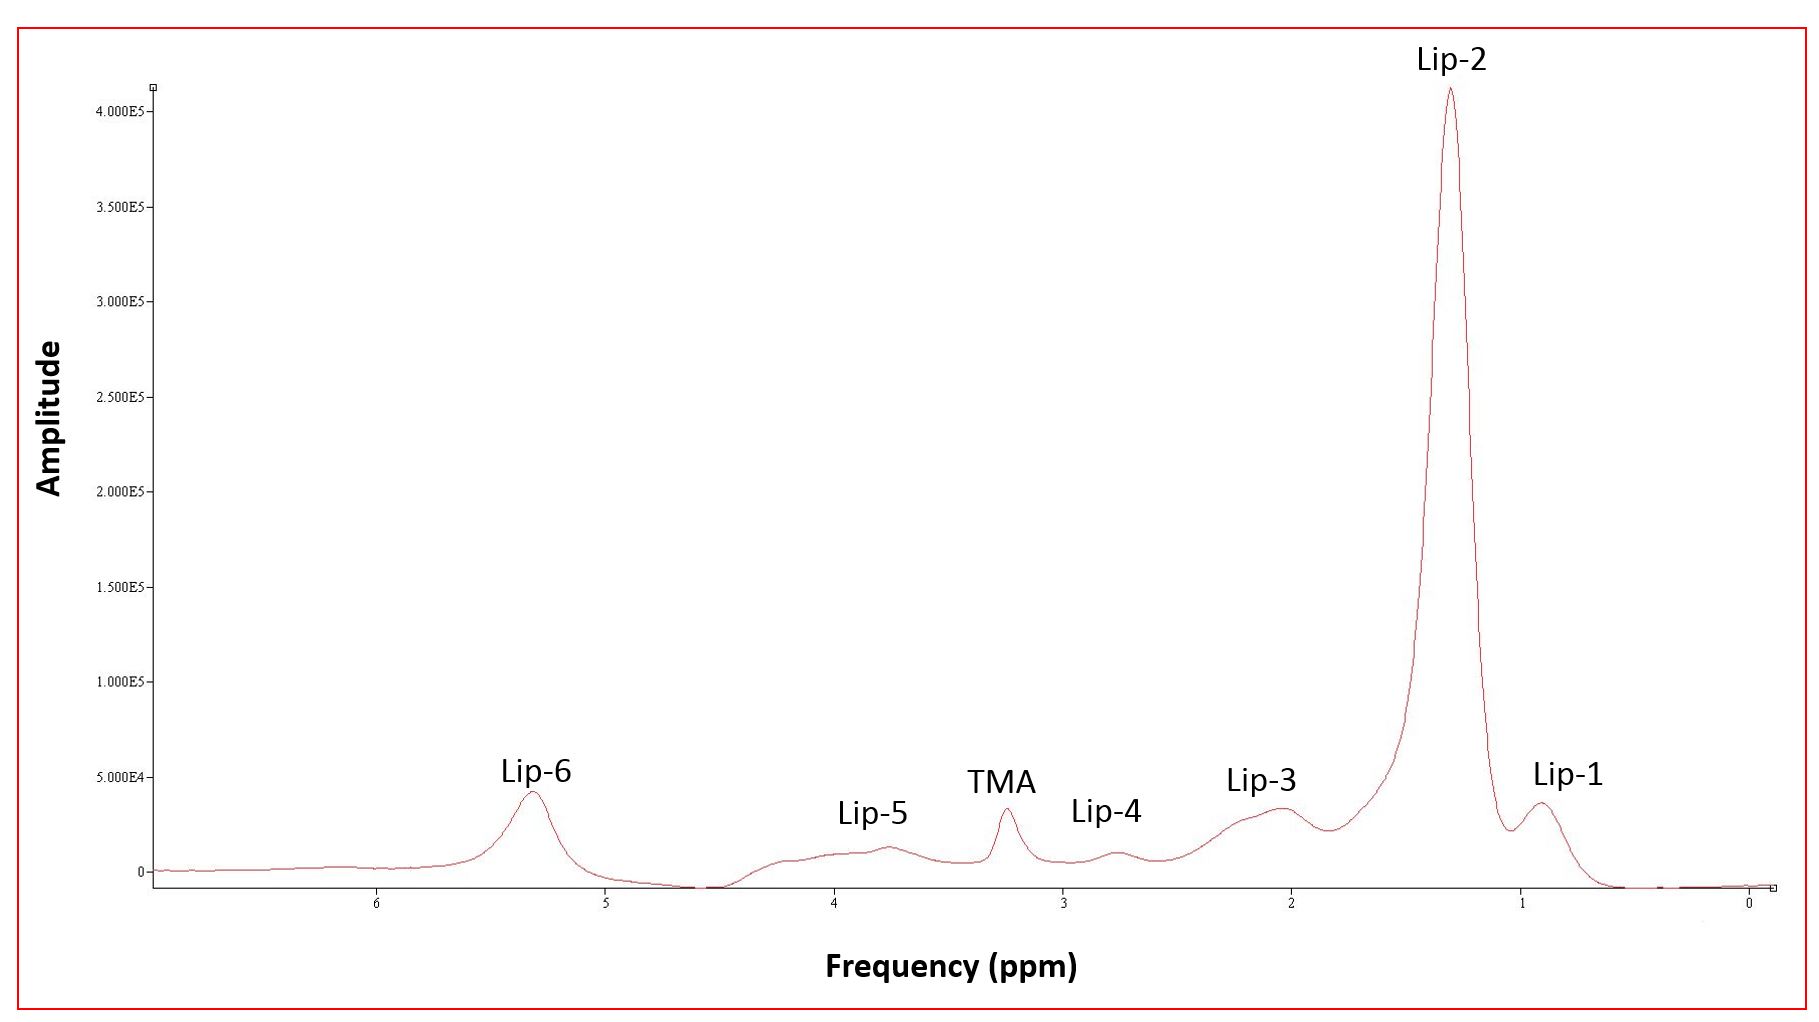
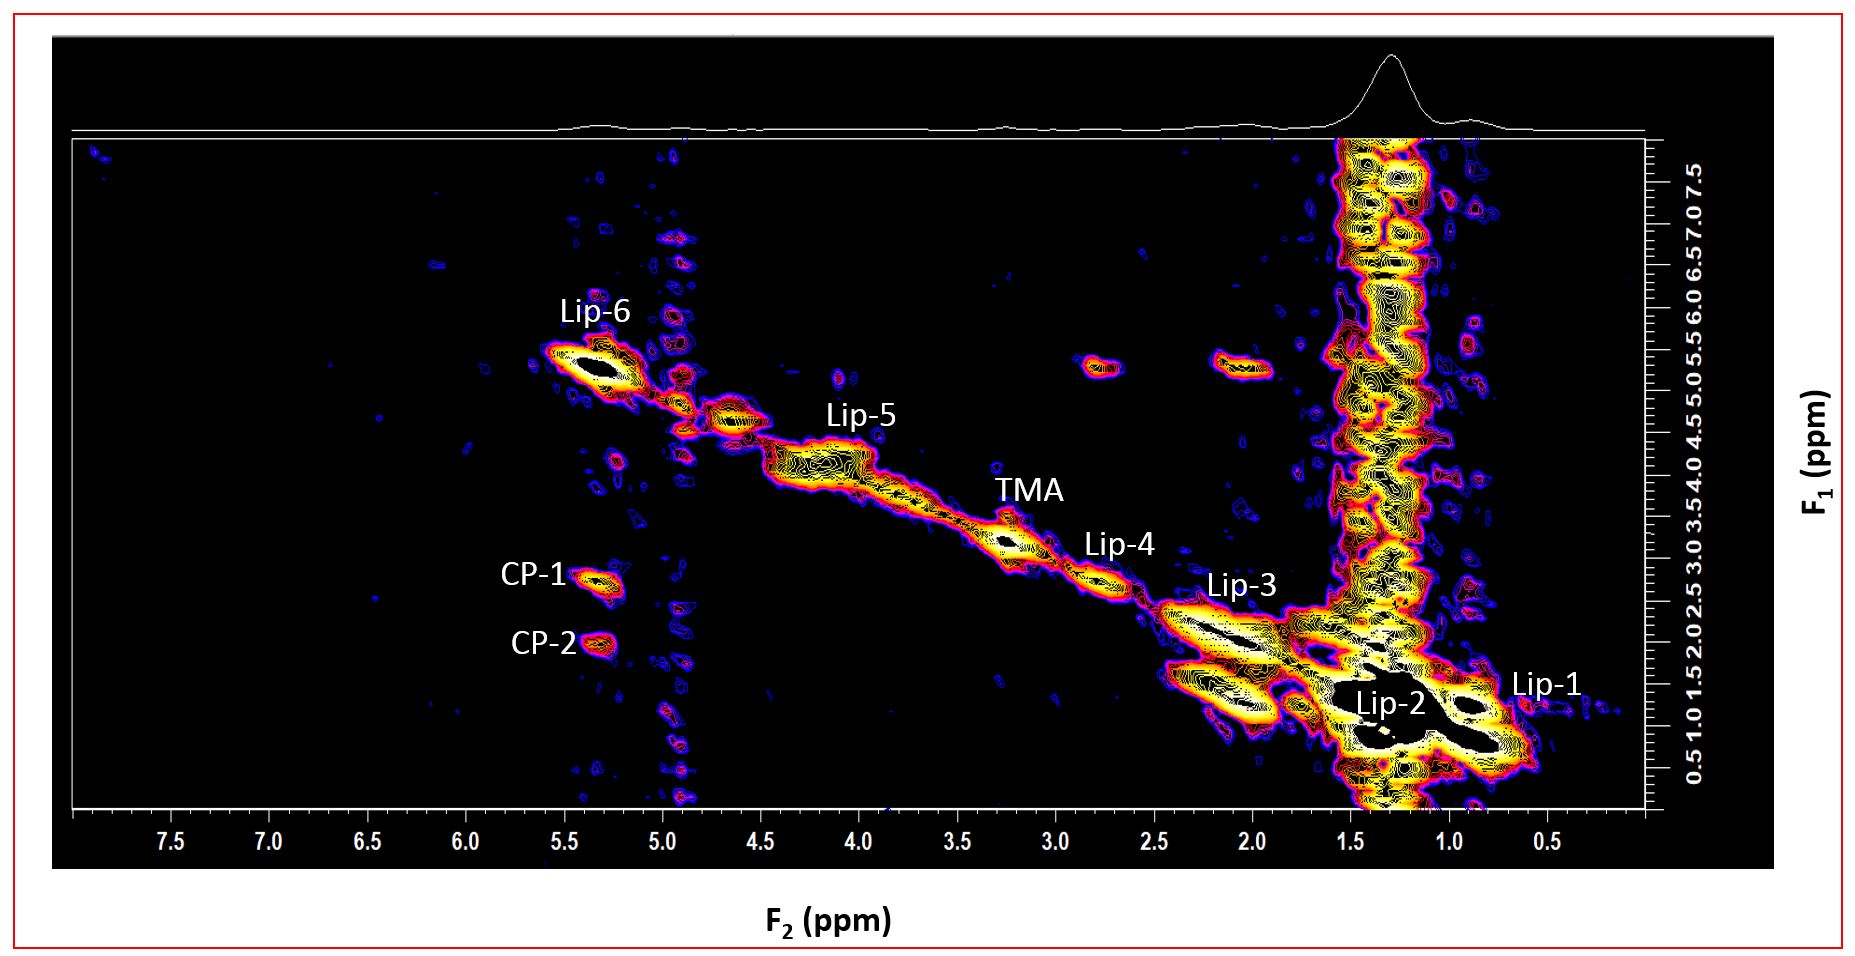
Fig.1 shows the 21 years old healthy volunteer MRS voxel placement in the liver. Fig.2 shows liver 1D MRS from the healthy volunteer with multiple peaks of lipids (0.9, 1.3, 2.09, 2.7, 4.30, and 5.3 ppm), trimethylamine (TMA) (3.12 ppm), and water (4.7 ppm). Fig.3 shows the 2D L-COSY spectrum from a 21 years old healthy volunteer where in addition to diagonal peaks from 1D MRS, there were few cross peaks (CP1 and CP2) at (F2, F1= 2.0, 5.3 ppm) and (F2, F1=2.8, 5.3 ppm). Fig.4a compares the mean 1D and 2D L-COSY lipids peaks to 1.3 ppm, and 4b shows the mean cross-peak volume obtained from 2D L-COSY. Both 1D PRESS and 2D L-COSY data with respect to the 1.3 ppm lipid peak ranged from 0.04 to 0.39. We did not see significant changes in the lipids between 1D and 2D L-COSY techniques (p>0.05).Discussion and Conclusions
This study demonstrates the feasibility of detecting cross peaks using the 2D L-COSY technique at 3T in a healthy liver. The volumes of the 2D cross-peak olefinic protons at (5.3, 2.0 ppm) reflect monounsaturated fatty acid components, and the cross-peak olefinic protons at (5.3, 2.8 ppm) reflect polyunsaturated fatty acids. Ratios of these cross-peak volumes define the degree of unsaturation. Thus, we propose that the 2D L-COSY-determined degree of unsaturation be evaluated as a potential biomarker for lipid-based metabolic disturbances. A drawback of this study is due to the lack of navigator echoes and cardiac gating to minimize the motion-related effects, including higher standard deviation of metabolite and lipid ratios. Further studies are required to explore the possibilities of using the unsaturation index to scale the pathology's severity in clinical practice 8-9. This technique needs further validation in more subjects.Acknowledgements
We thank Elena Bliss, our MR Technologist, and Sean Doherty for the jMRUI prior knowledge optimization.References
1. Johnson NA, Walton DW, Sachinwalla T, Thompson CH, Smith K, Ruell PA, Stannard SR, George J. Noninvasive assessment of hepatic lipid composition: advancing understanding and management of fatty liver disorders. Hepatology. 2008 May;47(5):1513-23.
2. Hu HH, Kim HW, Nayak KS, Goran MI. Comparison of fat–water MRI and single‐voxel MRS in the assessment of hepatic and pancreatic fat fractions in humans. Obesity. 2010 Apr;18(4):841-7.
3. Jones JG. Non-Invasive Analysis of Human Liver Metabolism by Magnetic Resonance Spectroscopy. Metabolites. 2021 Oct 29;11(11):751.
4. Fischbach F, Bruhn H. Assessment of in vivo 1H magnetic resonance spectroscopy in the liver: a review. Liver International. 2008 Mar;28(3):297-307.
5. Qayyum A. MR spectroscopy of the liver: principles and clinical applications. Radiographics. 2009 Oct;29(6):1653.
6. Thomas MA, Yue K, Binesh N, Davanzo P, Kumar A, Siegel B, Frye M, Curran J, Lufkin R, Martin P, Guze B. Localized two‐dimensional shift correlated MR spectroscopy of human brain. Magnetic Resonance in Medicine: An Official Journal of the International Society for Magnetic Resonance in Medicine. 2001 Jul;46(1):58-67.
7. Sarma MK, Huda A, Nagarajan R, Hinkin CH, Wilson N, Gupta RK, Frias-Martinez E, Sayre J, Guze B, Han SH, Thomas MA. Multi-dimensional MR spectroscopy: towards a better understanding of hepatic encephalopathy. Metabolic brain disease. 2011 Sep;26(3):173-84.
8. Machann J, Stefan N, Wagner R, Bongers M, Schleicher E, Fritsche A, Häring HU, Nikolaou K, Schick F. Intra‐and interindividual variability of fatty acid unsaturation in six different human adipose tissue compartments assessed by 1H‐MRS in vivo at 3 T. NMR in Biomedicine. 2017 Sep;30(9):e3744.
9. Joy A, Saucedo A, Joines M, Lee-Felker S, Kumar S, Sarma MK, Sayre J, DiNome M, Thomas A. Correlated MR spectroscopic imaging of breast cancer to investigate metabolites and lipids: Acceleration and compressed sensing reconstruction. BJR Open. 2022;(1):20220009.
Figures