2046
Influence of fat deposition in T1 measurement of the liver: The value of T1 mapping with water component only using the 2D DIXON Look-Locker method1Department of Radiology, Yamaguchi University Graduate School of Medicine, Ube, Yamaguchi, Japan, 2Department of Radiological Technology, Yamaguchi University Hospital, Ube, Yamaguchi, Japan, 3MR R&D Collaborations, Siemens Medical Solutions USA Inc, New York, NY, United States, 4MR Research and Collaboration, Siemens Healthcare K.K., Tokyo, Japan
Synopsis
Keywords: Liver, Liver
The purpose of this study was to elucidate the clinical importance of T1 mapping of the liver with the water component only using the 2D DIXON Look-Locker sequence. T1 values of the liver were compared among T1 maps obtained by IP, OP and DIXON Look-Locker sequences. T1 values of the liver on the T1 maps obtained from IP- and OP-based sequences were significantly influenced by an increased fat component. In contrast, the T1 value of the liver on the T1 maps with the water component only calculated from DIXON water images was unlikely to be influenced by hepatic steatosis.Introduction
T1 mapping on MRI has been shown to be useful for the noninvasive assessment of hepatic fibrosis 1. Previous studies have indicated that T1 mapping has potential to be a valuable tool for diagnosing chronic liver disease and determining its severity 2,3. Although fibrosis increases the T1 values in the liver, fat tissue also leads to increased T1 values of the liver on T1 mapping obtained via the Look-Locker opposed-phase-based sequence 4. This may make it difficult to assess hepatic fibrosis, which is of diagnostic significance, using the current T1 mapping in patients with chronic liver disease with hepatic steatosis. Therefore, T1 mapping without the influence of fat is required for the accurate evaluation of the presence and severity of liver fibrosis. Recent studies have proposed several new imaging-based methods for fat-/water-separated T1 mapping of the liver, such as magnetic resonance fingerprinting with dictionary-based fat-water separation technique and Golden-angle RAdial Sparse Parallel sequence with Dixon techniques, to exclude the influence of fat in the T1 measurement 5,6. However, these studies included only a small number of patients or volunteers, and the use of fat-/water-separated T1 maps obtained from these sequences is still limited in most clinical environments. The purpose of this study was to elucidate the clinical importance of T1 mapping of the liver with the water component only obtained via the two-dimensional (2D) DIXON Look-Locker sequence in daily practice.Methods
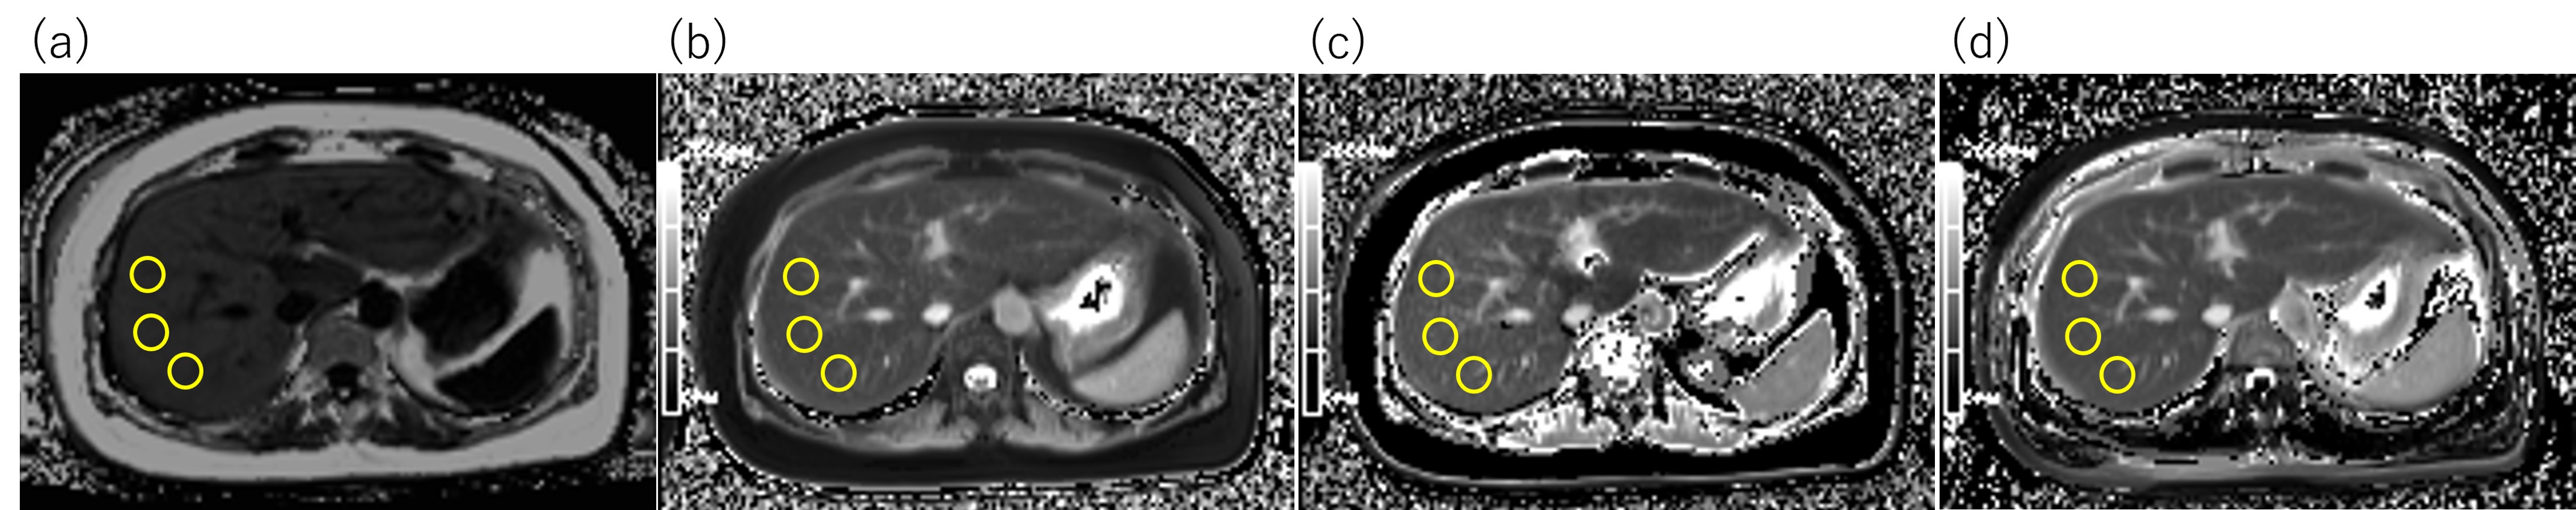
This retrospective study included 162 patients with suspected hepatobiliary or pancreatic diseases who underwent upper abdominal MR imaging including T1 mapping and fat fraction (FF) mapping on 3T MRI (Siemens MAGNETOM Prisma). A prototype 2D two-point DIXON Look-Locker sequence 7 was used to obtain T1 mapping with the water component only. Additionally, in-phase (IP) and opposed-phase (OP) Look-Locker imaging without DIXON were also performed separately to obtain T1 mapping for comparison. We measured the T1 values and fat signal fraction (FSF) of the liver on each T1 and FF maps using operator-defined regions of interest (ROIs). The T1 values of the liver were compared among T1 maps obtained by IP, OP and DIXON sequences. Patients were classified into 3 groups according to FSF of the liver, as follows: group 1, FSF < 5%; group 2, 5% ≤ FSF < 10%; and group 3, FSF ≥ 10%. In addition, T1 and FF maps of the phantoms with various volume ratios of fat and water components were evaluated to verify the validity of the clinical study. Statistical analysis was performed using a paired t-test, one-way analysis of variance, and Pearson’s product moment correlation coefficient analysis.Results
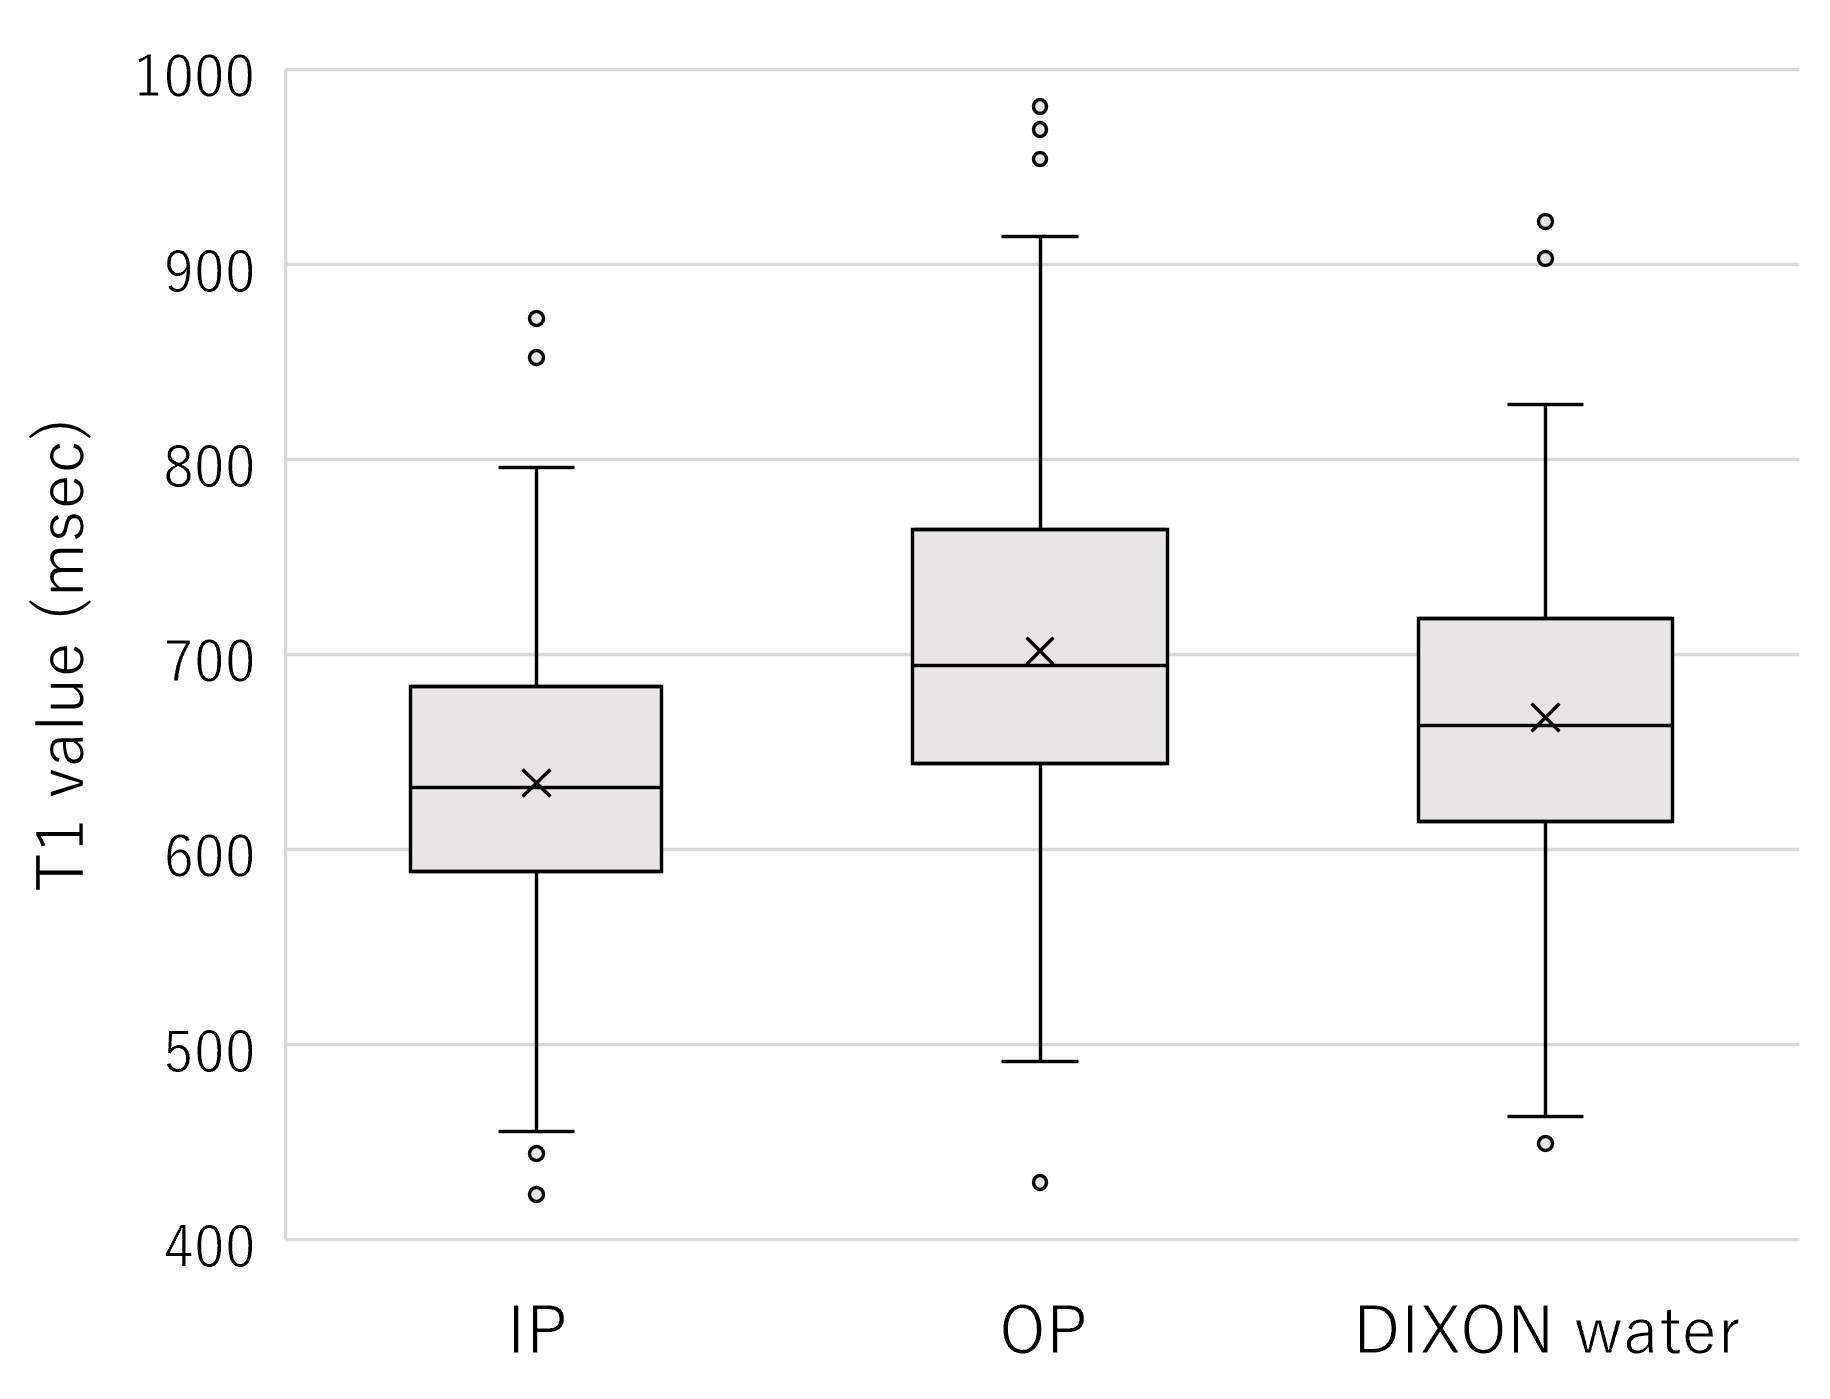
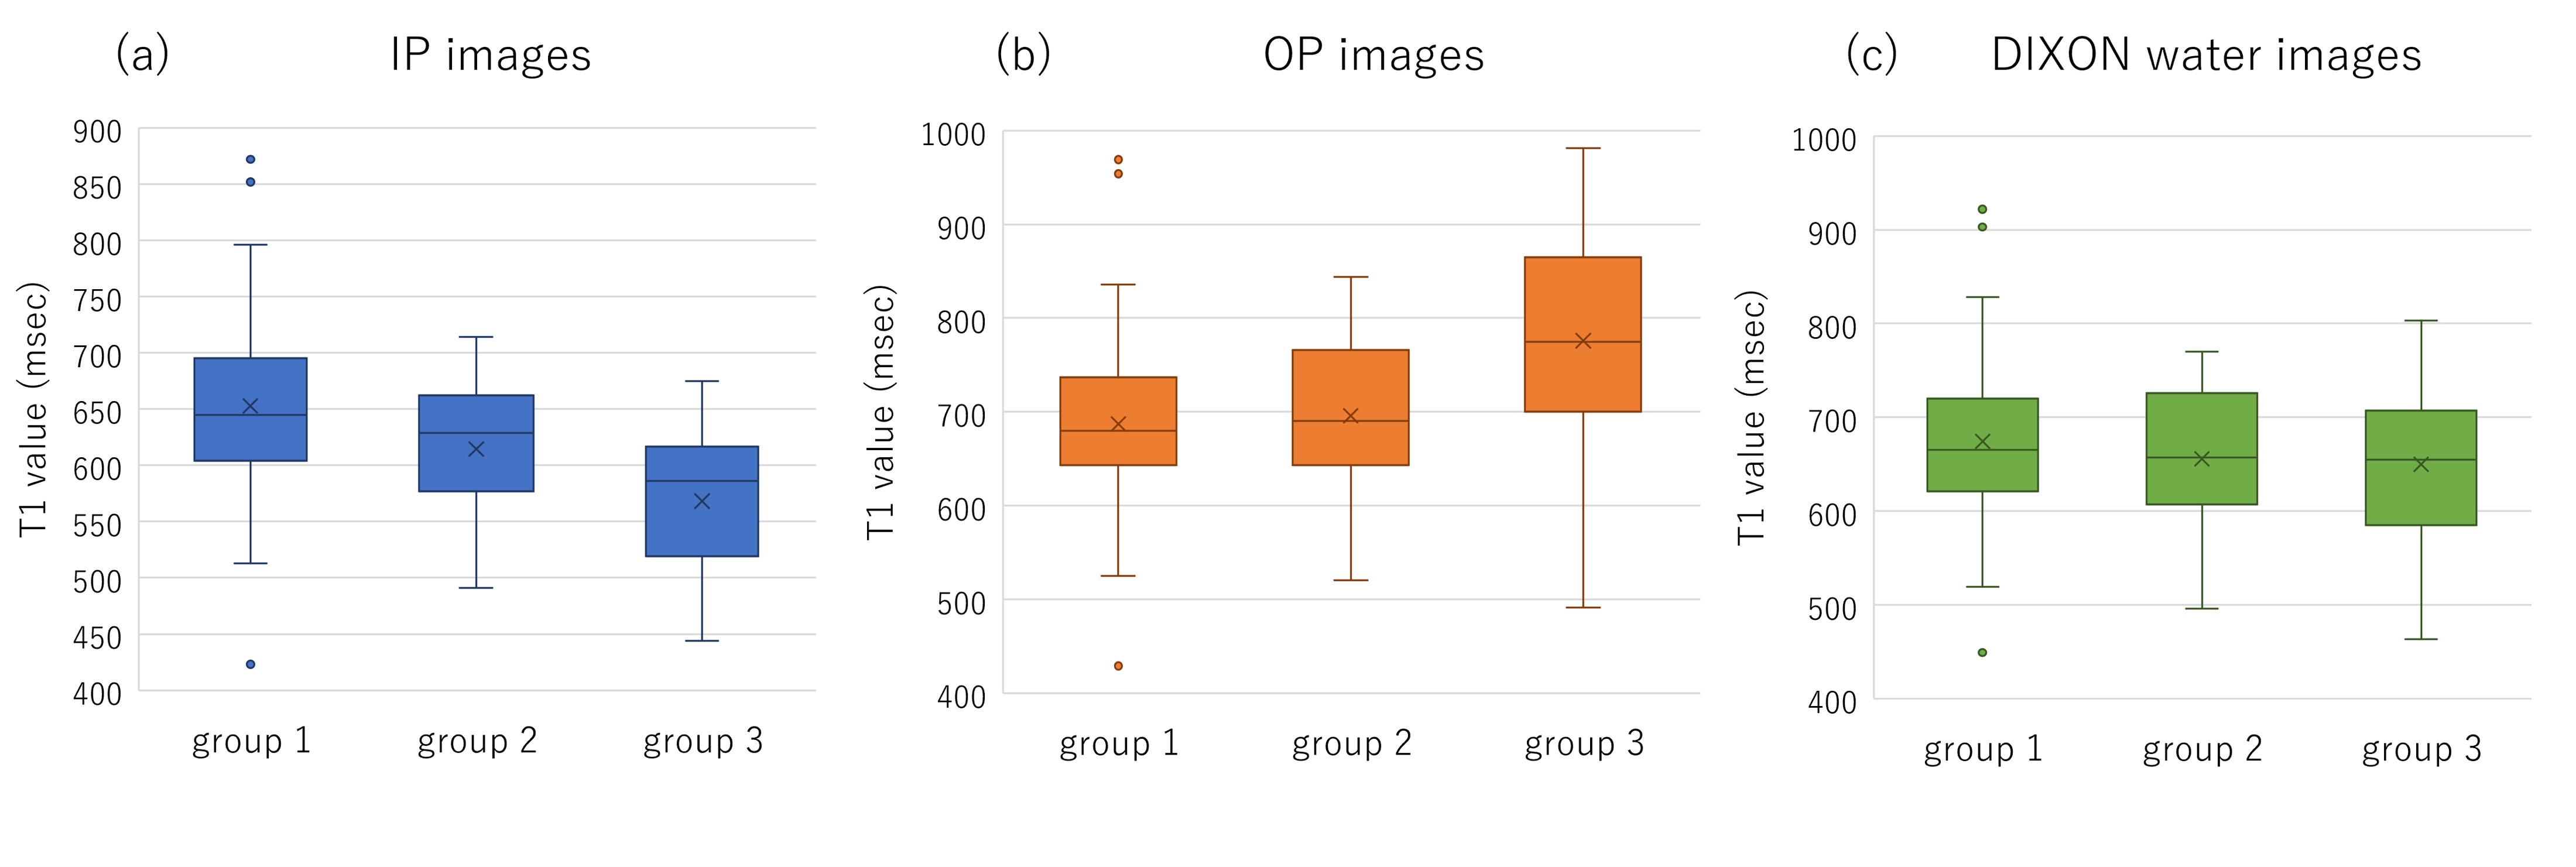
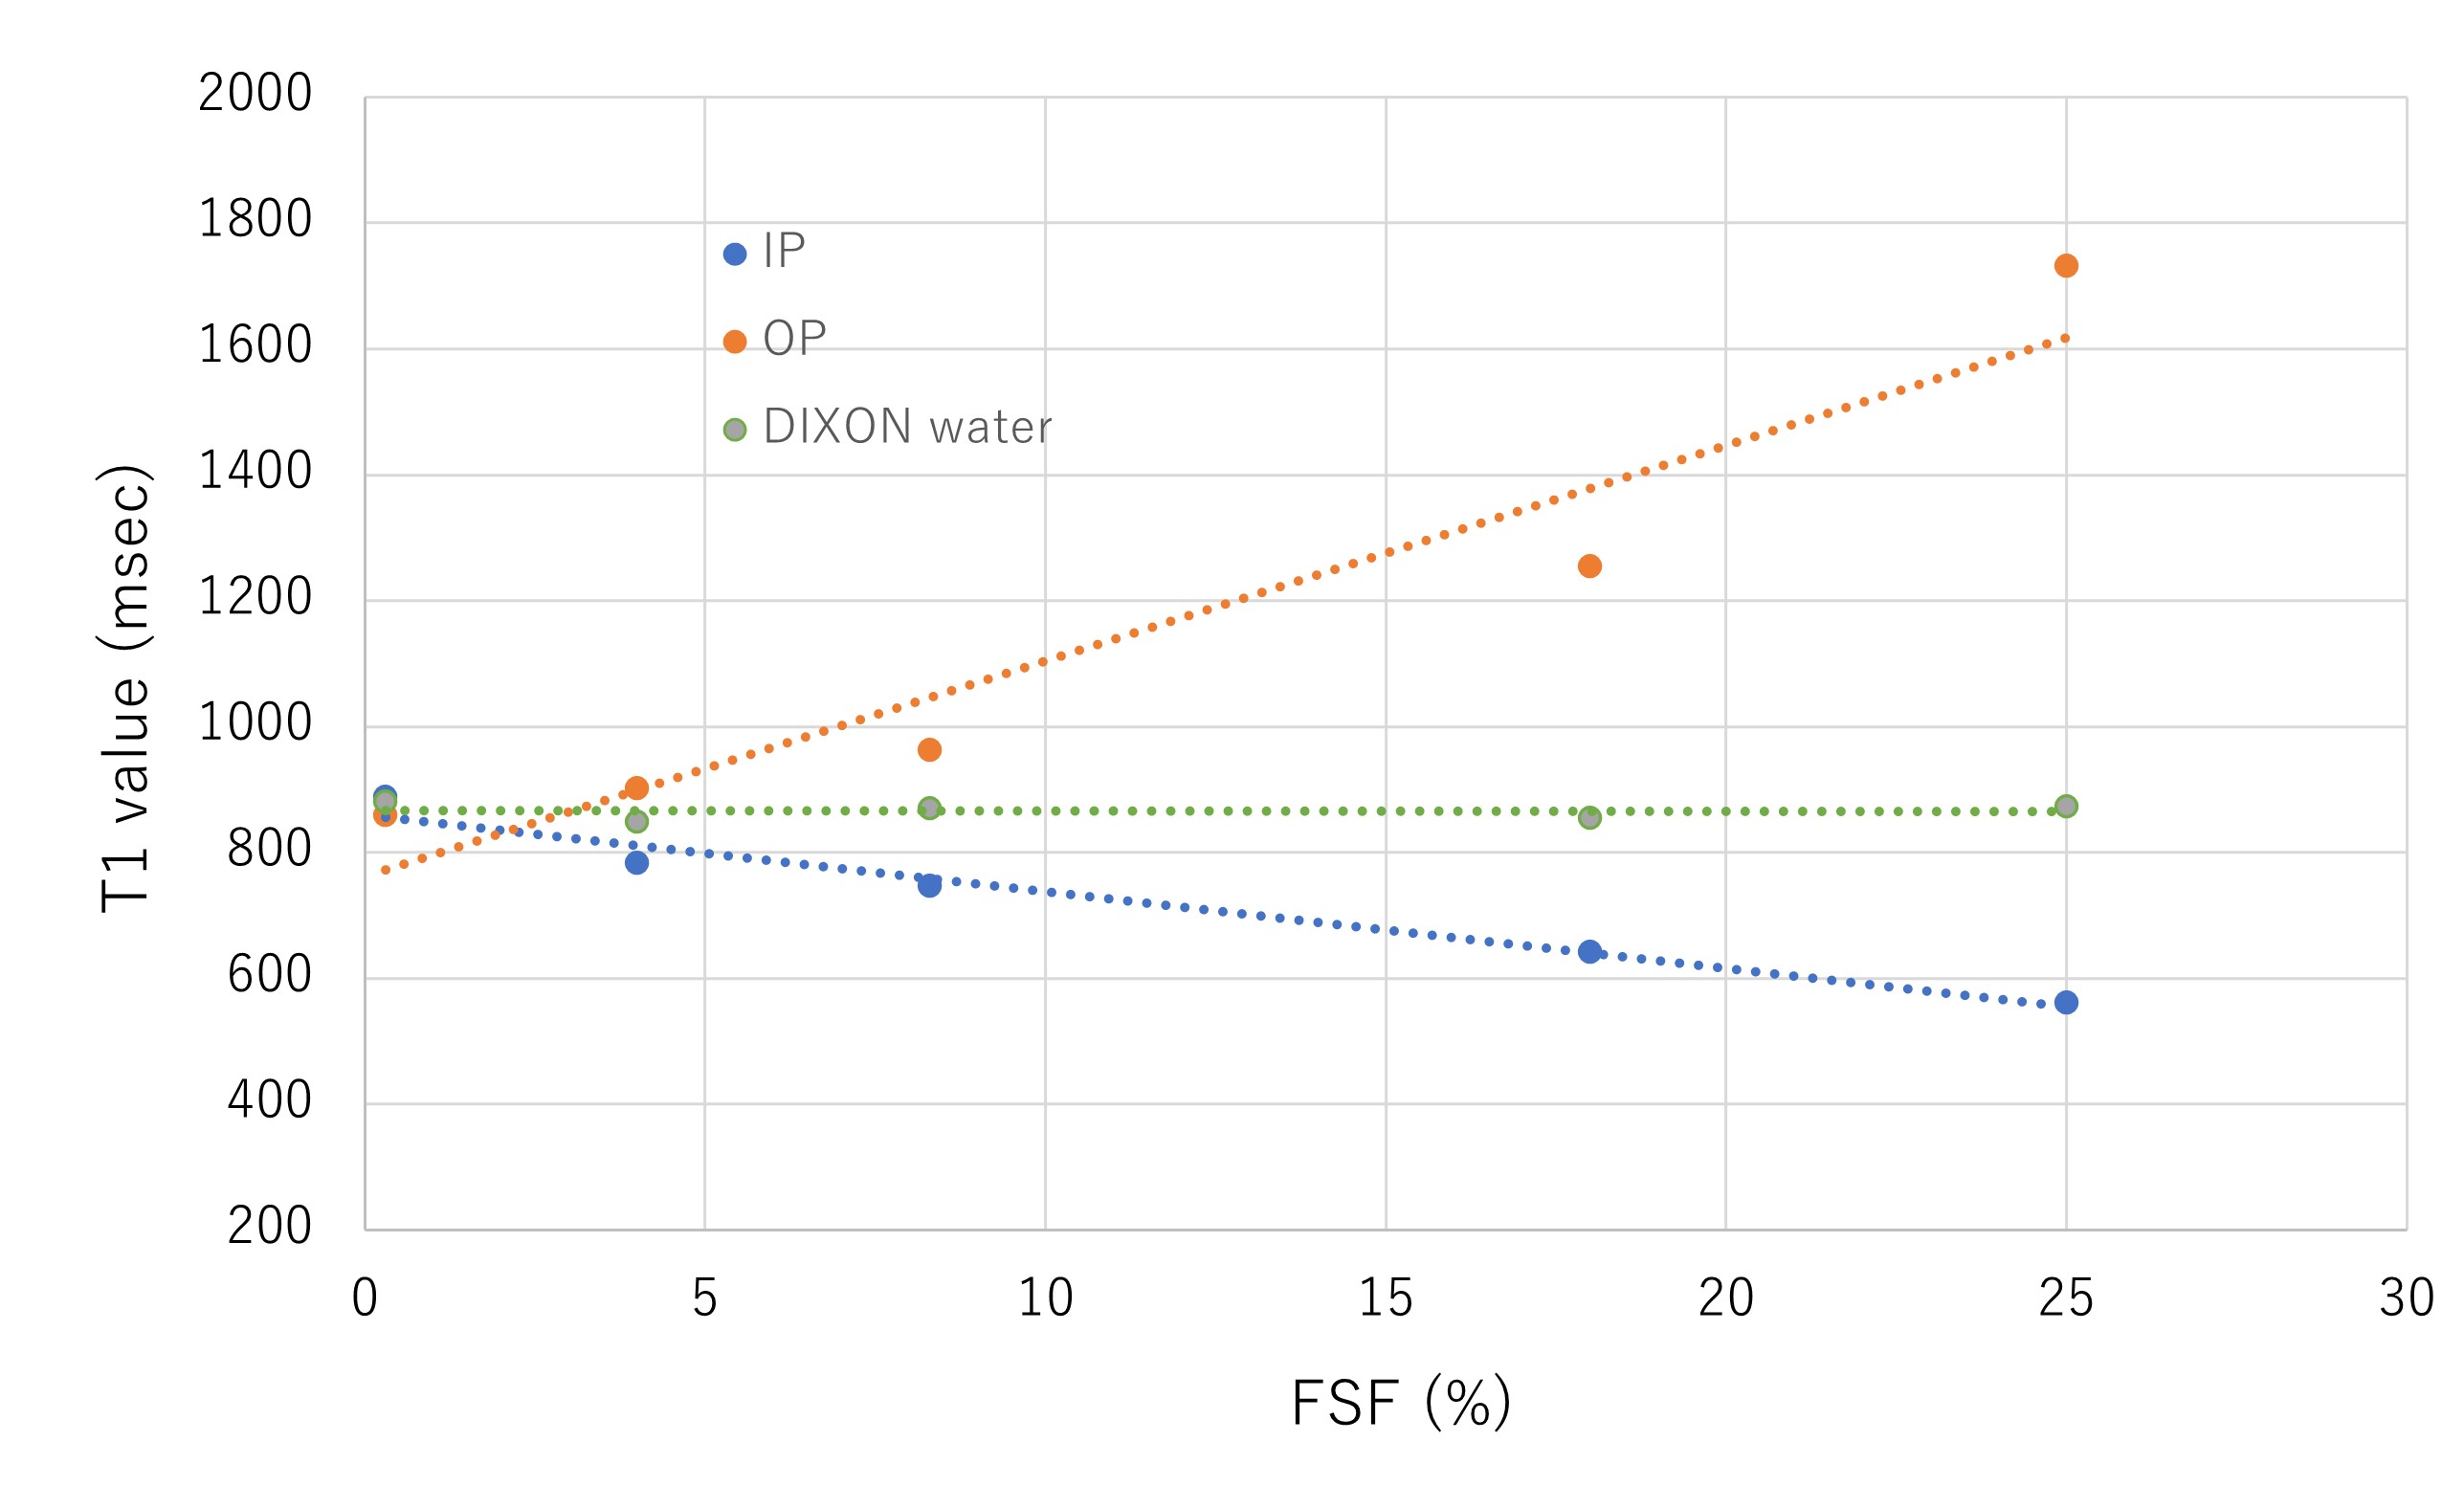
The mean T1 values of the liver on the IP images were significantly lower than those on the DIXON water images (p < 0.001), while the mean T1 values of the liver on the OP images were significantly higher than those on the DIXON water images (p < 0.001). The T1 value of the liver on the IP images was significantly shorter in group 3 (568 ± 62 msec) than in groups 1 (653 ± 73 msec) or 2 (615 ± 59 msec) (p < 0.001). The T1 value of the liver on the OP images was significantly longer in group 3 (776 ± 120 msec) than in groups 1 (687 ± 85 msec) or 2 (696 ± 84 msec) (p < 0.001). In contrast, there were no significant differences in the T1 value of the liver on the DIXON water images among the 3 groups (p = 0.252). Regarding T1 and FF maps of the phantoms, the T1 value on the IP images showed a significant negative correlation with the FSF (r = -0.985, p = 0.002). The T1 value on the OP images showed a significant positive correlation with the FSF (r = 0.959, p = 0.010). Conversely, no significant correlation was found between the T1 value on the DIXON water images and FSF (r = -0.032, p = 0.960).Discussion
Our study findings showed that the T1 values of the liver on the T1 maps obtained from IP- and OP-based sequences were significantly influenced by an increased fat component. This suggests that T1 mapping without the influence of fat is needed to accurately evaluate the T1 value of the liver, especially in patients with chronic liver disease accompanying hepatic steatosis. In contrast, on the T1 maps calculated from DIXON water images, our finding showed that the T1 value of the liver was less strongly influenced by the presence of fat. These results were confirmed by the phantom results that the T1 values on the IP and OP images showed strong correlations with the FSF, while the T1 value on the DIXON water images showed no significant correlation with the FSF. Our results indicate that T1 mapping of the liver with the water component only obtained from the 2D DIXON Look-Locker sequence may be useful for accurately assessing hepatic fibrosis in patients with chronic liver disease and hepatic steatosis.Conclusion
The T1 value of the liver on T1 mapping with the water component only using the 2D DIXON Look-Locker method was unlikely to be influenced by hepatic steatosis.Acknowledgements
No acknowledgement found.References
1. Banerjee R, Pavlides M, Tunnicliffe EM, et al. Multiparametric magnetic resonance for the non-invasive diagnosis of liver disease. Journal of hepatology 2014;60:69-77.
2. Haimerl M, Verloh N, Zeman F, et al. Assessment of clinical signs of liver cirrhosis using T1 mapping on Gd-EOB-DTPA-enhanced 3T MRI. PloS one 2013;8:e85658.
3. Cassinotto C, Feldis M, Vergniol J, et al. MR relaxometry in chronic liver diseases: Comparison of T1 mapping, T2 mapping, and diffusion-weighted imaging for assessing cirrhosis diagnosis and severity. European journal of radiology 2015;84:1459-1465.
4. Mozes FE, Tunnicliffe EM, Pavlides M, Robson MD. Influence of fat on liver T1 measurements using modified Look-Locker inversion recovery (MOLLI) methods at 3T. J Magn Reson Imaging 2016;44:105-111.
5. Jaubert O, Arrieta C, Cruz G, et al. Multi-parametric liver tissue characterization using MR fingerprinting: Simultaneous T(1) , T(2) , T(2) *, and fat fraction mapping. Magnetic resonance in medicine 2020;84:2625-2635.
6. Feng L, Liu F, Soultanidis G, et al. Magnetization-prepared GRASP MRI for rapid 3D T1 mapping and fat-/water-separated T1 mapping. Magnetic resonance in medicine 2021;86:97-114.
7. MB Keerthivasan, X Zhong, MD Nickel, et al. Simultaneous T1 and Fat Fraction Quantification using Multi-Echo Radial Look-Locker Imaging. Proceedings of the ISMRM, 2020
Figures