2045
Harmonized multi-site MRI-based quantification of human liver fat and stiffness: a pilot study1Biomedical Imaging Center, Pennington Biomedical Research Center, Baton Rouge, LA, United States, 2Auburn University, Auburn, AL, United States, 3University of Alabama, Birmingham, AL, United States, 4University of Alabama Medical Center, Birmingham, AL, United States, 5The University of Mississippi Medical Center, Jackson, MS, United States, 6The University of Alabama Medical Center, Birmingham, AL, United States, 7Pennington Biomedical Research Center, Baton Rouge, LA, United States, 8The University of Alabama School of Medicine, Birmingham, AL, United States, 9The University of Alabama, Birmingham, AL, United States
Synopsis
Keywords: Liver, Liver, Nonalcoholic Fatty Liver Disease; Magnetic Resonance Spectroscopy; Elasticity Imaging Techniques; Magnetic Resonance Imaging
Non-alcoholic fatty liver disease (NAFLD) is a leading cause of end-stage liver disease. NAFLD diagnosis and follow-up relies on a combination of clinical data, liver imaging, and/or liver biopsy. However, inter-site imaging differences impede diagnostic consistency and reduce the repeatability of the multi-site clinical trials necessary to develop effective treatments. The goal of this pilot study was to harmonize commercially available 3T magnetic resonance imaging (MRI) measurements of liver fat and stiffness in human participants across academic sites and MRI vendors.Purpose
Non-alcoholic fatty liver disease (NAFLD) is a leading cause of end-stage liver disease. NAFLD diagnosis and follow-up relies on a combination of clinical data, liver imaging, and/or liver biopsy. However, inter-site imaging differences impede diagnostic consistency and reduce the repeatability of the multi-site clinical trials necessary to develop effective treatments. The goal of this pilot study was to harmonize commercially available 3T magnetic resonance imaging (MRI) measurements of liver fat and stiffness in human participants across academic sites and MRI vendors.Methods
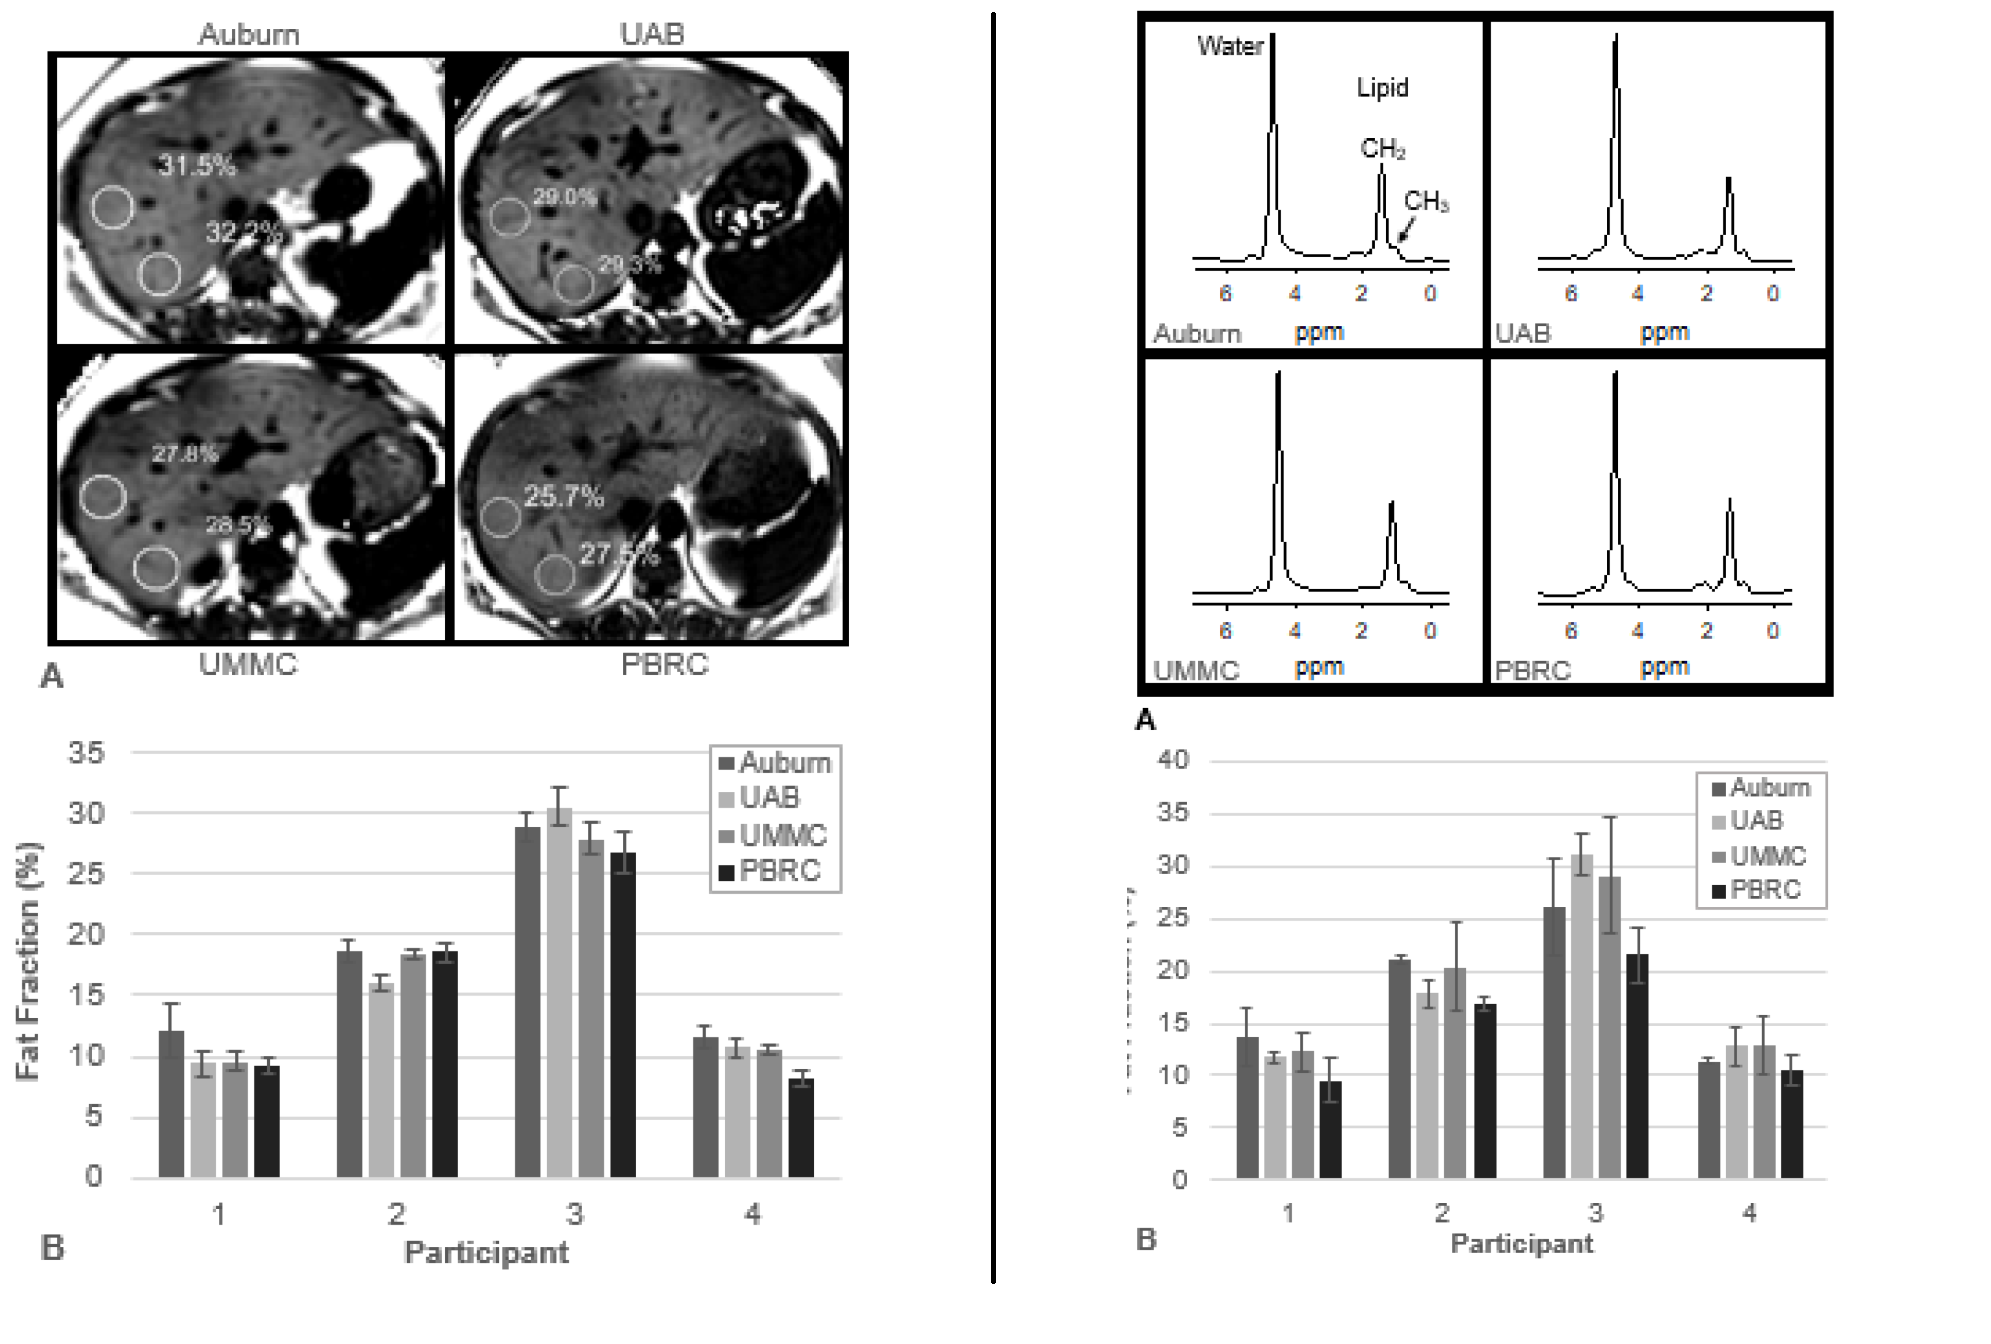
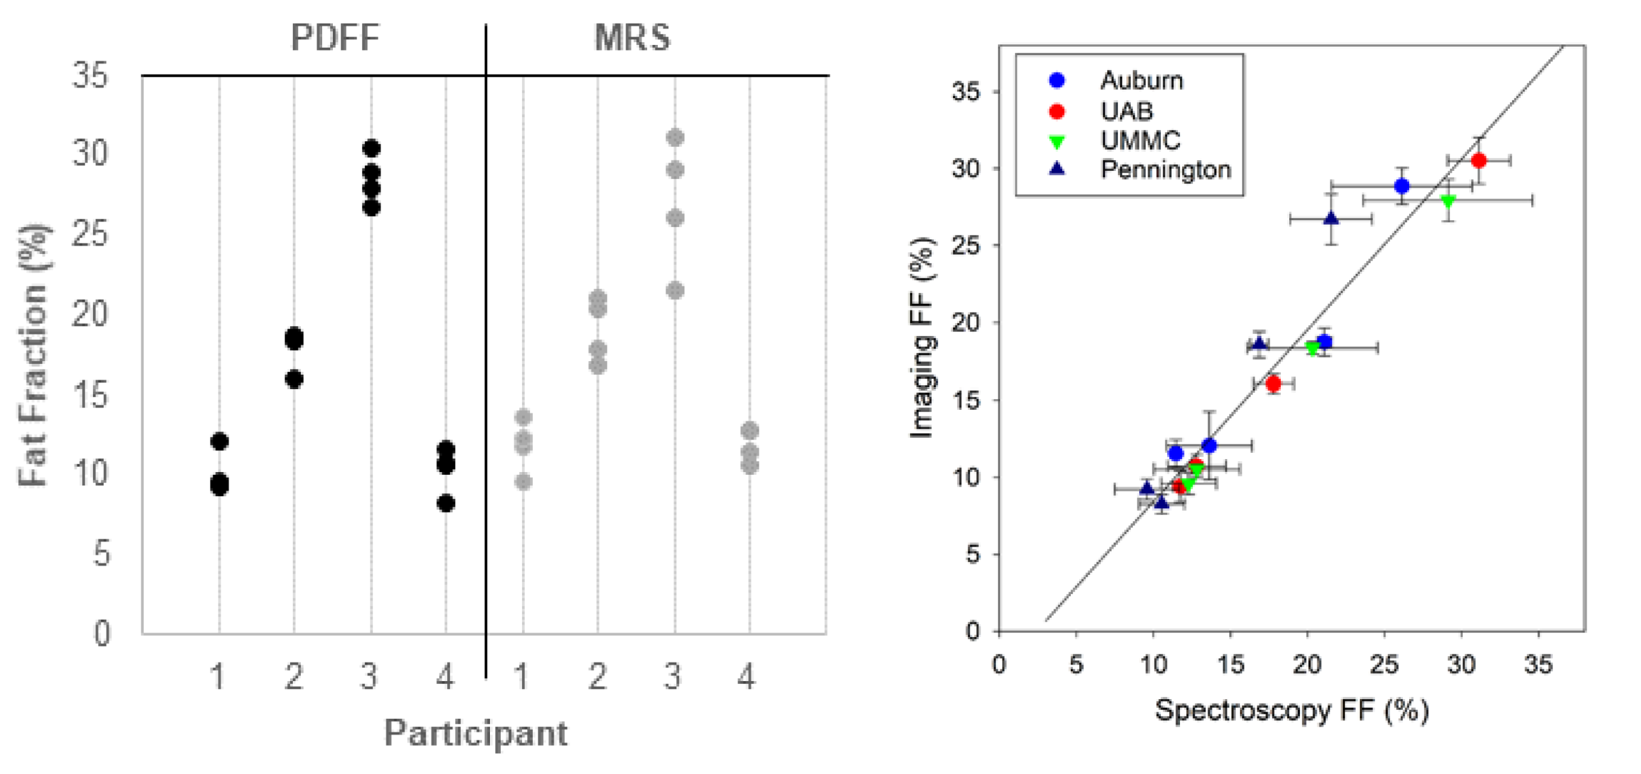
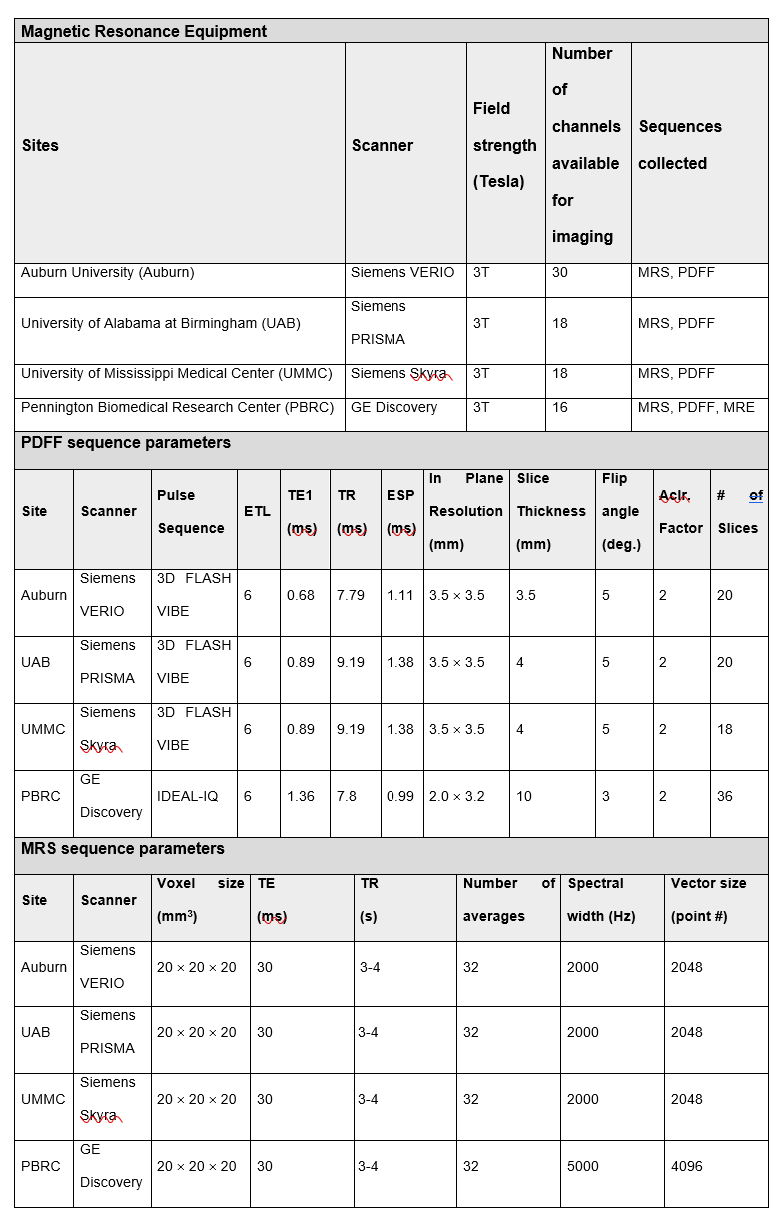
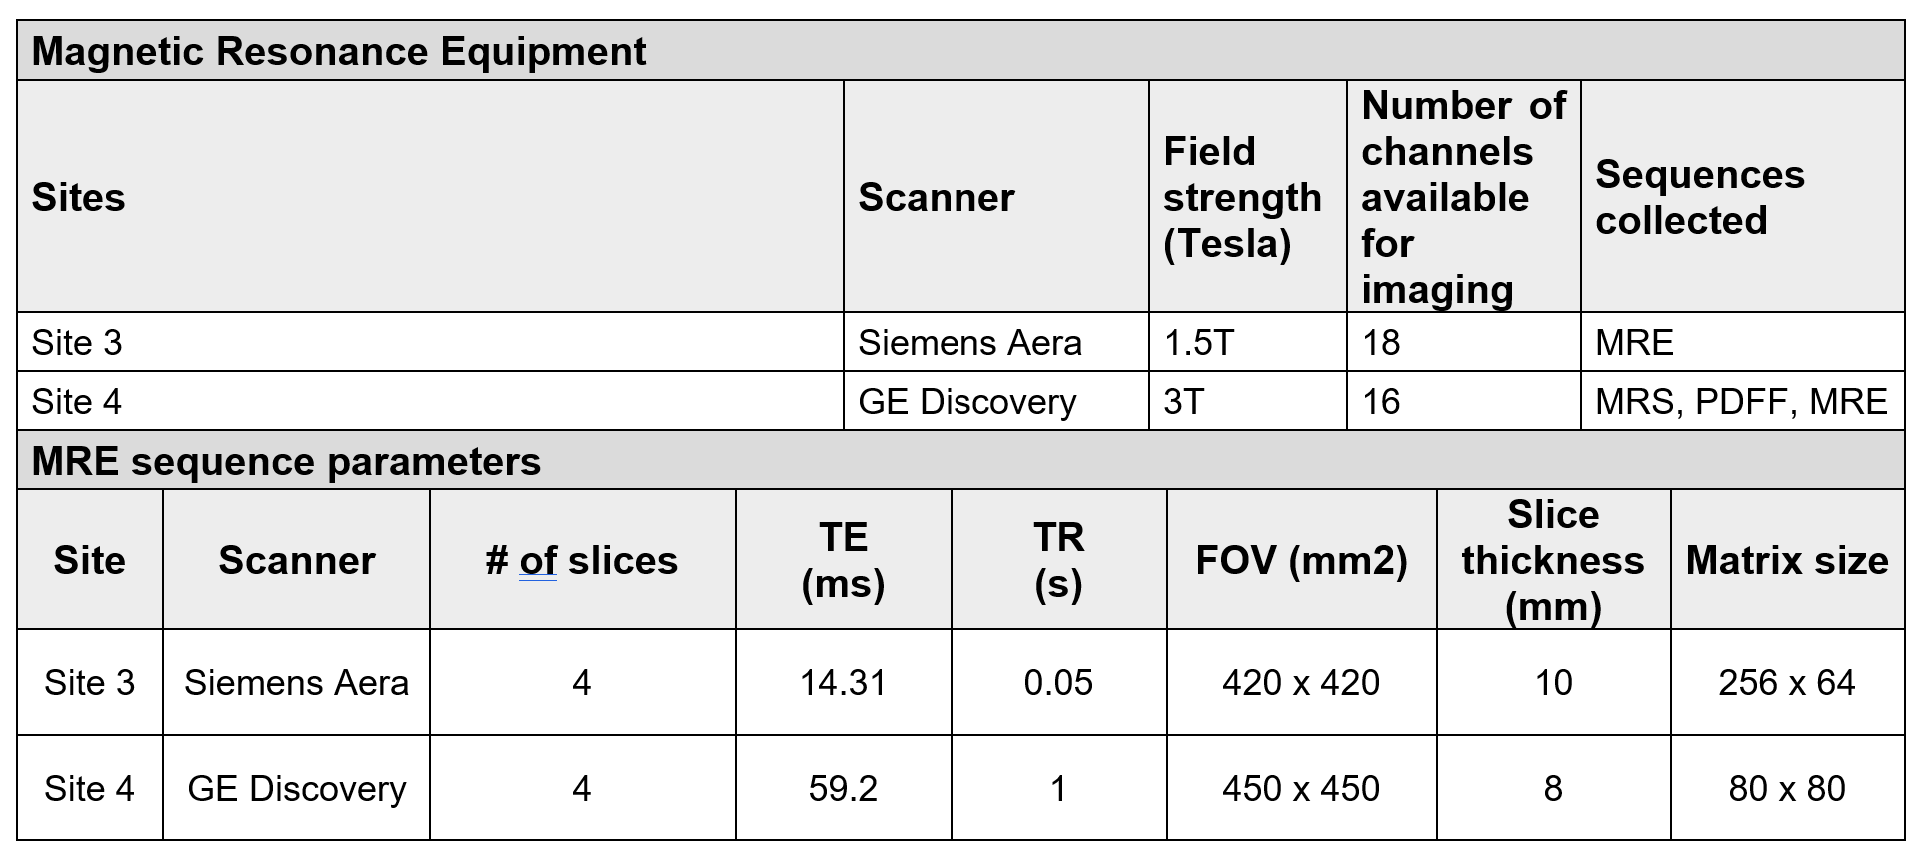
Four obese participants were recruited from outpatient clinics at the University of Alabama at Birmingham (UAB). The UAB IRB served as the single reviewing IRB of record and participating sites relied on the UAB IRB approval of the Human Subjects Research protocol. All participants provided written informed consent. Inclusion criteria included 1) age greater than 18 years; 2) BMI greater than 30 kg/m2 (23 kg/m2 among individuals whose self-reported race was Asian); and 3) body weight less than 150 kg. In addition to MRI contraindications, exclusion criteria included clinical history of cirrhosis, HIV positivity, or drug abuse within the previous 12 months. MRI scans were conducted in all participants at four participating sites: Auburn University (Auburn), University of Alabama at Birmingham (UAB), University of Mississippi Medical Center (UMMC) and Pennington Biomedical Research Center (PBRC) within two weeks of the scans at UAB, and the average time between scans was 4.5 days.Water-oil phantoms (concentration: 4%, 10%, 15%, 25%, 40%, 45% and 55%) were constructed in 50 mL conical tubes based on a modified version of the phantoms as described by Hines et al.1 to identify biasness in data measurement at each site. Harmonized proton density fat fraction (PDFF) and magnetic resonance spectroscopy (MRS) protocols were used to quantify the fat fractions of synthetic phantoms and human participants with obesity using standard acquisition parameters at four sites that had four different 3T MRI instruments (Table 1). In addition, a harmonized magnetic resonance elastography (MRE) protocol was used to quantify liver stiffness among participants at two different sites at 1.5 and 3T field strengths (Table 2). Data were sent to a single data coordinating site for post-processing.
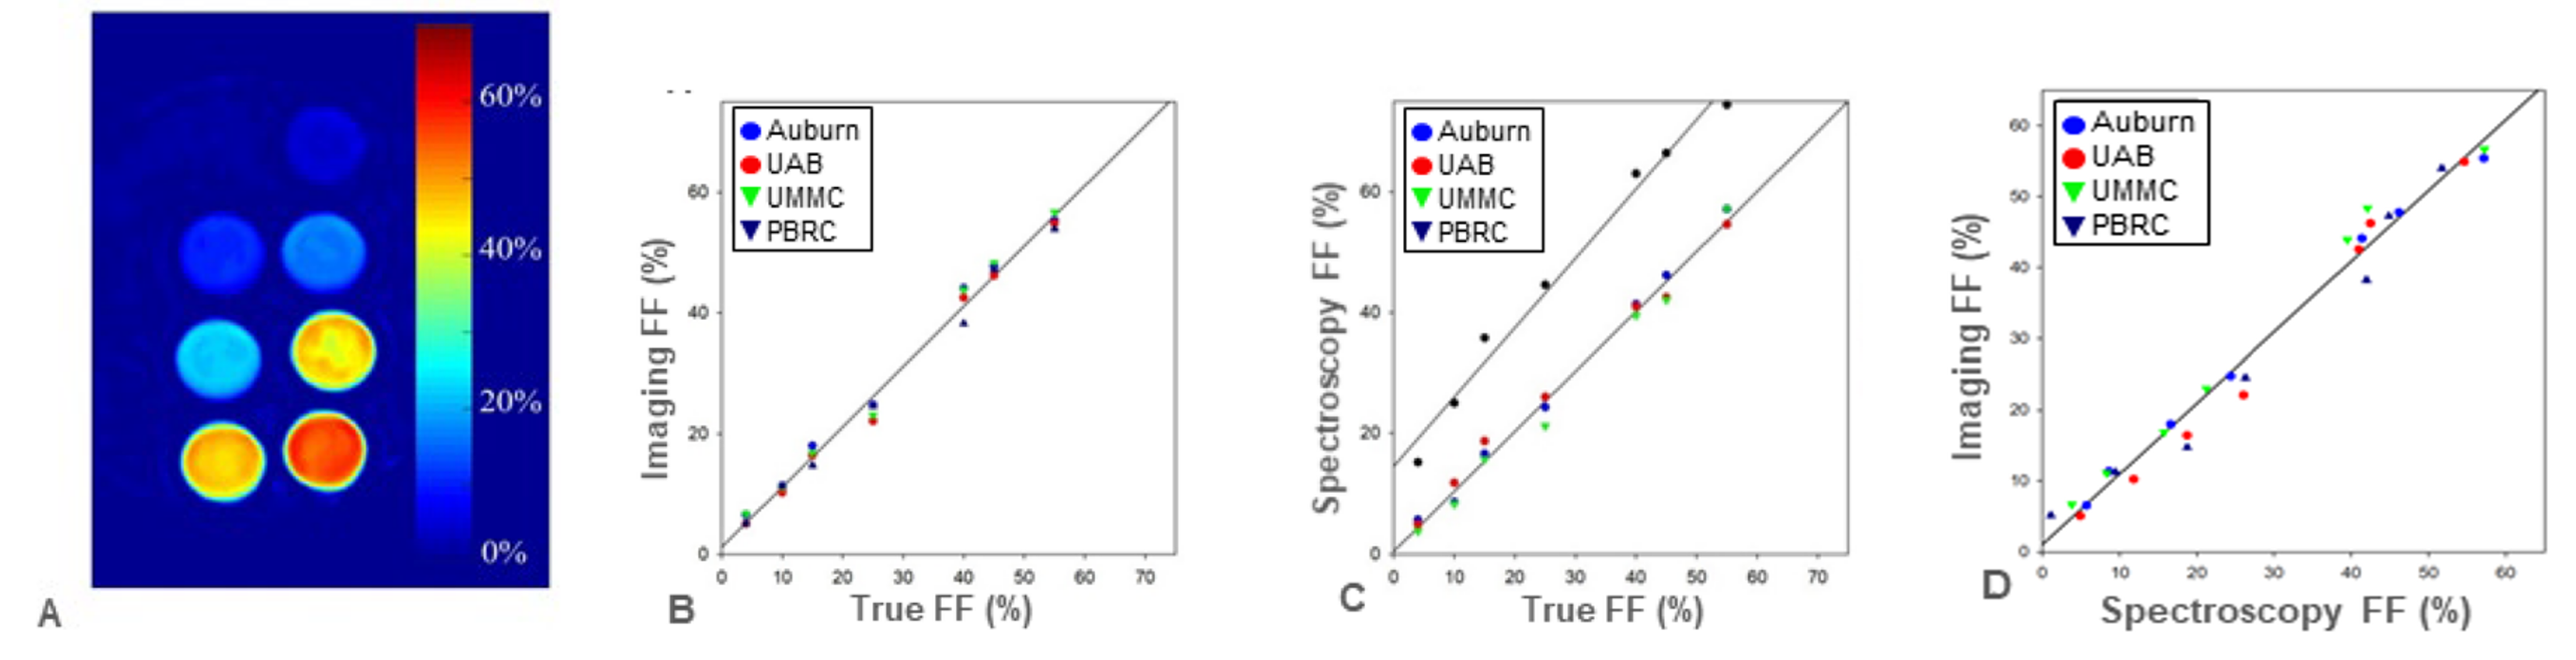
Agreement among the known phantom lipid fractions and those provided by MRS and PDFF (known vs MRS, known vs PDFF and MRS vs PDFF) was assessed using linear regression in MATLAB (Figure 1). For the human and phantom data, separate intraclass correlation coefficients (ICC) for PDFF, MRS, and MRE quantified inter-scanner agreement. ICC calculations used the sample means as the outcome within a one-way ANOVA model treating participant as a random effect. For PDFF and MRS, the ICC approach compared four participants measured at four sites. For MRE, the ICC compared four participants measured at two sites. An ICC ≥ 0.8 indicates high repeatability. Using 10,000 bootstrap samples per outcome, one-sided 95% confidence intervals (CI) for the ICC were calculated. ICC analyses were conducted using SAS 9.4.
Results and Discussion
A positive bias was established in phantom liver fat fraction MRS measurement at one site (PBRC) which was leveraged during post-processing as a correction factor for all human MRS liver measurements for that site. PDFF and MRS fat fraction measurements were highly repeatable between sites (despite heterogeneity in MRI hardware and software) in both phantoms (ICC: 0.994 and 0.988, see Figure 1) and humans (ICC: 0.964 and 0.915, see Figure 2 and 3). MRE measurements of liver stiffness in three individuals at two sites using one 1.5T and one 3T instrument showed repeatability that was high although lower than that of MRS and PDFF (ICC 0.864). Establishing such repeatability is critically important to understand the validity of measurements taken in multi-site clinical trials1-3, wherein site-to-site variation must be identified, controlled, and ultimately minimized. We anticipate that our approach, including harmonization of data acquisition parameters, centralized data analysis, phantom measurements at all sites, and a traveling cohort, may be utilized to establish the repeatability of future multi-site MRI-based methods relevant to NAFLD and NASH clinical trials.Conclusions
We demonstrated harmonization of PDFF-, MRS-, and MRE-based quantification of liver fat and stiffness through synthetic phantoms, traveling participants, and standardization of post-processing analysis. Multi-site MRI harmonization could contribute to multi-site clinical trials assessing the efficacy of interventions and therapy for NAFLD.Acknowledgements
We thank the UAB Center for Clinical and Translational Science (CCTS) Clinical Research Support Program (CRSP) for their assistance with this study’s recruitment, enrollment, coordination and regulatory compliance. Research reported in this publication was supported by the National Center for Advancing Translational Sciences of the National Institutes of Health under award number UL1TR003096, and by the Pennington/Louisiana NORC Center Grant P30 DK072476. The content is solely the responsibility of the authors and does not necessarily represent the official views of the National Institutes of Health.
References
1. Hines CD, Yu H, Shimakawa A, et al. T1 independent, T2* corrected MRI with accurate spectral modeling for quantification of fat: validation in a fat‐water‐SPIO phantom. Journal of Magnetic Resonance Imaging: An Official Journal of the International Society for Magnetic Resonance in Medicine. 2009 Nov;30(5):1215-22.
2. Hernando D, Sharma SD, Aliyari Ghasabeh M, et al. Multisite, multivendor validation of the accuracy and reproducibility of proton‐density fat‐fraction quantification at 1.5 T and 3T using a fat–water phantom. Magnetic resonance in medicine. 2017 Apr;77(4):1516-24.
3. Mashhood A, Railkar R, Yokoo T, et al. Reproducibility of hepatic fat fraction measurement by magnetic resonance imaging. Journal of Magnetic Resonance Imaging. 2013 Jun;37(6):1359-70.
Figures