2042
The Effects of Menstrual Cycle on Hepatic Glycogen Stores Before and After Exercise: Preliminary Data From a 13C MRS Study1Nottingham Digestive Diseases Centre, NIHR Nottingham Biomedical Research Centre, University of Nottingham, Nottingham, United Kingdom, 2Sir Peter Mansfield Imaging Centre, School of Physics and Astronomy, University of Nottingham, Nottingham, United Kingdom, 3Graduate School of Health and Sport Science, Nippon Sport Science University, Tokyo, Japan
Synopsis
Keywords: Liver, Metabolism
The aim of this study was to investigate the effects of hormonal changes throughout the menstrual cycle on moderate exercise induced liver glycogen changes in healthy women. Preliminary results show variation in hepatic glycogen stores and changes following exercise throughout the menstrual cycle.Introduction
In recent years, the activities of female athletes have been increasing. However, the blood concentrations of hormones change significantly for premenopausal women throughout the menstrual cycle1. Therefore, since the condition of the body changes with the menstrual cycle, it is necessary to establish a conditioning method that considers the menstrual cycle.Previous work has shown that oxidative stress and serum carnitine, which are physiological indices highly related to fatigue, differ through the menstrual cycle2,3. In addition, studies suggest that the menstrual cycle influences muscle glycogen utilization during high-intensity intermittent exercise until exhaustion in women with habitual exercise activity4. Estrogen promotes increased fat oxidation, sparing muscle and hepatic glycogen, decreasing gluconeogenesis, and increasing the exercise time until exhaustion5. Progesterone is known to reverse several estrogenic effects, including reducing fat oxidation6. The amount of glycogen stored in the body, either in liver or muscle, is highly related to fatigue and exercise performance. However, few studies have investigate these effects on glycogen stores in the liver in humans7. Even in these studies, comparisons are made between the early follicular phase (when both estradiol and progesterone concentrations are low) and the luteal phase (when both estrogen and progesterone concentrations are high) only, thus being unable to determine the effects of estradiol alone. Therefore, conducting measurements in the late follicular phase, when serum estradiol concentrations are high but serum progesterone concentrations are low, is necessary to confirm the effects of estrogen alone.
The aim of this study was to investigate the effects of hormonal changes throughout the menstrual cycle on moderate exercise induced liver glycogen changes in healthy women as measured using 13C MRS.
Methods
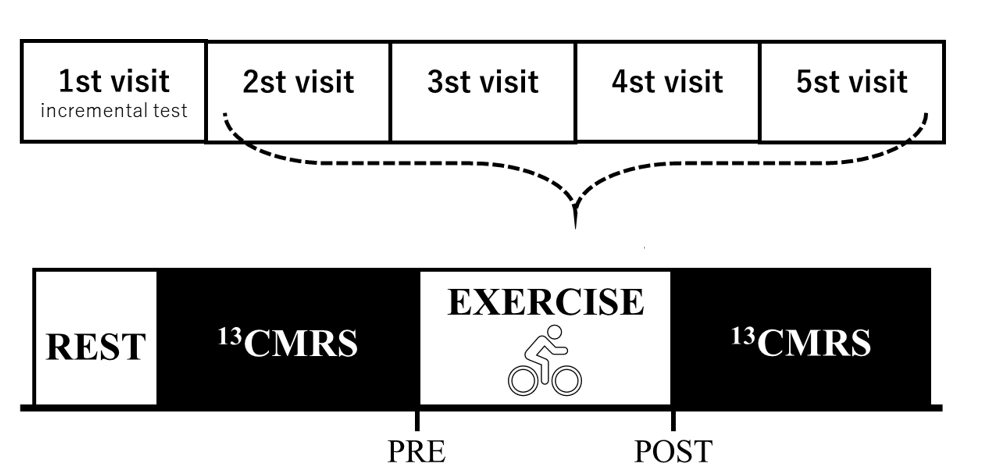
Ethics was approved from the local ethics board. Healthy female participants (Aged 18-35, nulliparous, habitual exercisers, no use of oral contraceptives or hormonal medications for 6 months prior) with regular menstrual cycle (every 25 – 38 days) were recruited. Participants visited the SPMIC on 5 occasions, first to calibrate exercise for 70% max heartrate and then on 4 weekly test visits (Figure 1).Test Day: During test visit, participants consume a breakfast of 2 slices white toast jam at home and arrive at the test centre 2 hours after for pre-exercise 13C MRS acquisition. Following scan, participants completed 45 minutes exercise on an exercise bike at a constant a constant cycle rate and a workload calibrated on initial visit. Heart rate was monitored and work-load adjusted to maintain heart rate at 70% max. Following exercise, participants returned to the scanner for a repeat 13C MRS scan. The participant also completed a survey to monitor stage in the menstrual cycle and underwent an ovulation test to determine precise date of ovulation.
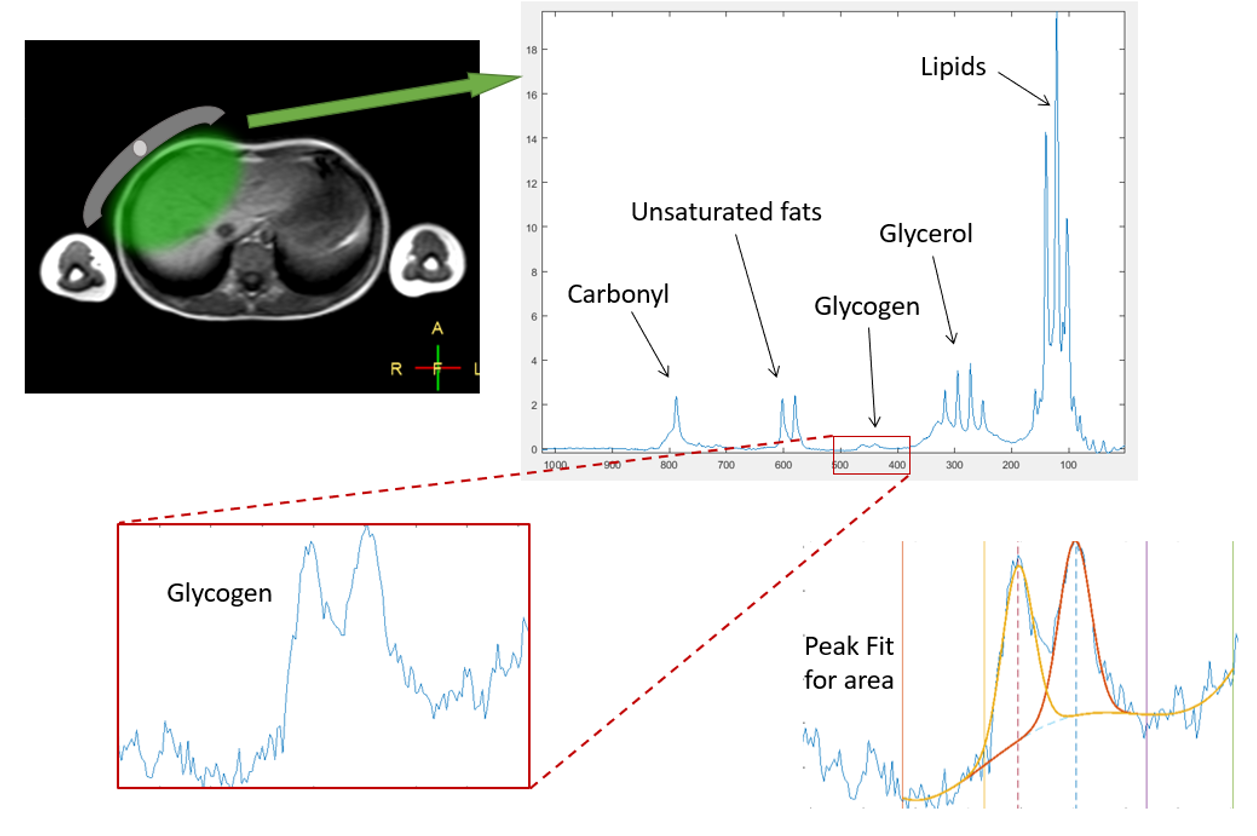
MR protocol: All scans were performed on a Philips 3T Acheiva scanner using a Pulseteq 12cm single-loop 13C surface coil8 with a 13C Urea reference sample attached at the coil centre (signal at 176 ppm). The surface coil was placed over the liver and scout images acquired to confirm correct coil placement. A short-duration long-TR 13C-Urea MRS reference scan was first acquired (TR = 1500 ms, 20 spectra averaged, time = ~1 min) followed by a short-TR 13C glycogen MRS scan (TR = 280 ms, 3072 spectra averaged, time = ~15 mins) with pencil beam shimming (900 block pulse, bandwidth = 7 kHz).
Data analysis: Spectra were line broadened and phase corrected. The area under the urea reference peak and the glycogen doublet (~101 ppm) was determined by fitting gaussian curves using an in-house Matlab script (Mathwork inc). Calibrated signals were then calculated by scaling the glycogen signal to the urea reference signal9 and expressed as procedure defined units (p.d.u.), before adjusting visit day relative to menstrual cycle. Comparisons before and after exercise were made.
Results
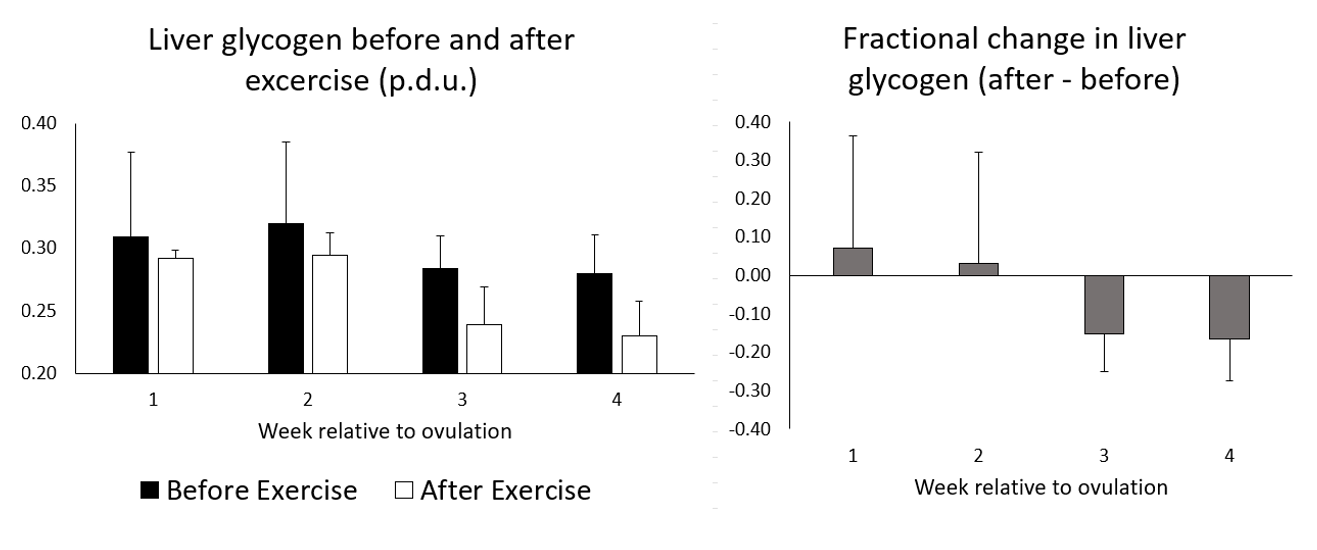
Preliminary data was acquired and analysed on 3 participants. Spectra showed good SNR with easily resolved glycogen doublet peaks at ~101 ppm (Figure 2). The mean pre-exercise glycogen levels tended to be less on week 3 and 4 from ovulation compared to week 1 and 2 (Figure 3a) with lower variability.Glycogen values decrease post exercise, although the fractional change was around 0 during weeks 1 and 2 from ovulation and negative during week 3 and 4 (Figure 3b).
Discussion
13C MRS provides a powerful tool for assessing human physiology in-vivo. Whilst measurements can be time consuming and specific equipment and expertise are required, its non-invasive methodology allows for repeated measurements that can monitor the effects of normal hormonal changes on metabolism effectively.In the present study, important data on the effects of menstrual cycle on energy metabolism has been explored. Whilst it is too early to draw conclusions from preliminary data, the results thus far suggest effects on liver glycogen stores and relative changes following exercise in-line with previous work where higher levels of estrogen during the luteal phase promoted fat oxidation5. Further analysis is needed when more participants are recruited and blood measurements are included.
Acknowledgements
No acknowledgement found.References
1. Elliott-Sale, K.J., et al., Methodological Considerations for Studies in Sport and Exercise Science with Women as Participants: A Working Guide for Standards of Practice for Research on Women. Sports Medicine, 2021. 51(5): p. 843-861.
2. Matsuda, T., et al., Effects of the Menstrual Cycle on Serum Carnitine and Endurance Performance of Women. International Journal of Sports Medicine, 2020. 41(7): p. 443-449.
3. Matsuda, T., et al., Effects of the menstrual cycle on oxidative stress and antioxidant response to high-intensity intermittent exercise until exhaustion in healthy women. Journal of Sports Medicine and Physical Fitness, 2020. 60(10): p. 1335-1341.
4. Matsuda, T., et al., Influence of menstrual cycle on muscle glycogen utilization during high-intensity intermittent exercise until exhaustion in healthy women. Applied Physiology Nutrition and Metabolism, 2022. 47(6): p. 671-680.
5. Nicklas, B.J., A.C. Hackney, and R.L. Sharp, The Menstrual-Cycle and Exercise - Performance, Muscle Glycogen, and Substrate Responses. International Journal of Sports Medicine, 1989. 10(4): p. 264-269.
6. Oosthuyse, T. and A.N. Bosch, The Effect of the Menstrual Cycle on Exercise Metabolism Implications for Exercise Performance in Eumenorrhoeic Women. Sports Medicine, 2010. 40(3): p. 207-227.
7. Price, T.B. and K. Sanders, Muscle and liver glycogen utilization during prolonged lift and carry exercise: male and female responses. Physiological Reports, 2017. 5(4).
8. Bawden, S.J., et al., A Low Calorie Morning Meal Prevents the Decline of Hepatic Glycogen Stores: A Pilot in vivo 13C Magnetic Resonance Study. Food and Function, 2014. 5(9): p. 2237 - 2242.
9. Bawden, S., et
al., Increased liver fat and glycogen
stores following high compared with low glycaemic index food: a randomized
cross over study. Diabetes Obes Metab, 2016.
Figures