2041
Multicompartmental restriction spectrum imaging model for characterizing liver fibrosis in a mouse model1Department of Radiology, Second Xiangya Hospital, Central South University, Changsha, China, 2Department of Oncology, Second Xiangya Hospital, Central South University, Changsha, China, 3Department of Radiology, Maternal and Child Health Hospital of Hubei Province, Wuhan, China, 4Shenzhen United Imaging Research Institute of Innovative Medical Equipment, Shenzhen, China, 5MR Collaboration, Central Research Institute, United Imaging Healthcare, Shanghai, China
Synopsis
Keywords: Liver, Animals
Liver fibrosis is a serious medical issue and noninvasive technique, such as magnetic resonance imaging (MRI), is required to identify and quantify liver fibrosis. Recently, several advanced diffusion MRI signal models that employ additional parameters to describe diffusion signals from complex microstructural compartments have been developed. The purpose of this study was to apply the multicompartmental restriction spectrum imaging (RSI) model to evaluate carbon tetrachloride (CCl4)-induced liver fibrosis in mice. The optimal model to characterize liver fibrosis was the 4-compartment RSI model. Compared to control groups, mice with liver fibrosis exhibited significantly lower ADC and C3, but higher C1.
Introduction
Liver fibrosis is a serious medical issue with a high morbidity rate and is a clinical sequela of the wound-healing response to recurrent damage, including that caused by hepatitis B and C, alcohol use, and fatty liver disease. Regression at this stage is essential in halting the progression of chronic liver diseases since liver fibrosis is a process that may be reversed. The current gold standard for identifying, classifying, and monitoring chronic liver disorders (CLD) is liver biopsy. For a qualitative evaluation of fibrosis, histologic analysis of liver tissue is helpful. However, because only a tiny section of the liver is sampled during a liver biopsy, disease heterogeneity cannot be identified. Furthermore, liver biopsies are invasive procedures that result in significant pain in 40% of patients and major complications in 0.5% of cases [1]. A noninvasive technique, such as magnetic resonance imaging (MRI), is required to identify and quantify liver fibrosis in CLD. In recent years, several advanced diffusion MRI signal models that employ additional parameters to describe diffusion signals from complex microstructural compartments have been developed. By utilizing a multi-shell diffusion acquisition and high b-values, restriction spectrum imaging (RSI), a unique multicompartmental diffusion model, accounts for cellular geometry and compartmentalization [2]. Carbon tetrachloride (CCl4), a commonly used laboratory reagent marked by its toxicity leading to liver lesions and liver fibrosis, has been extensively applied in liver-related studies. The purpose of this study was to apply the multicompartmental RSI model to evaluate CCl4-induced liver fibrosis in mice.Methods
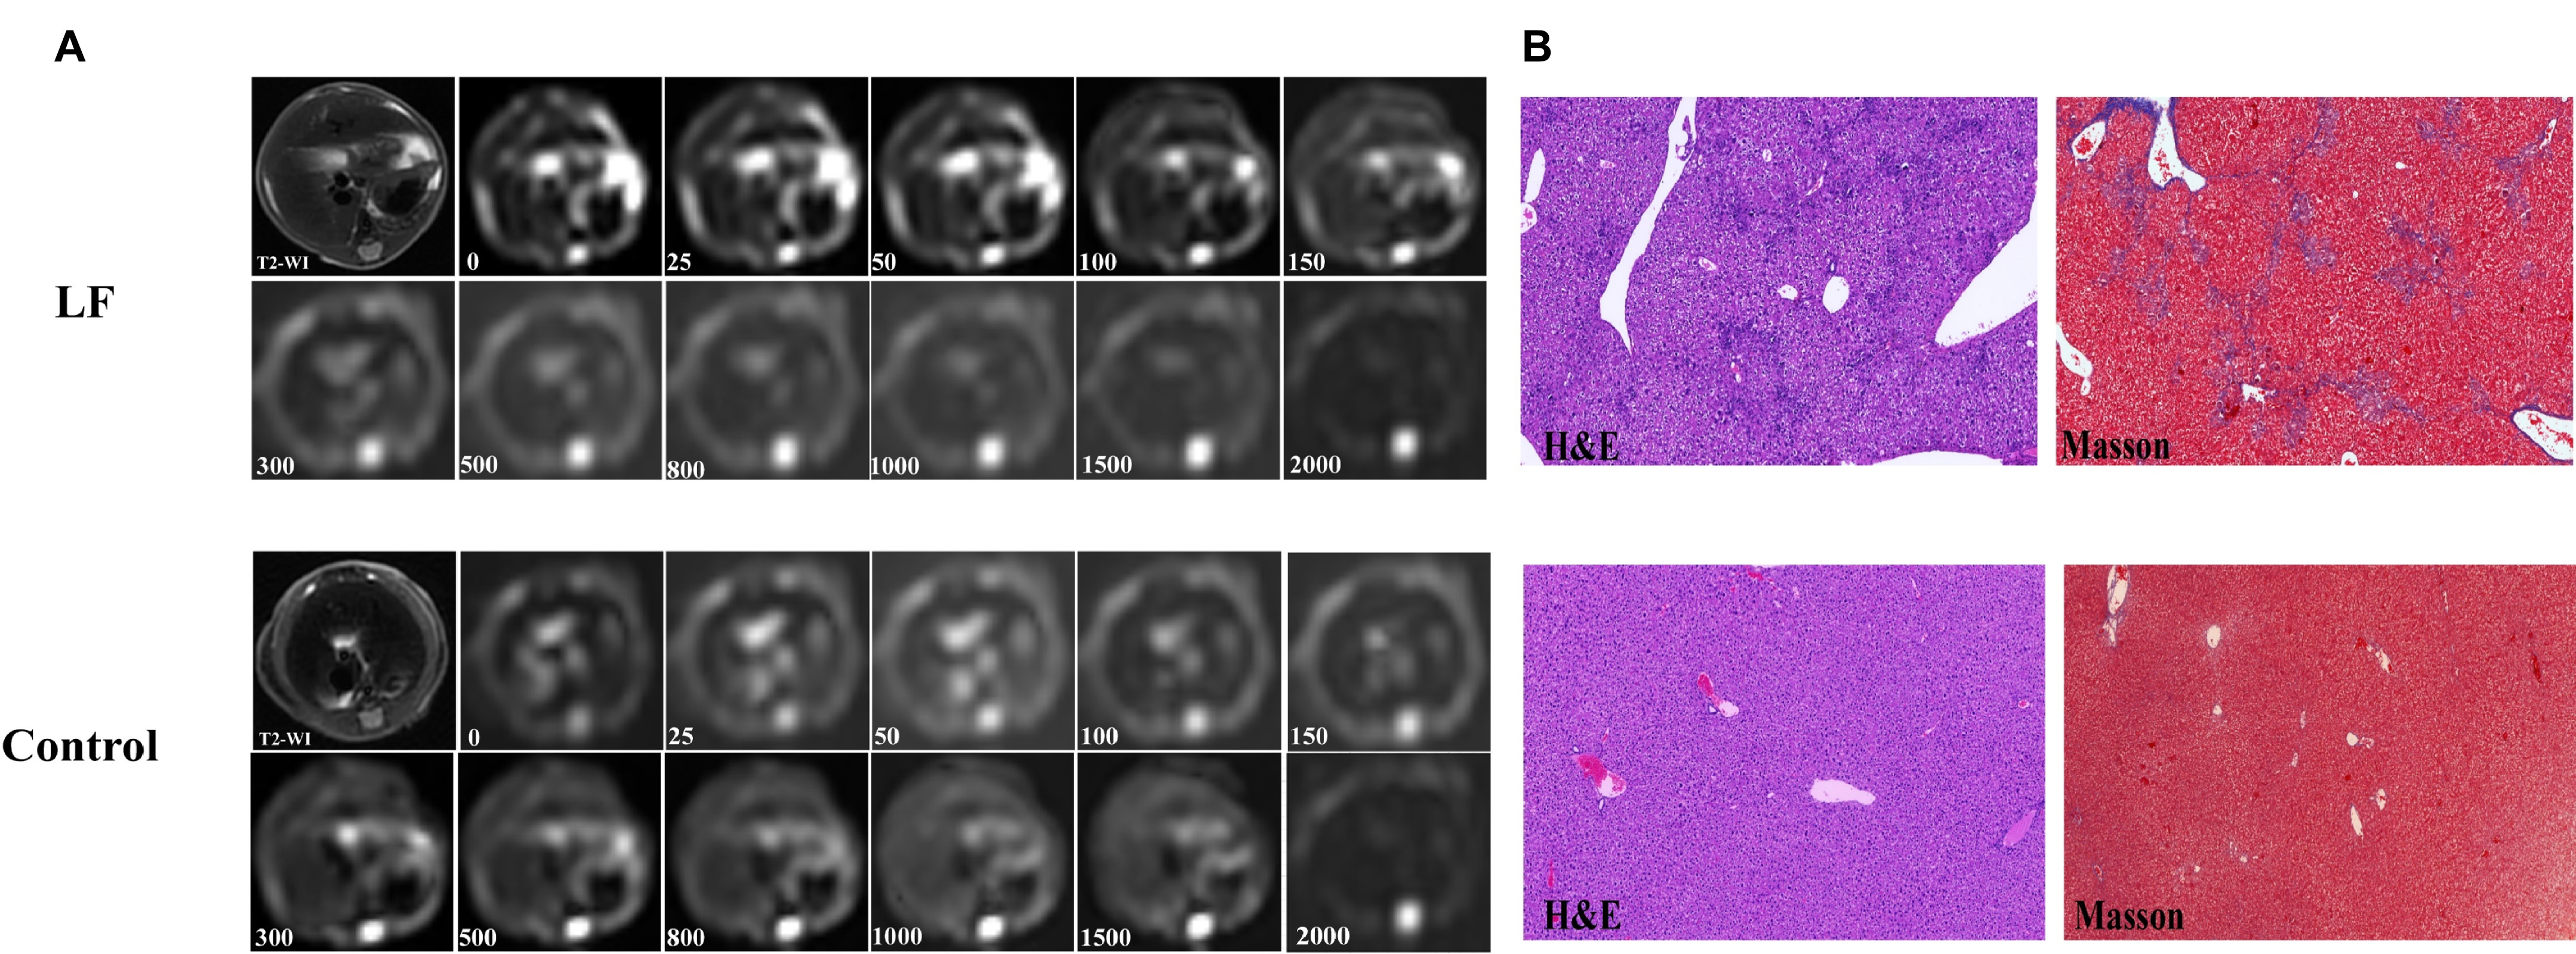
A total of 30 CCl4-induced liver fibrosis mice and 8 control mice were included in this study. Figure 1 shows representative images of T2-weighted imaging, diffusion-weighted imaging, and corresponding pathologic tissue slices for mice with and without liver fibrosis. Multi-b-values diffusion-weighted imaging (DWI) (echo planar imaging sequence in the axial plane, repetition time: 2000 ms, echo time: 80 ms, flip angle: 90°, slice thickness: 2 mm, field of view: 75 × 75 mm2, matrix: 128 × 128, bandwidth = 1250 Hz/pixel, b-values: 0, 25, 50, 100, 150, 300, 500, 800, 1000, 1500, 2000 s/mm2) was performed on a 3T scanner (uMR790, United Imaging Healthcare, Shanghai, China). The conventional mono-exponential model was applied to compute the apparent diffusion coefficient (ADC) by using images from two b-values, 0 and 800 s/mm2. The voxel intensity is given by$$$S=S_0exp[-bADC]$$$
where S0 is the signal intensity without diffusion weighting and b is the diffusion-sensitizing factor.
The RSI model is defined by
$$$S(b) = \sum_i^k{C^ie^{-bD_i}}$$$
where S(b) are signal intensities at different b-values, k is the number of tissue compartments, Ci describes the contribution of a particular compartment to the overall signal and Di is the compartmental ADC. The compartments are arranged in decreasing order of D, with the first compartment (C1) describing the most restricted form of diffusion in each model. With K ranging from 2 to 5, a global fitting of the model to the multi-shell DWI data from all voxels within the normal and fibrotic tissue ROIs was performed to determine optimal k and Di values.
The Bayesian Information Criterion (BIC) was calculated for each model to determine the optimal model. Conventional ADC values and Di values of each compartment in the optimal RSI model were compared between the liver fibrosis and control group using the Mann-Whitney test. The receiver operating characteristics (ROC) curve was performed to determine the diagnosis performance. P-value < 0.05 was considered statistically significant.
Results
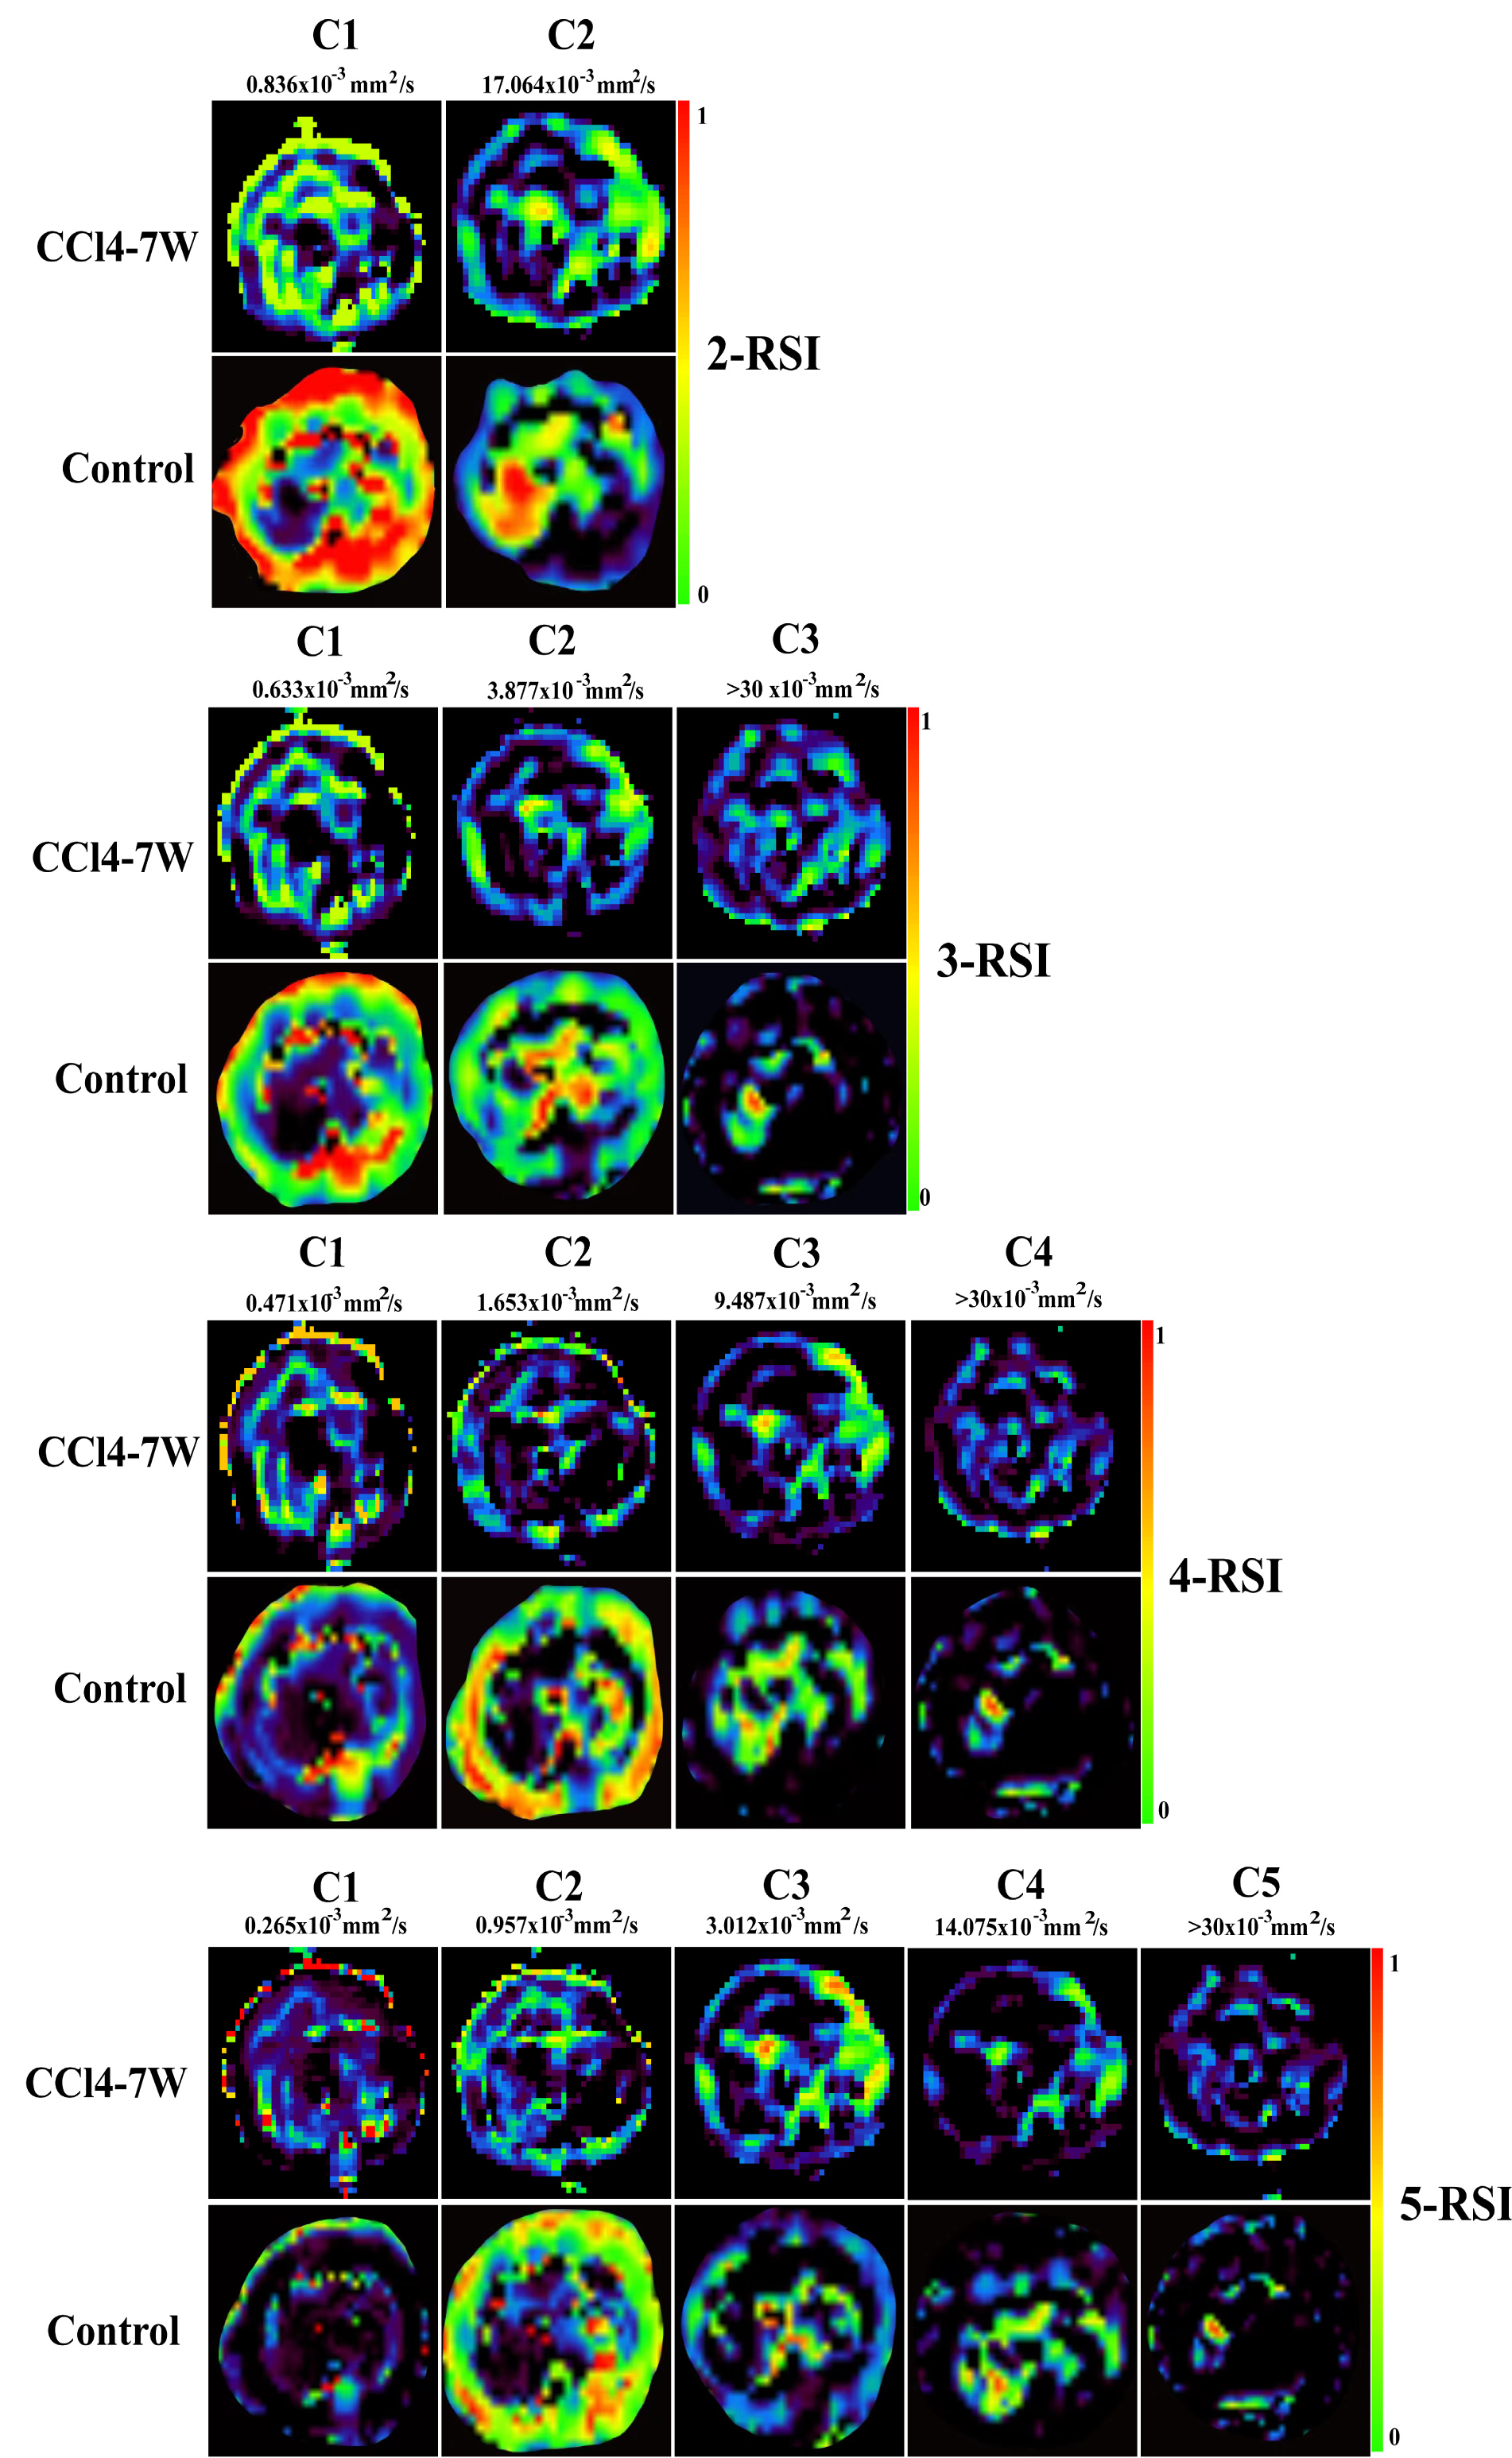
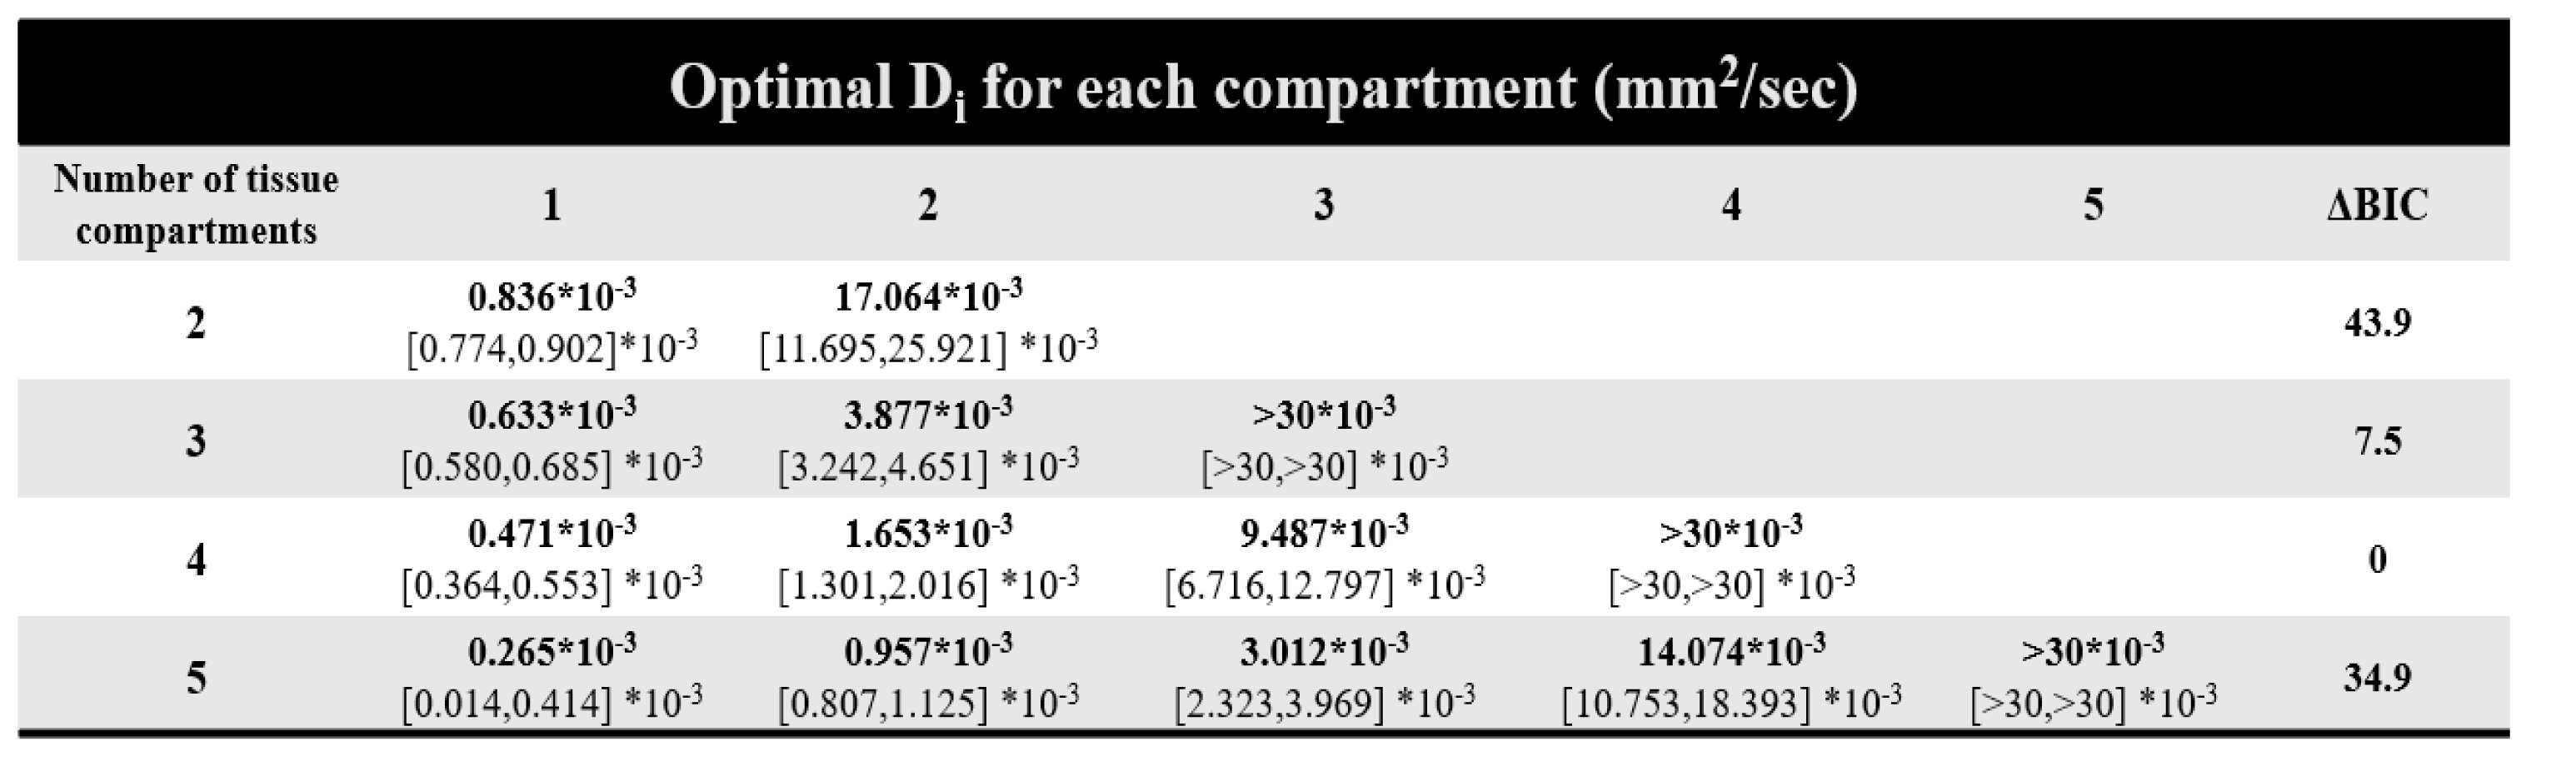
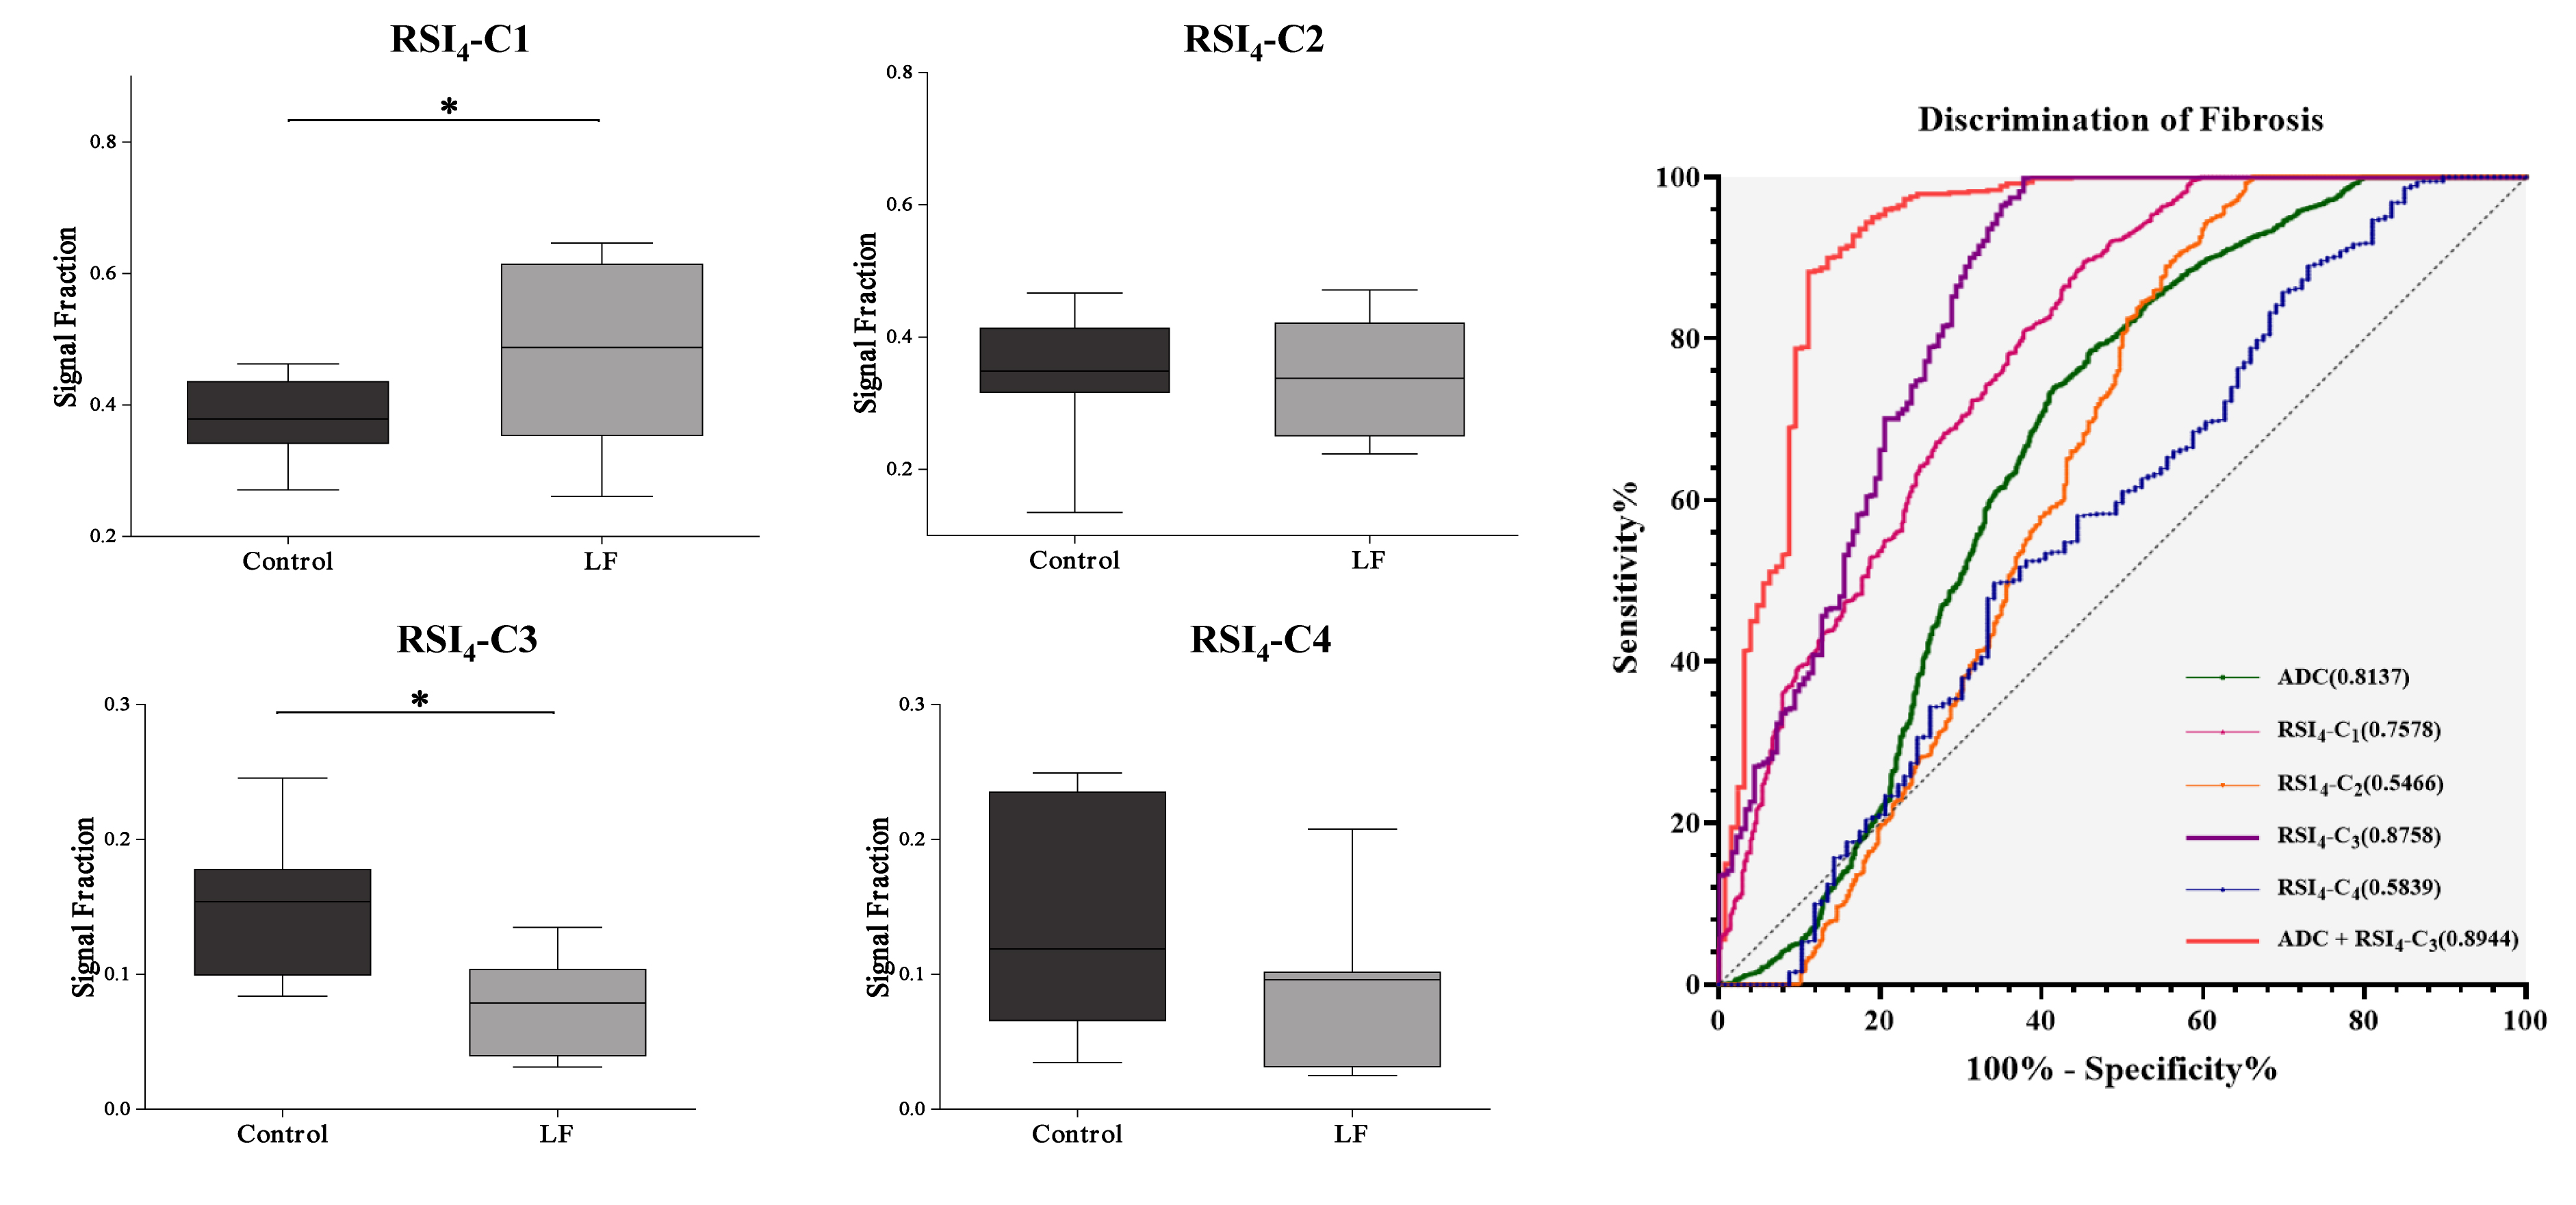
All mice in the liver fibrosis group were histologically diagnosed with liver fibrosis (100%). Figure 2 shows the signal-contribution maps (Ci) calculated from the RSI models. According to the BIC results (Table1), the optimal model to characterize liver fibrosis was the 4-compartment RSI model with optimal ADCs of 0.471×10⁻³, 1.653×10⁻³, 9.487×10⁻³, and >30×10-3. Compared to control groups, mice with liver fibrosis exhibited significantly lower ADC (P = 0.018) and signal contribution fraction of C3 (P = 0.011), as well as higher C1 (P = 0.048). ROC analysis results showed that RSI4-C3 was the best single diffusion parameter for characterizing liver fibrosis (AUC = 0.876, P = 0.003). The combination of ADC value and RSI4-C3 value increased the diagnostic performance. (AUC = 0.894, P = 0.002).Discussion
The discriminatory performance of RSI4-C1 relies on the RSI approach of separating the overall diffusion signal into compartments believed to correspond to restricted diffusion, hindered diffusion, free water, and rapid pseudo-diffusion. C1 is the most diffusion-restricted compartment, while C3 is the free-water diffusion compartment. Compared to control groups, mice with liver fibrosis exhibited significantly lower ADC and C3, but higher C1. These results could be explained by restricted diffusion caused by the deposition of glycosaminoglycans, proteoglycans, and collagen fibers in the diseased liver [3]. This study only focused on the characterization of liver fibrosis, further study of the RSI model in staging liver fibrosis is warranted.Conclusion
In conclusion, the 4-compartment RSI model was able to characterize CCl4-induced liver fibrosis in mice. Compared to control groups, mice with liver fibrosis exhibited significantly lower ADC and C3, but higher C1. RSI4-C3 showed the best diagnosis performance among all the parameters. The combination of ADC value and RSI4-C3 value increased the diagnostic performance.Acknowledgements
No acknowledgement found.References
1. Thampanitchawong, Pornpen, and Teerha Piratvisuth. “Liver biopsy: complications and risk factors.” World journal of gastroenterology vol. 5,4 (1999): 301-304.
2. White, Nathan S et al. “Diffusion-weighted imaging in cancer: physical foundations and applications of restriction spectrum imaging.” Cancer research vol. 74,17 (2014): 4638-52.
3. Annet, Laurence et al. “Assessment of diffusion-weighted MR imaging in liver fibrosis.” Journal of magnetic resonance imaging: JMRI vol. 25,1 (2007): 122-8. doi:10.1002/jmri.20771
Figures