2039
Magnetic Resonance Elastography: A Comparison with Virtual Diffusion Derived Elastography
Jonatan Eriksson1,2, Wolf Bartholomä2,3, Nils Dahlström2,3, Jens Tellman1,2, Stergios Kechagias4, Patrik Nasr4, Mattias Ekstedt2,4, Peter Lundberg1,2, and Johan Kihlberg2,3
1Department of Medical Radiation Physics, and Department of Health, Medicine and Caring Sciences, Linköping University, Linköping, Sweden, 2Center for Medical Imaging Science and Visualization, Linköping University, Linköping, Sweden, 3Department of Radiology in Linköping and Department of Health Medicine and Caring Sciences, Linköping University, Linköping, Sweden, 4Division of Diagnostics and Specialist Medicine, Department of Health, Medicine and Caring Sciences, Linköping University, Linköping, Sweden, Linköping, Sweden
1Department of Medical Radiation Physics, and Department of Health, Medicine and Caring Sciences, Linköping University, Linköping, Sweden, 2Center for Medical Imaging Science and Visualization, Linköping University, Linköping, Sweden, 3Department of Radiology in Linköping and Department of Health Medicine and Caring Sciences, Linköping University, Linköping, Sweden, 4Division of Diagnostics and Specialist Medicine, Department of Health, Medicine and Caring Sciences, Linköping University, Linköping, Sweden, Linköping, Sweden
Synopsis
Keywords: Liver, Elastography, MRE, Diffusion
A virtual manner of determining apparent stiffness values from diffusion images, so called ‘vMRE’, was evaluated in this study which included both healthy subjects and patients with Non-Alcoholic Fatty Liver Disease (NAFLD). No association was observed between true MR-Elastography (MRE) and vMRE. However, the difference between MRE and vMRE was more strongly correlated with T2*. Iron deposition is not uncommon in patients with NAFLD, and for that reason, a spin echo-MRE sequence was used, instead of the gradient-based sequence that has been used previously. Iron deposition in liver shortens T2*, which can also affect diffusion images and the vMRE.Introduction
Liver disease is a rapidly increasing global problem concerning public health. All chronic liver disease may eventually progress into advanced fibrosis and cirrhosis. The disease progression is not linear in terms of quantification, however, at later stages the means to treat and cure fibrosis are limited, the treatment is instead focused on relieving the symptoms. Magnetic Resonance Elastography (MRE) has shown great potential in terms of providing quantitative values of mechanical tissue properties, which is used to quantify the stiffness of the liver, which is a measure of fibrosis [1], but requires additional hardware and software. In 2017 an approach to generate ‘virtual MRE’ (vMRE) from MR-diffusion (DWI) data was suggested [2]. The aim of this study was to investigate the correlation between MRE, vMRE, relaxometry and fat fraction in a group with mild Non-Alcoholic Fatty Liver Disease (NAFLD) and in healthy subjects.Methods
A total number of 14 subjects, nine patients with NAFLD and five healthy subjects (characteristics in Table 1) underwent a multi-parametric MRI examination at 3 T (Philips Ingenia, Best, The Netherlands) including MRE, DWI, mDixon and T1 Molli.The MRE, DWI and T1 acquisitions were planned in four slices according to a conventional protocol [1] and the mDixon [3] covered the entire liver. MRE data was acquired using a research Spin echo (SE) based pulse sequence with parameters: field-of-view (FoV), 450x405 mm2; matrix size, 76x66 (reconstructed, 320); slice thickness, 10 mm; Echo-planar imaging (EPI) single shot SE; Repetition Time (TR), 1000 ms; Echo Time (TE), 54 ms; and fat suppression. For the MRE setup, a commercially available 2D MRE-apparatus (Resoundant Inc., Rochester, MN). The acoustic transducer was used with a frequency of 60 Hz and a body weight-based adjustment of amplitude, and executed during single breath holds of 13 s.
The DWI acquisition parameters: FoV, 446x400 mm2; matrix of 147x132 (reconstructed 384); slice thickness, 10 mm; EPI single shot SE with TR, 4000 and TE, 56 ms; b-factors (averages) of 0 (1), 200 (1) and 1500 (10); sense factor, 4; EPI-factor, 47; fat suppression. Scan duration during free breathing was 4:36 minutes.
T1 maps were derived from a Molli sequence [4]. Acquisition parameters: FoV, 450x405 mm2 using a matrix of 196x178 (reconstructed 400); slice thickness, 10 mm. The pulse sequence was a cardiac triggered inverted linear single shot gradient echo with TR, 2.0 ms; TE, 0.92 ms; inversion time, 350 ms; sense factor, 2; flip angle, 20 deg. Typical breath hold time was 12 s.
MRE elastograms were derived by using the scanner integrated software. Fat fraction (PDFF) and T2* maps were obtained from the mDixon data. ROIs for MRE and mDixon was drawn by an experienced radiologist, according to recommended routines to avoid vessels, bile ducts and hot spots for MRE.
For mDixon images, four equal circular ROIs were distributed in three levels on the right liver lobe and in the middle of the left lobe of the liver. The mean value from the ROIs was used.
Virtual MREs were calculated as follows:
μdiff=α·ln(S200/S1500)+β
where S200 and S1500 are the signal intensities in the images acquired with b-value 200 and 1500, respectively, α=-9.8 and β=14 was obtained from [2]. Generation and ROI placement in the vMREs were performed using in-house developed software (Matlab, Natick, Massachusetts, United States). Correlation was examined using linear regression, pairwise comparisons were evaluated by paired Students’ t-tests and group comparisons by using Students’ t-tests.
Results
All 14 subjects underwent MRI examination, no subjects were excluded. MRE data were calculated as the mean from four ROIs; for patients 2.11±0.37 [kPa]) and Healthy subjects 2.01±0.27 [kPa] (p-value: 0.13). vMRE for patients were 4.67±2.57 [kPa] vs. Healthy subjects 2.73±0.48 [kPa] (mean±SD, p-value: 0.58) (Figure 1). No association was found between MRE and vMRE (Figure 2). The three patients with highest vMRE value in Figure 2 had rather short T2*. Correlation between ΔMRE (i.e. (vMRE-MRE)) was tested for both PDFF, T2* and T1. A strong correlation was observed between ΔMRE and T2*, r2=0.768, while no correlation to PDFF and T1 was observed (Figure 3).Discussion
In our study population, which was part of a larger ongoing study, we did not find a correlation between MRE and vMRE. We used a SE-based MRE sequence [5] as opposed to the GRE based MRE sequence that was used in [2], in order to minimize the effects of iron induced relaxation effects. The most interesting observation was a strong correlation between the difference between MRE and vMRE and T2*. The notable T2* lowering in the NAFLD group indicates iron load, which is not uncommon, and it might have affected the DWI results at 3 T as susceptibility artefacts. The subjects in this study were affected by mild disease only, and they had not yet developed severe fibrosis. A larger population group with different fibrosis grades will be required to provide more detailed results.Conclusion
We did not find a clear correlation between MRE and vMRE. Moreover, we attributed the findings to the use of (1) a different MRE sequence (SE vs GRE), and (2) a significant iron accumulation in some subjects, which would affect the DWI acquisition in terms of susceptibility artefacts.Acknowledgements
No acknowledgement found.References
- Ehman RL (2022) Magnetic resonance elastography: from invention to standard of care. Abdominal Radiology 47:3028-3036
- Le Bihan D, Ichikawa S, Motosugi U (2017) Diffusion and intravoxel incoherent motion MR imaging–based virtual elastography: a hypothesis-generating study in the liver. Radiology 285:609-619
- Kukuk GM, Hittatiya K, Sprinkart AM et al (2015) Comparison between modified Dixon MRI techniques, MR spectroscopic relaxometry, and different histologic quantification methods in the assessment of hepatic steatosis. European Radiology 25:2869-2879
- Messroghli DR, Radjenovic A, Kozerke S, Higgins DM, Sivananthan MU, Ridgway JP (2004) Modified Look-Locker inversion recovery (MOLLI) for high-resolution T1 mapping of the heart. Magnetic Resonance in Medicine 52:141-146
- Ehman RL (2020) re: Comparison of Technical Failure of MR Elastography for Measuring Liver Stiffness Between Gradient-Recalled Echo and Spin-Echo Echo-Planar Imaging: A Systematic Review and Meta-Analysis. Journal of Magnetic Resonance Imaging 51:1103-1104
Figures
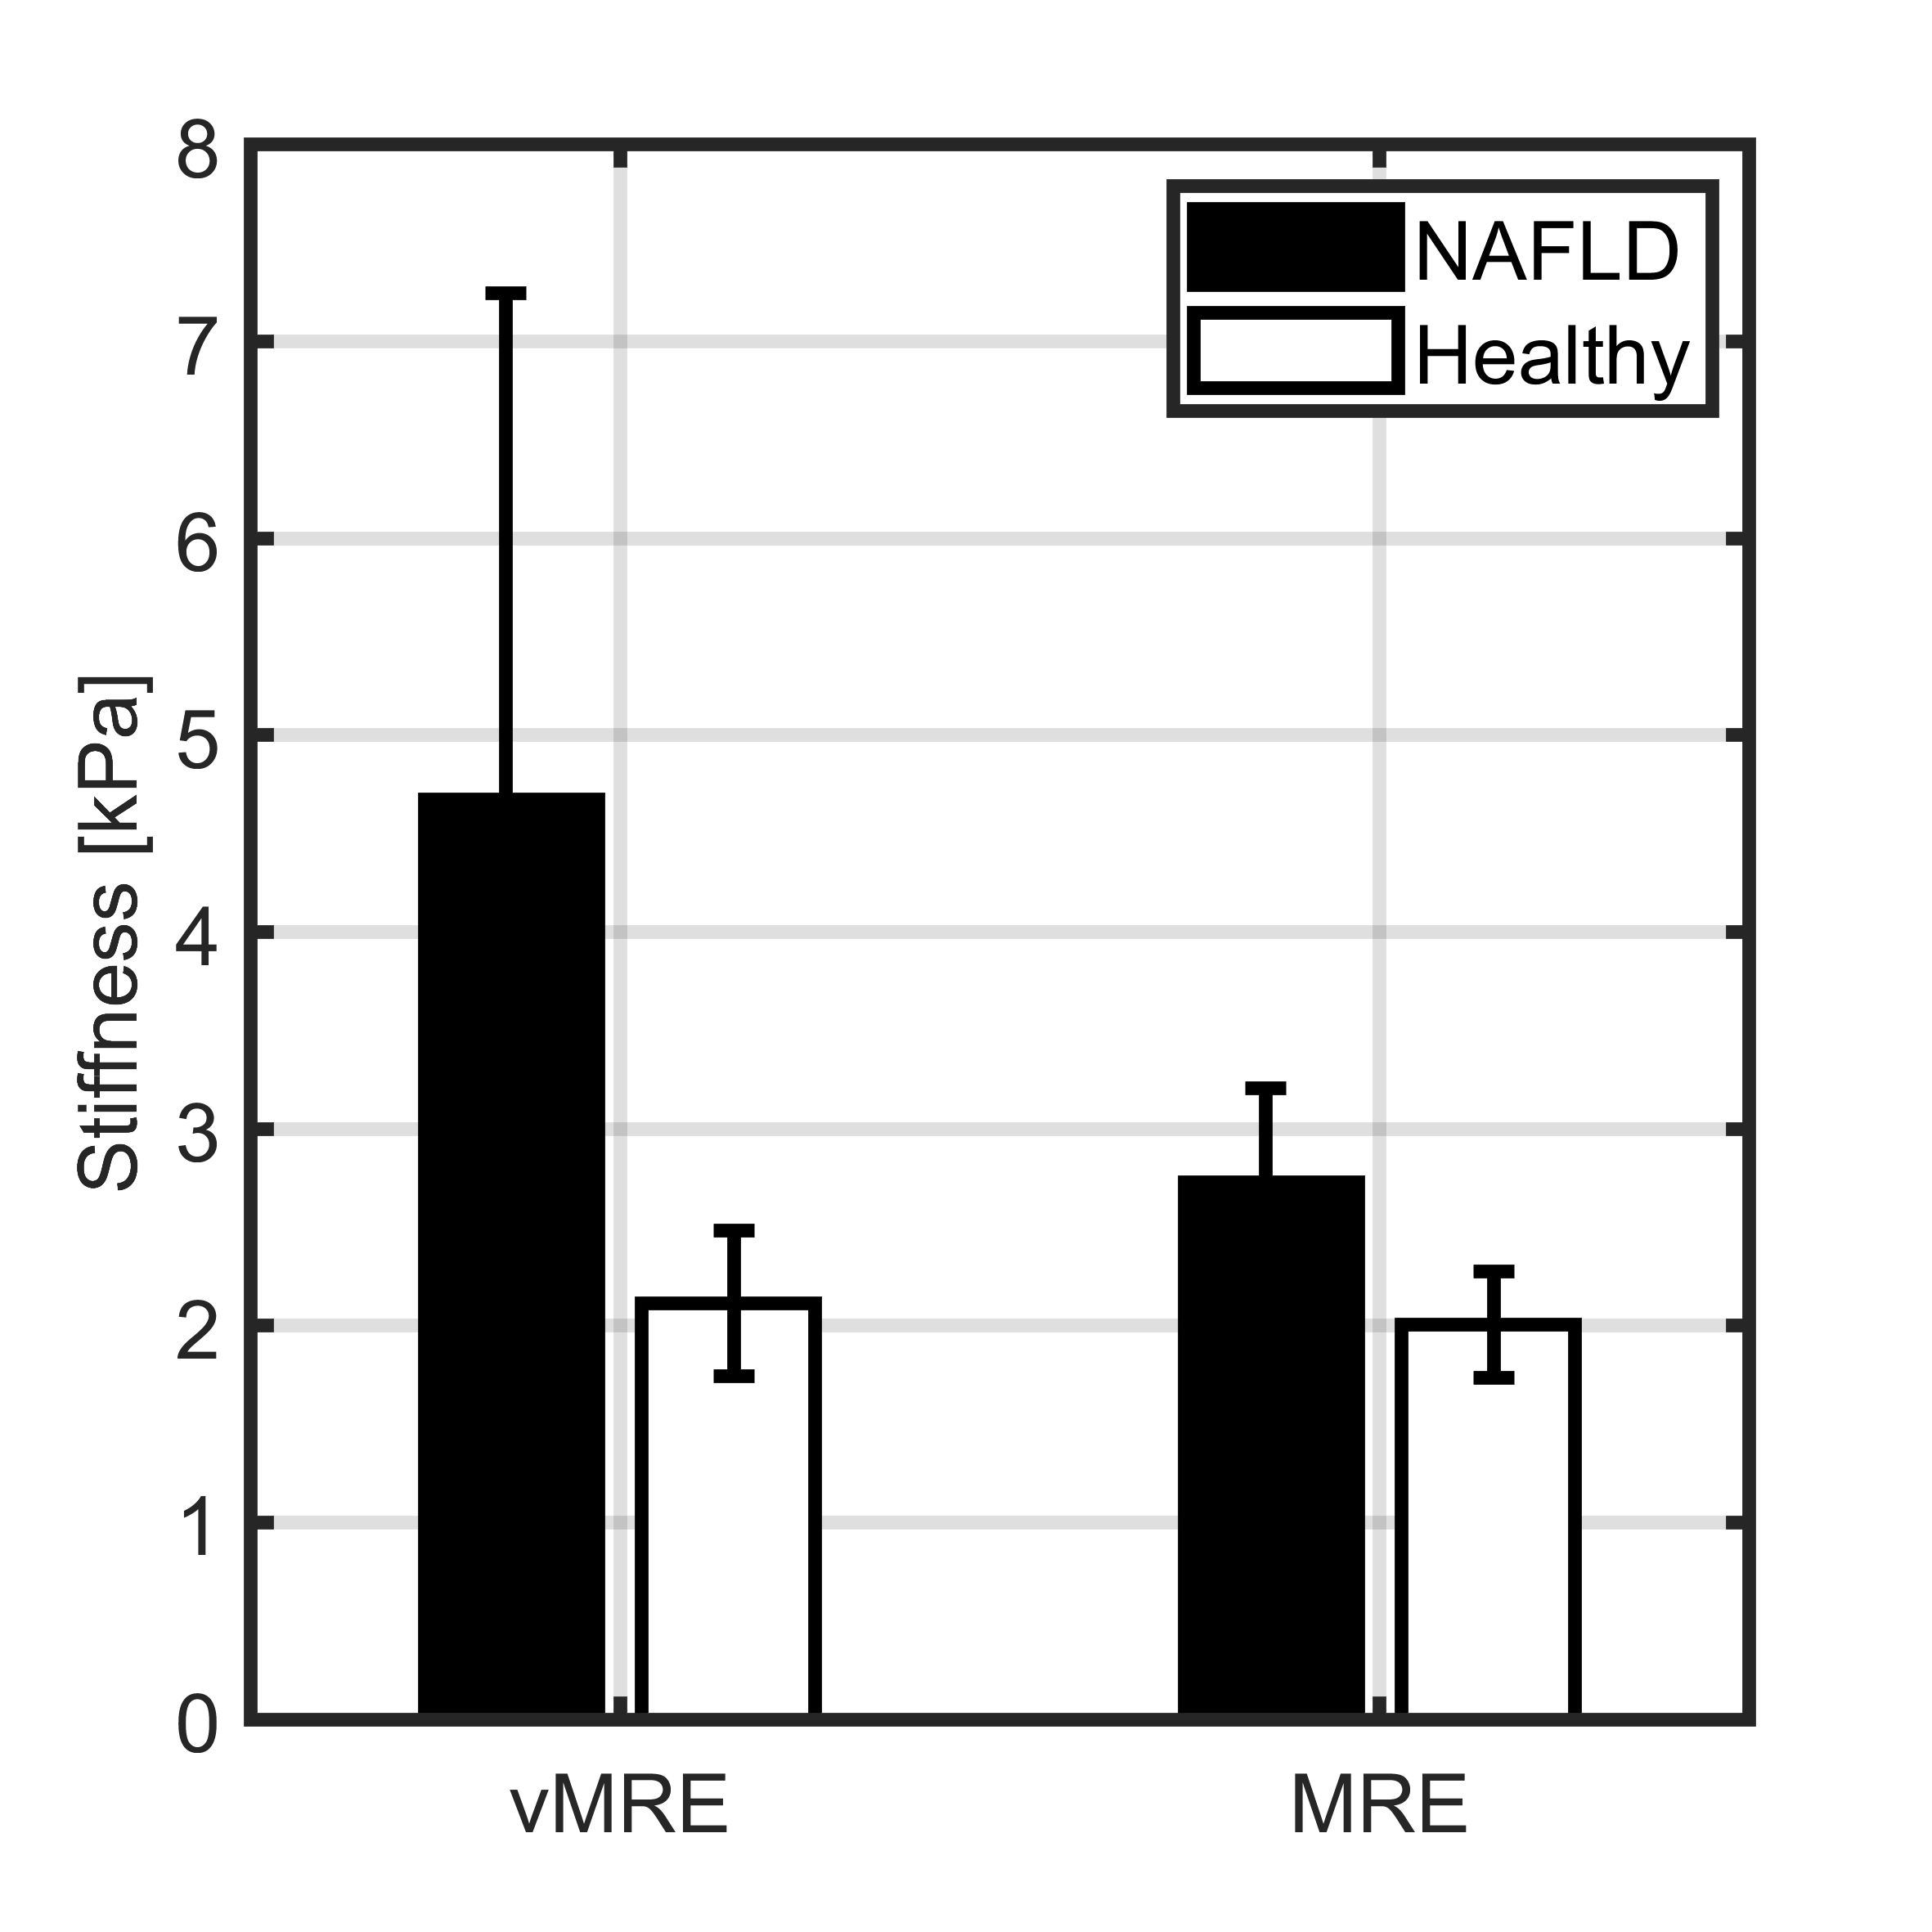
Figure 1. Stiffness values [kPa] from virtual Magnetic Resonance Elastography (vMRE) as well as MRE, in the patient group (black bars, mean values) and the healthy subjects (white bars, mean values), the error bars indicate the standard deviation.
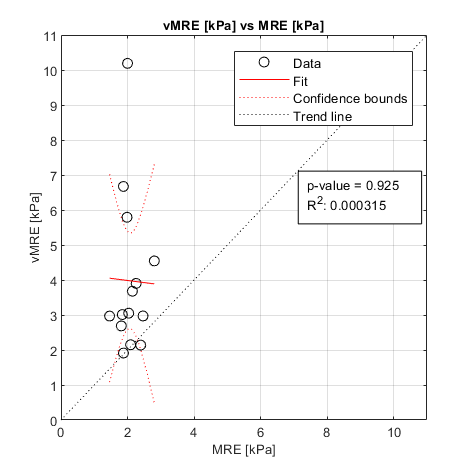
Figure 2. Scatter plot of diffusion based ‘virtual Magnetic Resonance Elastography’ (vMRE) vs MRE values. No apparent correlation was found between these values.
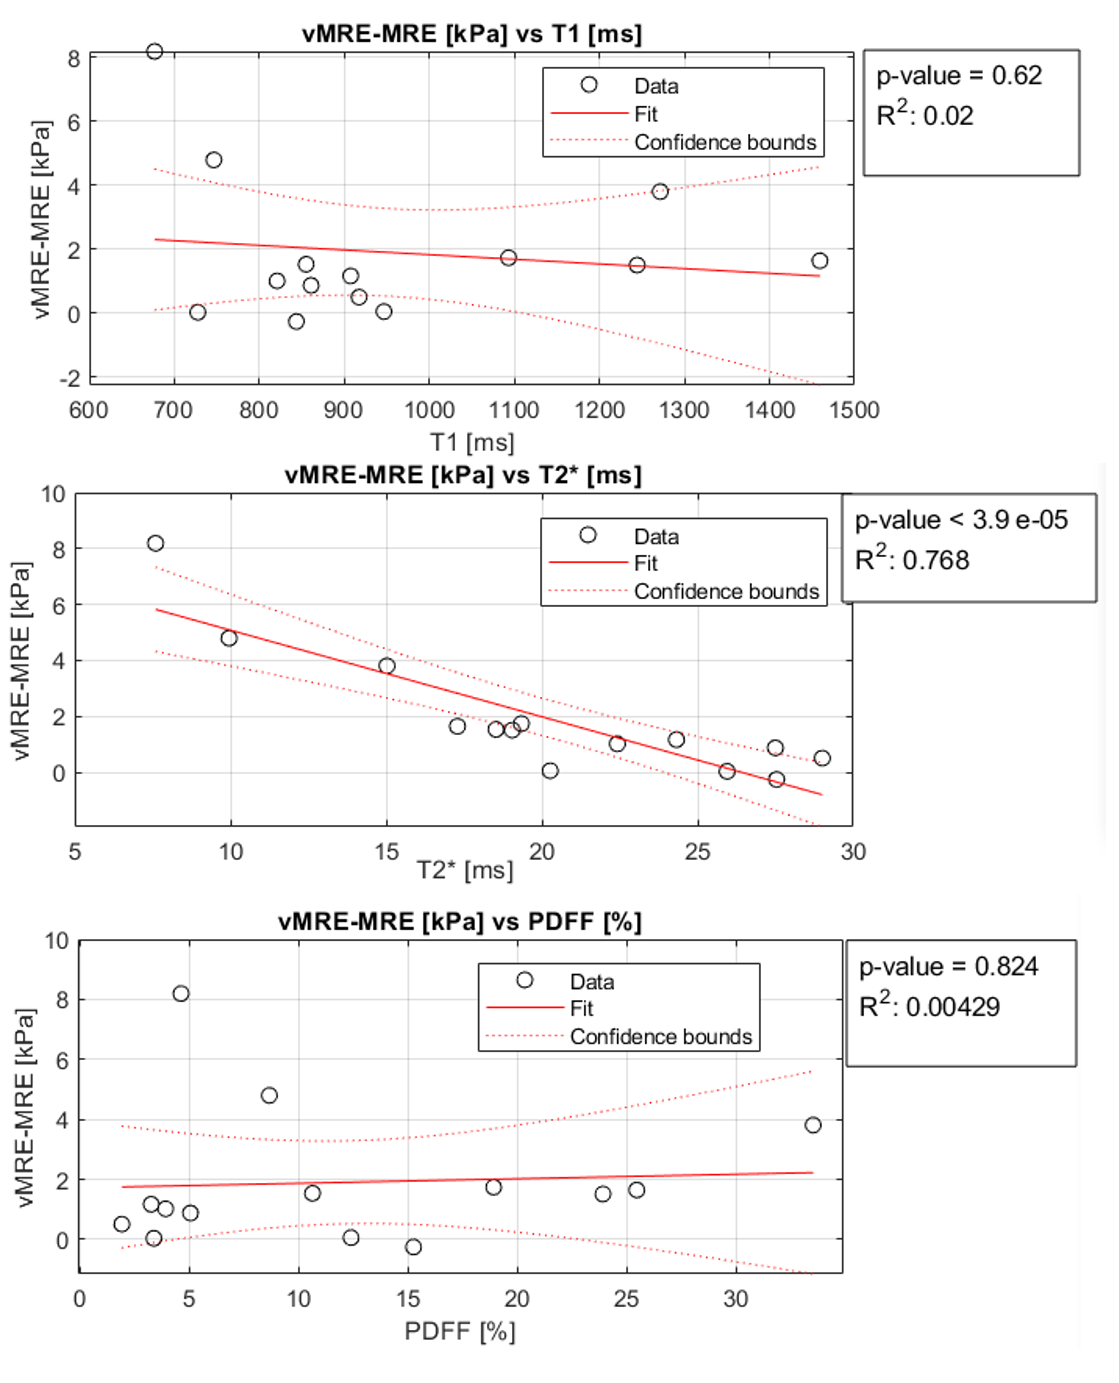
Figure 3. Scatter plots of ΔMRE (vMRE-MRE) virtual Magnetic Resonance Elastography (vMRE) vs MRE values. Top panel show ΔMRE vs T1, no correlation is found. Middle panel: ΔMRE vs T2*, here a strong correlation is found, bottom panel: ΔMRE vs T1, no correlation observed.
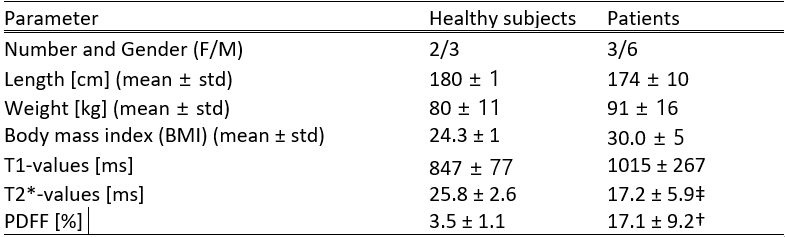
Table 1. Demographics and MRI parameters:
T1, T2* and fat fraction (PDFF) in the study population† p
< 0.01 patients vs healthy, ‡ p < 0.01
DOI: https://doi.org/10.58530/2023/2039