2038
Assessing Liver Fibrosis with Diffusion-weighted MRI-based Virtual Elastography
Li Yang1, Caixia Fu2, and Mengsu Zeng3
1Department of Radiology, Zhongshan Hospital,Fudan University, Shanghai, China, 2MR Application Development, Siemens Shenzhen Magnetic Resonance Ltd, Shenzhen, China, 3Zhongshan Hospitai,Fudan University, shanghai, China
1Department of Radiology, Zhongshan Hospital,Fudan University, Shanghai, China, 2MR Application Development, Siemens Shenzhen Magnetic Resonance Ltd, Shenzhen, China, 3Zhongshan Hospitai,Fudan University, shanghai, China
Synopsis
Keywords: Liver, Diffusion/other diffusion imaging techniques
Recently, diffusion-weighted (DW) imaging–based elastography was proposed for noninvasive liver staging by converting a shifted apparent diffusion coefficient (sADC) to tissue elasticity on the basis of two b values (200 and 1500sec/mm2). We retrospectively calculated sADC from DW MRI and converted it to DW MRI–based virtual shear modulus (µDiff) for evaluating liver fibrosis in 90 patients. Our results showed the µDiff was significantly correlated with liver fibrosis stage, and the areas under the curves were 0.864 and 0.821 for significant and advanced fibrosis, respectively, indicating DW imaging–based elastography is a promising method for predicting liver fibrosis.Introduction
Recently, diffusion-weighted (DW) imaging–based elastography was proposed for noninvasive liver staging by converting a shifted apparent diffusion coefficient (sADC) to tissue elasticity on the basis of two b values (200 and 1500sec/mm2)1. The purpose of this study was to evaluate the liver fibrosis by using diffusion-weighted (DW) MRI–based elastography, with histopathological findings as the reference standard.Methods
This retrospective study included 90 patients (66 men and 24 women; mean age, 56.6±9.7 years; age range, 27–75 years) who underwent multiple b-values DW MRI with a 1.5T MR scanner (MAGNETOM Aera, Siemens Healthcare, Erlangen, Germany). Shifted apparent diffusion coefficient was calculated from DW MRI (b=200 and 1500 sec/mm2) and converted to DW MRI–based virtual shear modulus (µDiff) by using an in-house developed program based on MATLAB (Mathworks, Natick, Mass) according to the method proposed in the previous studies1-2. Liver fibrosis stage was histologically determined according to Scheuer scoring system: S0 (n=16), S1 (n=11), S2 (n=11), S3 (n=16) and S4 (n=36). The correlation between µDiff with fibrosis stage was assessed by Spearman's rank correlation coefficient. Receiver operating characteristic (ROC) curves for µDiff were built to assess its diagnostic value in identifying different stages of liver fibrosis.Results
The representative sADC map and DW MRI–based elastography were shown in Fig.1. The median values of µDiff for significant fibrosis (S≥2) were 5.305kp, and for advanced fibrosis (S≥3) were 5.380kp, respectively. The µDiff showed a significant correlation with liver fibrosis stage (rho=0.55, P<0.001). The ROC curves of µDiff for the diagnosis of significant fibrosis and advanced fibrosis are shown in the Fig. 2, and the areas under the curves were 0.864 and 0.821, with cutoff of >4.515kp and >4.945kp, respectively.Discussion
Diffusion-weighted (DW) imaging can explore the increased hindrance of diffusion in water protons with the increased connective tissue in fibrotic liver parenchyma1. DW imaging–based elastography staging liver fibrosis by converting a sADC to tissue elasticity with two b values (200 and 1500 sec/mm2), chosen theoretically and experimentally to provide an optimized sensitivity to both Gaussian and non-Gaussian diffusion1,2. Previous studies have demonstrated highly significant correlation between sADC and MR elastography1,2.Conclusion
DW MRI–based elastography is a promising method for predicting liver fibrosis.Acknowledgements
No.References
1. Marie-Luise Kromrey, Denis Le Bihan, Shintaro Ichikawa, Utaroh Motosugi. Diffusion-weighted MRI-based Virtual Elastography for the Assessment of Liver Fibrosis. Radiology. 2020, 295(1):127-135.
2. Denis Le Bihan,Shintaro Ichikawa, Utaroh Motosugi. Diffusion and intravoxel incoherent Motion MR imaging–based Virtual elastography: A Hypothesis-generating Study in the Liver. Radiology. 2017, 285(2):609-619
Figures
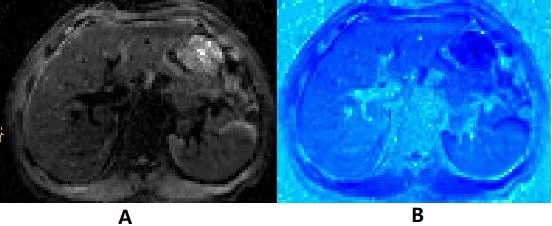
Fig 1.The representative shifted apparent diffusion coefficient map (A) and DW MRI–based elastography (B).
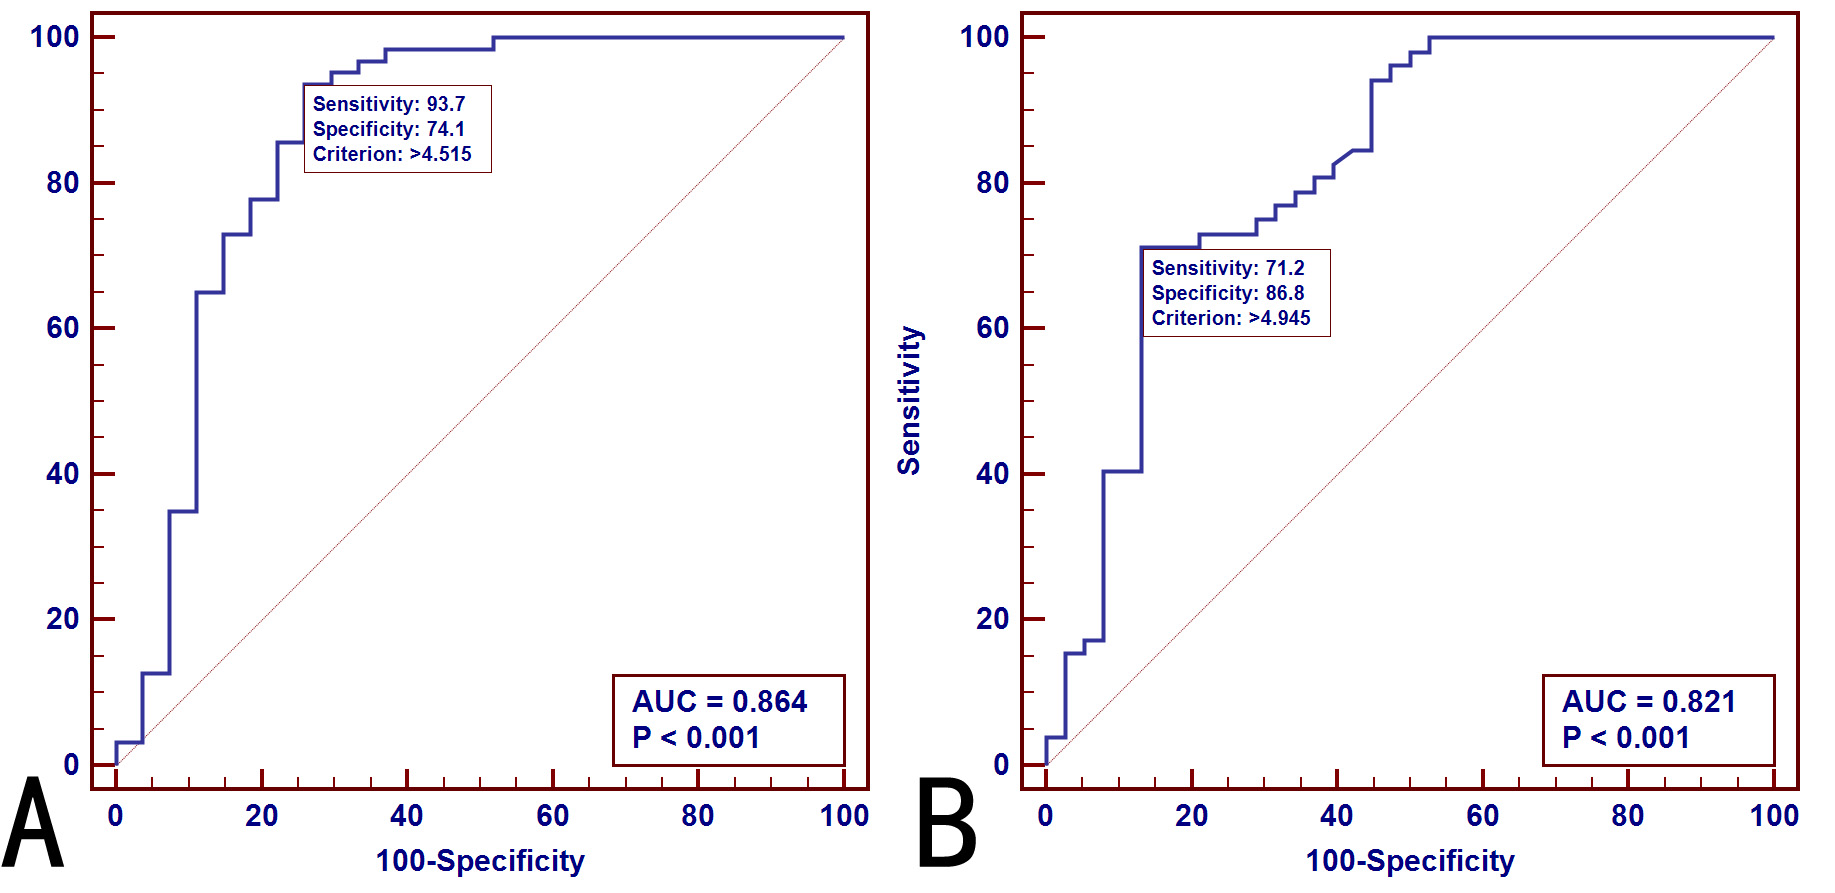
Fig 2.ROC curves and areas under the curves of DW MRI–based
elastography (µDifff ) for the prediction of
significant fibrosis (S≥2; A) and advanced fibrosis (S≥3; B).
DOI: https://doi.org/10.58530/2023/2038