2030
Nonsusceptibility frequency contributions and brain size affect quantitative susceptibility mapping in a region-dependent manner1Department of Computer Science and Automation, Technische Universität Ilmenau, Ilmenau, Germany, 2Buffalo Neuroimaging Analysis Center, Department of Neurology at the Jacobs School of Medicine and Biomedical Sciences, University at Buffalo, The State University of New York, Buffalo, NY, United States, 3Center for Biomedical Imaging, Clinical and Translational Science Institute, University at Buffalo, The State University of New York, Buffalo, NY, United States
Synopsis
Keywords: Image Reconstruction, Quantitative Susceptibility mapping
We studied the dependency of quantitative susceptibility mapping to scaling the resolution and amplitude in a brain phantom with and without tissue microstructure. We found that nonsusceptibility frequency contributions cause a resolution- and region-dependent bias to quantitative susceptibility mapping.Introduction
Quantitative susceptibility mapping (QSM) assumes that the frequency shifts in tissue come from tissue magnetic susceptibility1. Magnetic susceptibility, χ, produces a spatial perturbation in the frequency distributions, f, that can be described by a 3D convolution with the z component of the unit magnetic dipole kernel d.f = d * χ
At the core of quantitative susceptibility mapping is the numerical inversion of this dipole convolution, to derive maps of χ from frequency maps f.
Dipole inversion depends only on the voxel aspect ratio but not on the nominal voxel edge lengths (resolution), a fact best understood in k-space, where the dipole kernel is made of constant lines from the center: matrices with the same number of elements that samples this pattern contain the same values, regardless how fine or coarse the sampling steps in k-space are.
In biological tissue, QSM’s assumption that magnetic susceptibility is the only source of frequency shifts is known to be simplistic: tissue microstructure and chemical exchange cause additional frequency shifts2.
In this study, we studied the resolution and amplitude scaling dependency of quantitative susceptibility mapping in the presence of nonsusceptibility frequency shifts. We hypothesized that for geometrical reasons, the resolution-dependency would differ between brain regions, which would mean that susceptibility estimates from QSM have different reliabilities in different brain regions.
Methods
Susceptibility and microstructure phantom: We used the susceptibility phantom and the field simulation pipeline from the 2019 QSM challenge3 to create a susceptibility ground truth and frequency map with 1 mm3 isotropic voxel size. A second frequency map was simulated with microstructure-derived frequency perturbations3. These maps where rescaled to 0.9x, 0.8x and 0.7x voxel size. To assess the linearity of deep learning-based QSM, we compared the results from inputs with scaled amplitudes with factors from 10-2 to 104.Dipole inversion methods: We used our own implementation of deep learning-based QSM, similar to DeepQSM4, but with improved synthetic training data5. For comparison, we calculated susceptibility estimates with DEEPOLE QUASAR6,7, a method that is designed to be robust against nonsusceptibility frequency perturbations. Training data generation and training code was identical between the two algorithms.
Region-of-interest (ROI)-based assessment: ROIs where manually drawn into the caudate, globus pallidus, putamen, pulvinar, and thalamus regions.
Results
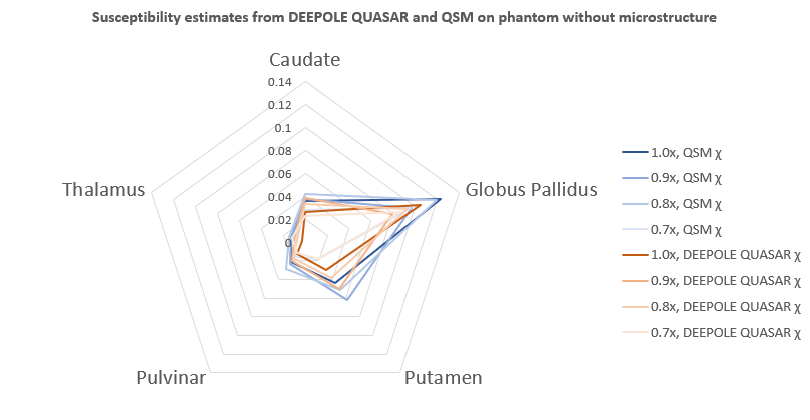
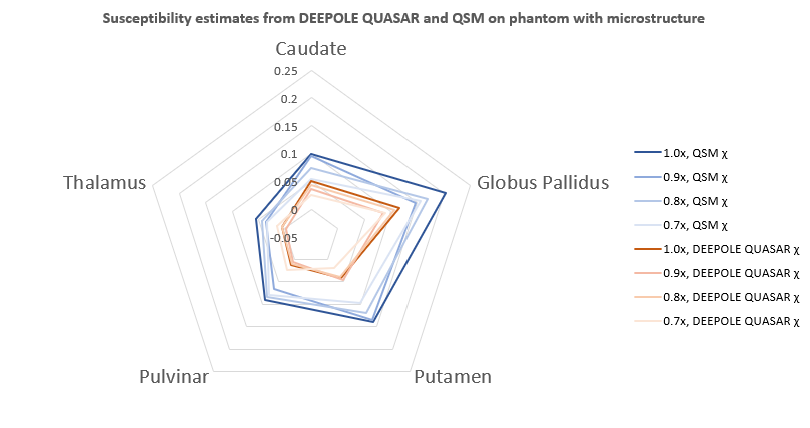
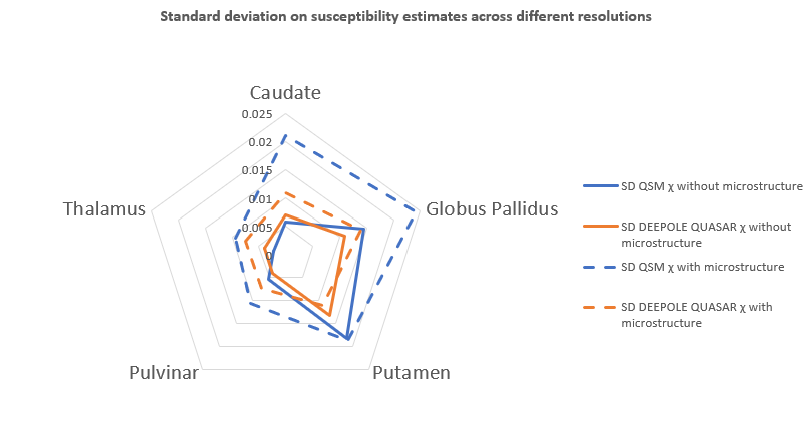
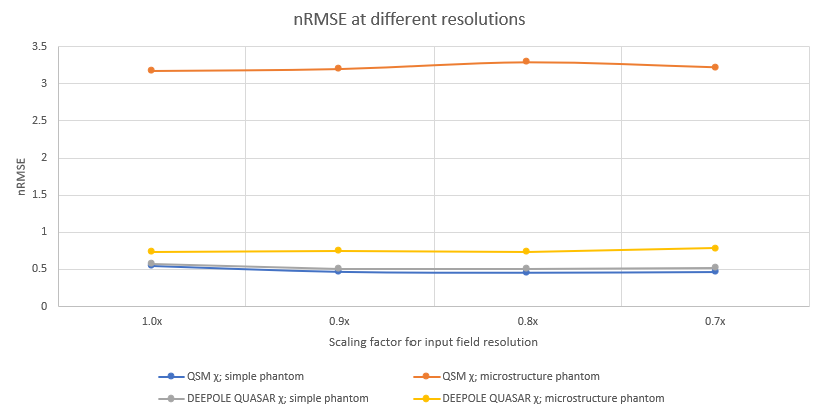
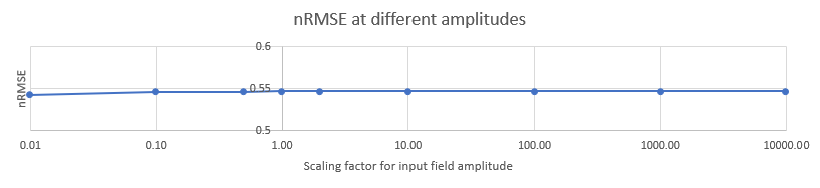
Susceptibility estimates were highly consistent between QSM and DEEPOLE QUASAR in the model without microstructure effects and largely independent of the resolution (Fig. 1). Susceptibility values estimated with QSM increased markedly when microstructure effects were added to the model, whereas they remained similar to the non-microstructure model with DEEPOLE QUASAR (Fig. 2). Deviations between QSM and DEEPOLE QUASAR were different between regions, with Putamen showing the strongest deviation and Caudate the weakest (Fig. 2). Dependence on resolution was increased in QSM compared to DEEPOLE QUASAR. In addition to changes in the regional average susceptibility values, microstructure effects increased the artifact level in QSM but not DEEPOLE QUASAR (Figure 3). Global normalized root-mean-squared errors (nRMSE) where stable over different resolutions (Figure 4). Scaling the input (with rescaled output) had almost no effect on the nRMSE (Figure 5).Discussion and Conclusions
Our study revealed that microstructure frequency effects affect susceptibility values estimated with QSM in a region-dependent way and that these effects are modulated by the spatial resolution used for imaging. Conversely, dependence on spatial resolution translates into dependence on brain volume, if the spatial resolution remains constant. Brain volume dependency may introduce significant bias into clinical studies of conditions with brain atrophy.Acknowledgements
Research reported in this publication was partially supported by the National Institute Of Neurological Disorders And Stroke of the National Institutes of Health under Award Number R01NS114227, and the National Center for Advancing Translational Sciences of the National Institutes of Health under Award Number UL1TR001412. The content is solely the responsibility of the authors and does not necessarily represent the official views of the funding agencies. Furthermore, the research was supported by the Free State of Thuringia within the ThiMEDOP project (2018 IZN 0004) with funds of the European Union (EFRE), the Free State of Thuringia within the thurAI project (2021 FGI 0008), the German Academic Exchange Service (DAAD PPP 57599925), and an ISMRM Research Exchange Grant awarded to T.J.References
1. Schweser, F., Deistung, A. & Reichenbach, J. R. Foundations of MRI phase imaging and processing for Quantitative Susceptibility Mapping (QSM). Zeitschrift für Medizinische Physik 26, 6–34 (2016).
2. Schweser, F. & Zivadinov, R. Quantitative susceptibility mapping (QSM) with an extended physical model for MRI frequency contrast in the brain: a proof-of-concept of quantitative susceptibility and residual (QUASAR) mapping. NMR in Biomedicine 31, e3999 (2018).
3. José P. Marques et al. QSM Reconstruction Challenge 2.0: a realistic in silico head phantom for MRI data simulation and evaluation of susceptibility mapping procedures. (submitted; Magn Reson Med).
4. Bollmann, S. et al. DeepQSM - using deep learning to solve the dipole inversion for quantitative susceptibility mapping. NeuroImage 195, 373–383 (2019).
5. Jochmann, T., Haueisen, J. & Schweser, F. How to train a Deep Convolutional Neural Network for Quantitative Susceptibility Mapping (QSM). in International Society of Magnetic Resonance in Medicine (ISMRM) 28th Annual Meeting, Virtual Conference (2020).
6. Jochmann, T., Haueisen, J., Zivadinov, R. & Schweser, F. U2-Net for DEEPOLE QUASAR–A Physics-Informed Deep Convolutional Neural Network that Disentangles MRI Phase Contrast Mechanisms. (2019).
7. Jochmann, T. et al. Quantitative mapping of susceptibility and non-susceptibility frequency with DEEPOLE QUASAR. in International Society of Magnetic Resonance in Medicine (ISMRM) 29th Annual Meeting (2021).
Figures