2029
Optimized Fast Gray Matter Acquisition T1 Inversion Recovery MRI for Localizing Mammillothalamic Tract in Deep Brain Stimulation Targeting1Radiology, Mayo Clinic, Rochester, MN, United States, 2Radiology, Mayo Clinic, Jacksonville, FL, United States
Synopsis
Keywords: Data Acquisition, Data Acquisition, FGATIR, Deep brain stimulation, Compact 3T, MRI sequence optimization
Deep brain stimulation (DBS) is used for neurological disorder treatment but requires precise image-based targeting. The fast gray matter acquisition T1 inversion recovery (FGATIR) sequence was developed to visualize DBS targets, such as the mammillothalamic tract (MTT). We investigated the imaging protocol of FGATIR through simulation, phantom experiment, and volunteer scanning to improve the contrast-to-noise ratio. Adjustments to inversion time, flip angle, and receive bandwidth were made to achieve the highest MTT-thalamus contrast. A compact 3T scanner was also leveraged to further maximize the contrast as the high-performance gradients reduce repetition time, thereby decreased the acquisition window of FGATIR.
Introduction
Current deep brain stimulation (DBS) surgery requires precise image-based targeting [1]. The use of fast gray matter acquisition T1 inversion recovery (FGATIR) is evolving as an important MRI tool to visualize DBS targets by suppressing the white matter (WM) and increasing the contrast between WM and gray matter (GM) [2]. The mammillothalamic tract (MTT) has been used for targeting anterior nucleus of the thalamus in pre-surgical localization and stimulation in patients with drug-resistant epilepsy [3]. In this study, the FGATIR imaging protocol was optimized through simulation, phantom experiment, and healthy subject scanning to improve the contrast between the MTT and the thalamus. A compact 3T (C3T) scanner [4] with high-performance gradients allowed a shorter FGATIR acquisition window by reducing the repetition time of each gradient echo, which concentrates the center k-space acquisition around the null point of the WM to further maximize the desired contrast.Methods
Numerical Simulation: Pulse sequence optimization based on the Bloch equations was performed as in [5, 6]. It provides theoretical insight for deciding which sequence parameters most impact image contrast (Fig. 1). The object was to maximize the contrast-to-noise ratio (CNR) between MTT and thalamus. Based on the results, inversion time (TI), flip angle (FA), and receive bandwidth (BW) were chosen to be the parameters of investigation.Phantom scanning: The ISMRM/NIST T1/T2 phantom [7] was scanned to quantitatively evaluate the contrast dependency on the parameters of interest. The T2 array was used as samples T2-7 and T2-6 have T1 and T2 values close to MTT and thalamus (Table 1). ROIs were drawn on T2-7 and T2-6 samples to calculate the contrast-to-noise ratios (CNR) [8] (Fig. 2). Search was performed until the best contrast was achieved to determine the optimized parameters.
Healthy subject scanning: To validate phantom results, a healthy volunteer subject was scanned on the C3T MRI system with high performance gradient [4] under an IRB-approved protocol after obtaining written consent. Our original and modified FGATIR protocols were acquired (Table 1). The imaging protocols for both phantom and subject scans are shown in Table 2. The BW was reduced from ±31.25 to ±25 kHz to extend the TR time on the C3T (6.912 ms to 8.12 ms) to match with the TR time (8.256 ms) on the conventional 3T scanner (GE750) with ±31.25 kHz bandwidth, which demonstrates the benefit of the C3T’s high-performance gradients for reducing TR. ROIs were drawn to calculate the MTT-thalamus CNR (Fig. 3).
Results
Both simulation and phantom experiment demonstrated that the combination of 470ms TI, 12° FA, and ±31.25 kHz BW provided a better MTT-thalamus contrast than the commonly-used protocol of 450 ms TI, 8° FA, and ±31.25 kHz (Table 2). Subject scans on the C3T validated the phantom results (Fig. 3). The demonstration of both ±31.25 and ±25kHz bandwidth shows the high-performance gradients can either be used to shorten TR or lower bandwidth for CNR maximization (Fig. 3).Discussion
In previous studies[5, 6], simulations based on the Bloch equations have been performed to examine signals evolution of WM, GM, and their difference during the acquisition phase of FGATIR. The goal has been to maximize WM-GM contrast. However, tracking MTT in thalamus for DBS targeting could benefit from a closer investigation of the MTT-thalamus contrast behavior. We observed higher MTT-thalamus contrast from both phantom and volunteer scanning at a higher FA (e.g., at 12°) and a TI time of 470ms (Table 3&4).Given that centric ordering in the slice direction was used, the goal was to synchronize the nulled WM contrast with the acquisition of the center of k-space. The image contrast not only depends on the timing to capture the optimal-point contrast but also on the acquisition window length. A longer TR and thereby longer acquisition window means the central k-space views are not maximally compact in time, but spreading away from the null point of WM. Meanwhile, the effect of BW on tissue contrast is twofold. A decreased BW will lower noise as noise $$$\propto \sqrt{BW}$$$. On the other hand, the TR is increased as BW decreases, which prolongs the acquisition window and reduces the contrast. Thus, the selection of BW is balanced between these two conflicting requirements.
With a high-performance gradient (80 mT/m peak amplitude and 700 T/m/s peak slew rate), the C3T can achieve reduced TR compared to the conventional scanner (50 mT/m and 200 T/m/s), thereby achieving a shorter acquisition window without increasing BW. Alternatively, a lower bandwidth can be applied to reduce noise, while yielding a TR on the C3T to be similar to that on the conventional scanner. The phantom and human subject results demonstrate better CNR performance can be achieved by the C3T compared with the conventional 3T with both implementations.
Conclusion
Imaging parameters of the FGATIR sequences were examined based on simulation and phantom experiments to achieve improved contrast between MTT and thalamus. The high-performance gradients on the C3T further improve the desired contrast.Acknowledgements
No acknowledgement found.References
[1] Richardson, R.M., Ostrem, J.L., Starr, P.A., 2009. Surgical repositioning of misplaced subthalamic electrodes in Parkinson’s disease: location of effective and ineffective leads. Stereotact. Funct. Neurosurg. 87, 297-303.
[2] Sudhyadhom, A., Haq, I.U., Foote, K.D., Okun, M.S., Bova, F.J., 2009. A high resolution and high contrast MRI for differentiation of subcortical structures for DBS targeting: the Fast Gray Matter Acquisition T1 Inversion Recovery (FGATIR). Neuroimage 47, T44-T52.
[3] Grewal, S.S., Middlebrooks, E.H., Kaufmann, T.J., Stead, M., Lundstrom, B.N., Worrell, G.A., Lin, C., Baydin, S., Van Gompel, J.J., 2018. Fast gray matter acquisition T1 inversion recovery MRI to delineate the mammillothalamic tract for preoperative direct targeting of the anterior nucleus of the thalamus for deep brain stimulation in epilepsy. Neurosurg. Focus 45, E6.
[4] Foo, T.K.F., et al., 2018. Lightweight, compact, and high-performance 3T MR system for imaging the brain and extremities. Magn. Reson. Med. 80(5), 2232-2245.
[5] Lin, C. and Bernstein, M.A., 2008. 3D magnetization prepared elliptical centric fast gradient echo imaging. Magn. Reson. Med. 59, 434-439.
[6] Tao, S., Zhou, X., Westerhold, E.M., Middlebrooks, E.H., Lin, C., 2022. Optimization of fast gray matter acquisition T1 inversion recovery (FGATIR) on 7T MRI for deep brain stimulation targeting. Neuroimage 252, 119043.
[7] Stupic, K.F., et al., 2021. A standard system phantom for magnetic resonance imaging. Magn. Reson. Med. 86 1194-1211.[8] NEMA, Determination of signal-to-noise ratio and image uniformity for single-channel, non-volume coils in diagnostic magnetic resonance imaging. MS 1-2008.
[9] Thaler, C., Hartramph, I., Stellmann, J.P., Heesen, C., Bester, M., Fiehler, J., Gelliben, S., 2021. T1 relaxation times in the cortex and thalamus are associated with working memory and information processing speed in patients with multiple sclerosis. Front Neurol. 12: 789812.
[10] Wansapura, J.P., Holland, S.K., Dunn, R.S., Ball, W.S.J., 1999. NMR relaxation times in the human brain at 3.0 tesla. J Magn. Reson. Imaging, 9(4):531-8.
[11] Hasan, K.M., Walimuni, I.S., Abid, H., Frye, R.E., Ewing-Cobbs, L., Wolinsky, J.S., Narayana, P.A., 2011. Multimodal quantitative magnetic resonance imaging of thalamic development and aging across the human lifespan: implications to neurodegeneration in multiple sclerosis. J. of Neurosci., 31 (46) 16826-16832.
Figures
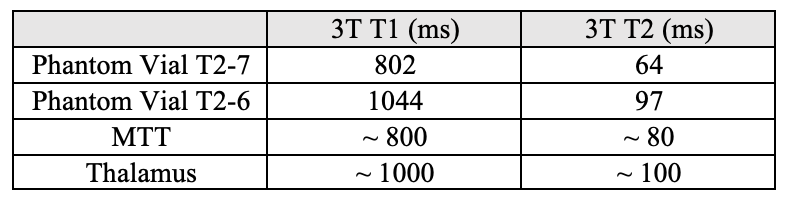
Table 1: 3T T1 and T2 values of phantom samples (T2-7 and T2-6), which is close to the reported T1 and T2 values of MTT (considered as white matter) and thalamus [9-11].
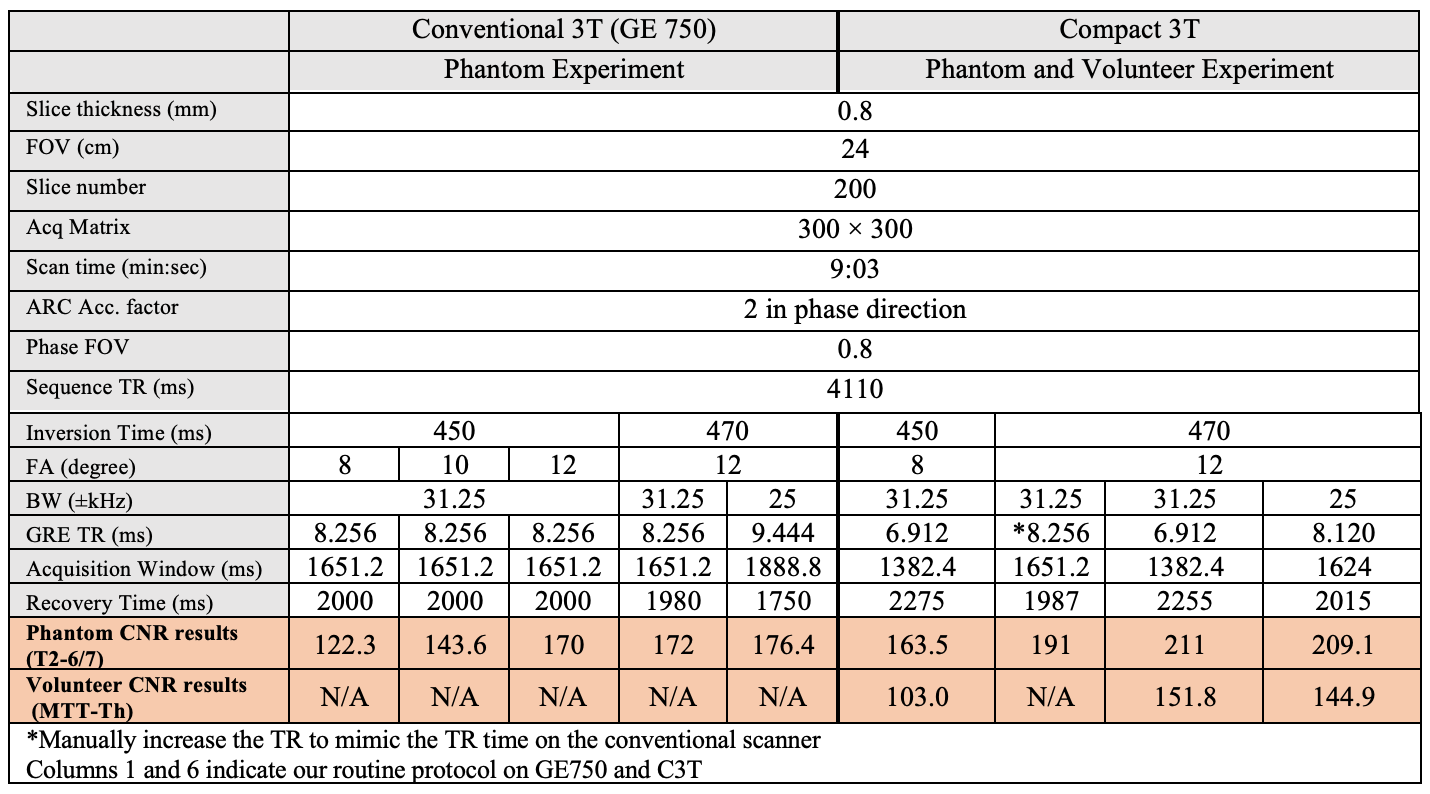
Table 2: Imaging Protocols and the measured CNR results for phantom and volunteer experiment. Various combinations of flip angle, inversion time, and bandwidth were experimented, which may result change of gradient echo TR. The total imaging time was always kept constant by adjusting the recovery time when either the inversion recovery time changes or acquisition window length changes due to bandwidth or scanner change.
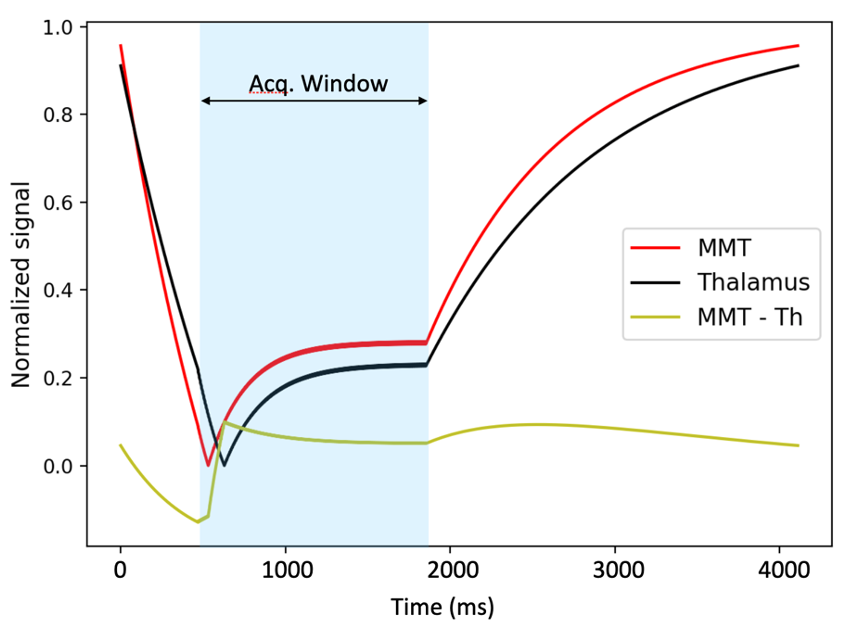
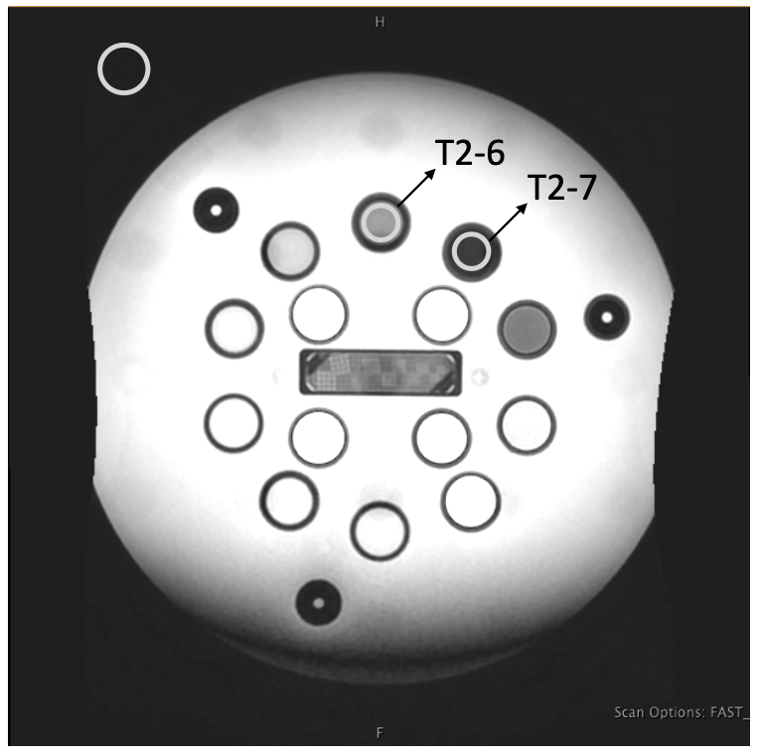
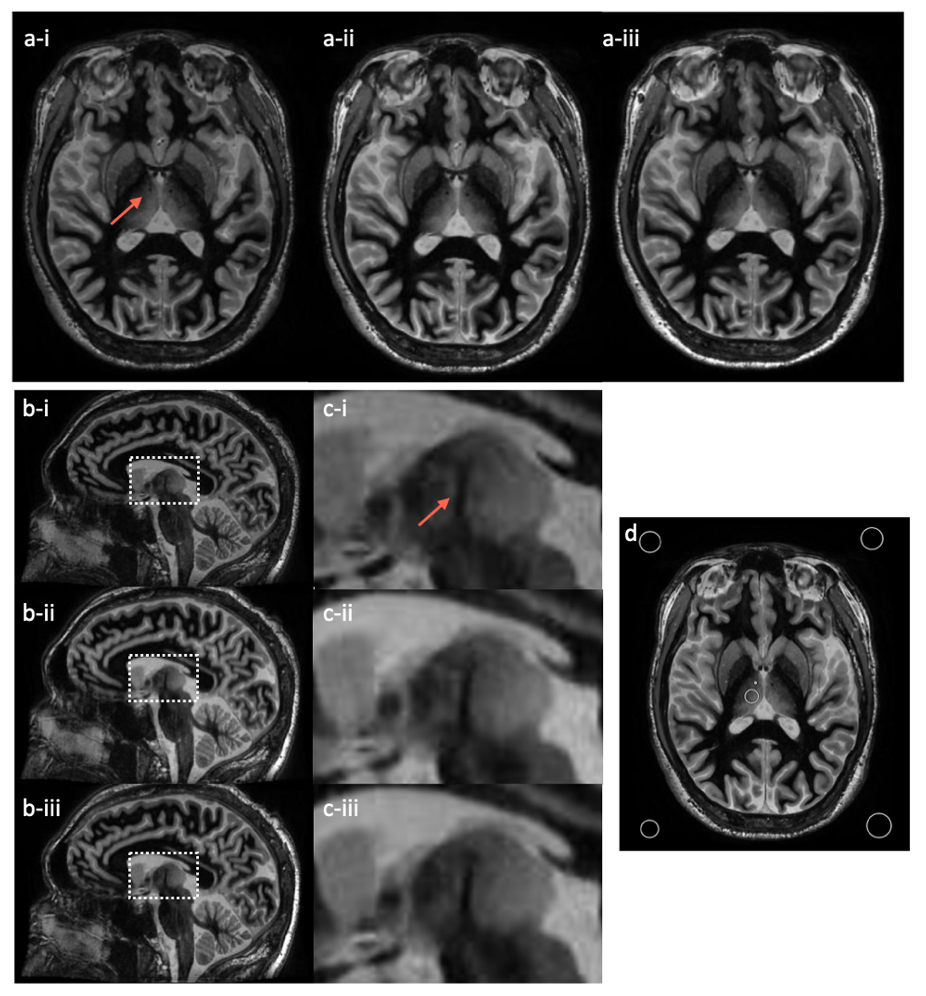
Fig. 3: volunteer images on C3T with magnified inserts. Both the axial plane (a) and the reformatted sagittal plane (b) and (c) are shown for the three protocols (i: 450 ms TI, 8° FA, and ±31.25 kHz; ii: 470 ms TI, 12° FA, and ±31.25 kHz; iii: 470 ms TI, 12° FA, and ±25 kHz). The window/level of all images are set the same. The MTT is marked with an arrow for identification. ROIs are shown in the axial plane for the contrast calculation (d).