2028
Assessing the robustness of the correlation between intra-axonal T2 and axon diameter across participants
Veronica P Dell'Acqua1, Chantal M W Tax1,2, Malwina Molendowska1, Greg D Parker1, Derek K Jones1,3, Muhamed Barakovic1,4,5,6,7, and Erick Jorge Canales-Rodriguez6
1Cardiff University Brain Research Imaging Centre, Cardiff University, Cardiff, United Kingdom, 2University Medical Center Utrecht, Image Sciences Institute, Utrecht, Netherlands, 3Mary MacKillop Institute for Health Research, Australian Catholic University, Melbourne, Australia, 4Translational Imaging in Neurology (ThINk) Basel, University Hospital Basel and University of Basel, Basel, Switzerland, 5MS Center and Research Center for Clinical Neuroimmunology and Neuroscience Basel, University Hospital Basel and University of Basel, Basel, Switzerland, 6Signal Processing Laboratory 5 (LTS5), Ecole Polytechnique Fédérale de Lausanne (EPFL), Lausanne, Switzerland, 7Roche Pharma Research & Early Development, Neuroscience and Rare Diseases, Roche Innovation Center, Basel, Switzerland
1Cardiff University Brain Research Imaging Centre, Cardiff University, Cardiff, United Kingdom, 2University Medical Center Utrecht, Image Sciences Institute, Utrecht, Netherlands, 3Mary MacKillop Institute for Health Research, Australian Catholic University, Melbourne, Australia, 4Translational Imaging in Neurology (ThINk) Basel, University Hospital Basel and University of Basel, Basel, Switzerland, 5MS Center and Research Center for Clinical Neuroimmunology and Neuroscience Basel, University Hospital Basel and University of Basel, Basel, Switzerland, 6Signal Processing Laboratory 5 (LTS5), Ecole Polytechnique Fédérale de Lausanne (EPFL), Lausanne, Switzerland, 7Roche Pharma Research & Early Development, Neuroscience and Rare Diseases, Roche Innovation Center, Basel, Switzerland
Synopsis
Keywords: Data Analysis, Relaxometry, Validation, Axon Diameter, Diffusion-Relaxation
In-vivo quantification of axon diameter is an attractive and debated topic in the MRI community. The possibility to resolve submicrometric axon diameters non-invasively yields the potential to push further the boundaries in research and clinics but yet, further work is needed to better explore and validate the existing approaches to estimate the inner axon diameter. Recently, the feasibility of estimating the axon diameter from the intra-axonal transverse relaxation time has been investigated combining a diffusion-relaxation protocol and histological data. In the present study, we apply this approach in a larger in vivo population to assess variability across participants.Introduction
In-vivo quantification of axon radius is an attractive and debated topic in the MRI community. Alteration of the axon radii has been previously linked with neurodevelopmental disorders1 and neurologic pathologies2. Without doubt, the possibility to resolve this microstructural information non-invasively yields the potential to push further the boundaries in research and clinics but yet, additional work is needed to better explore and validate the existing approaches to estimate the inner axon radius. Most approaches have focused on axon diameter mapping from dMRI data3, but recent work has proposed an alternative strategy by combining diffusion-relaxation MRI, histological data4, and a surface-based relaxation mechanism5 commonly employed in porous media6,7, where water molecules proximal to axonal membranes loose phase coherence, leading to faster T2-weighted signal attenuation. In human brain data, the intra-axonal T2 time was highly correlated with the inner axon radius in several corpus callosum regions4 as estimated from histological data. However, the proof-of-concept was only shown in a single human volunteer4. This study assesses the variability of the correlation between intra-axonal T2 and axon radii but in a larger in vivo population and by using a novel MRI sequence employing multiple echo times (TE) and b-tensor shapes for improved separation of compartmental signals8.Methods
In vivo data acquisition and analysis: 6 healthy volunteers were scanned on a Connectom scanner (300 mT/m gradients) with a 20-channel RF coil. The study was approved by the ethics committee and all participants provided written informed consent. We used a diffusion-relaxation protocol8 simultaneously varying TE=[63,85,130,85]ms, b-tensor-shapes=[1,1,1,0.5] and b-values=[0,100,1000,2000,5000] s/mm2 with a 2.5 mm isotropic resolution. T2 values were estimated by means of a two-compartment model represented by a “stick” (intra-axonal) and a “zeppelin” (extra-axonal)8. For each dataset, four Regions of Interest (ROI) were manually drawn on the Corpus Callosum (CC) using fslview9 matching the CC sectors of the histology samples (see Figure 1). Intra-axonal T2values were extracted from the maps according to the ROIs, and the computed means were used in the correlation analysis.Histology: The intra-axonal T2 values in the CC were compared with post-mortem measurements from previous studies10,11. Axons stained for myelin were measured in CC sectors crossed by axons connecting the prefrontal, motor, parietal and visual cortices. The volume-weighted mean axon radius in each CC sector was estimated10.
Correlation and calibration: The intra axonal T2 values and the histological radius were correlated and the slope and intercept of the regression line where then used to estimate the axon radius based on the T2 value for each ROI and each subject, using a surface-based relaxation model as described in4.
Results
Figure 2 shows the distributions of intra-axonal T2 times per subject and ROI. The regression line fitting the intra-axonal T2 and mean histological radius in four CC regions is depicted in Figure 3. The correlation coefficient was 0.926 (p-value=0.07). From the fitted regression line, we found that the T2 of the cytoplasmic water is 144 ms and the surface relaxivity is 0.0018 µm/ms. After repeating the analysis for each individual subject, we found that the T2 of the cytoplasmic water ranged from 99-396 ms, and the surface relaxivity from 0.0008-0.0032 µm/ms. The linear relationship between the histological and T2-based predicted radii is depicted in Figure 4. The correlation coefficient was 0.96 (p-value=0.035). The slope of the regression line was close to the unity (1.14) and the offset was close to zero (-0.053 µm).Discussion and Conclusion
We replicated the correlation between intra-axonal T2 and the inner axon radius estimated from histological data in a larger population (Figure 3). Although we found the same global trend supporting a linear relationship as reported by4, variability was observed: whereas in ROI2 and ROI8 we found a good agreement across subjects, in ROI5 and ROI10 the estimates were more variable (Figure 4). When comparing the results from Figure 4 and the distribution of T2 values in Figure 2, we noted that, in some ROIs, the values of some of the subjects deviated from the rest, likely affecting the calibration and in turn, the final estimation of axon radius (e.g., in Subject 2-ROI10, the T2 was 30% higher than the rest of the participants). At the current stage it is difficult to identify the source of variance in the estimated intra-axonal T2. It could reflect genuine variability across participants, or it could stem from a poor estimation of the intra-axonal T2 in the central regions of the CC, e.g. due to partial volumeing with CSF. We computed the Intra-axonal T2 using the multicompartment model proposed by8, instead of the direction-averaged method12 used in the original study4, which may have affected the estimation of the relaxation times. Future work will investigate this further. Although the relationship between intra-axonal T2 and axon radius holds the promise to resolve submicrometric axon radii, we conclude that more effort is needed towards the validation of such an approach.Acknowledgements
This project was funded by Wellcome Trust PhD scholarship. EJC-R is supported by the Swiss National Science Foundation (SNSF), Ambizione grant PZ00P2_185814. CMWT was supported bythe Dutch Research Council (NWO, 17331) and the Wellcome Trust (215944/Z/19/Z).References
- Raven E, Veraart J, Kievit R, et al. In vivo evidence of microstructural hypo-connectivity of brain white matter in 22q11.2 deletion syndrome. Research Square 80221 (2020) doi:10.21203/rs.3.rs-80221/v1.
- Huang, S. Y. et al. Corpus callosum axon diameter relates to cognitive impairment in multiple sclerosis. Ann Clin Transl Neurol 6, 882–892 (2019).
- Dyrby, T. B., Søgaard, L. V., Hall, M. G., et al. Contrast and stability of the axon diameter index from microstructure imaging with diffusion MRI. Magn Reson Med 70, 711–721 (2013).
- Barakovic M, Pizzolato M, Granziera G, Thiran J.P., Derek K. J, Canales-Rodríguez EJ. Is the intra-axonal T2 relaxation time related to the axonal calibre? A diffusion-relaxation and histological data study. In: ISMRM 2022, Abstract 0180. ; 2022. Accessed November 1, 2022. https://archive.ismrm.org/2022/0180.html
- Kaden, E. & Alexander, D. C. Can T2-Spectroscopy Resolve Submicrometer Axon Diameters? Inf. Process. Med. Imaging 23,607-618.
- Brownstein, K. R. & Tarr, C. E. Spin-Lattice Relaxation in a System Governed by Diffusion. J Magn Reson. 1977;26(1):17-24. doi:10.1016/0022-2364(77)90230-X
- Zimmerman, J. R. & Brittin, W. E. Nuclear magnetic resonance studies in multiple phase systems: Lifetime of a water molecule in an adsorbing phase on silica gel. Journal of Physical Chemistry 61, 1328–1333 (1957).
- Lampinen, B. et al. Towards unconstrained compartment modeling in white matter using diffusion-relaxation MRI with tensor-valued diffusion encoding. Magn Reson Med 84, 1605–1623 (2020).
- Smith, S. M. et al. Advances in functional and structural MR image analysis and implementation as FSL. in NeuroImage vol. 23 (2004).
- Barakovic, M. et al. Bundle-Specific Axon Diameter Index as a New Contrast to Differentiate White Matter Tracts. Front Neurosci 15, (2021).
- Caminiti, R., Ghaziri, H., Galuske, R., et al. Evolution amplified processing with temporally dispersed slow neuronal connectivity in primates. Proc Natl Acad Sci U S A 106, 19551–19556 (2009).
- McKinnon, E. T. & Jensen, J. H. Measuring intra‐axonal T2 in white matter with direction‐averaged diffusion MRI. Magn Reson Med 81, 2985–2994 (2019).
Figures
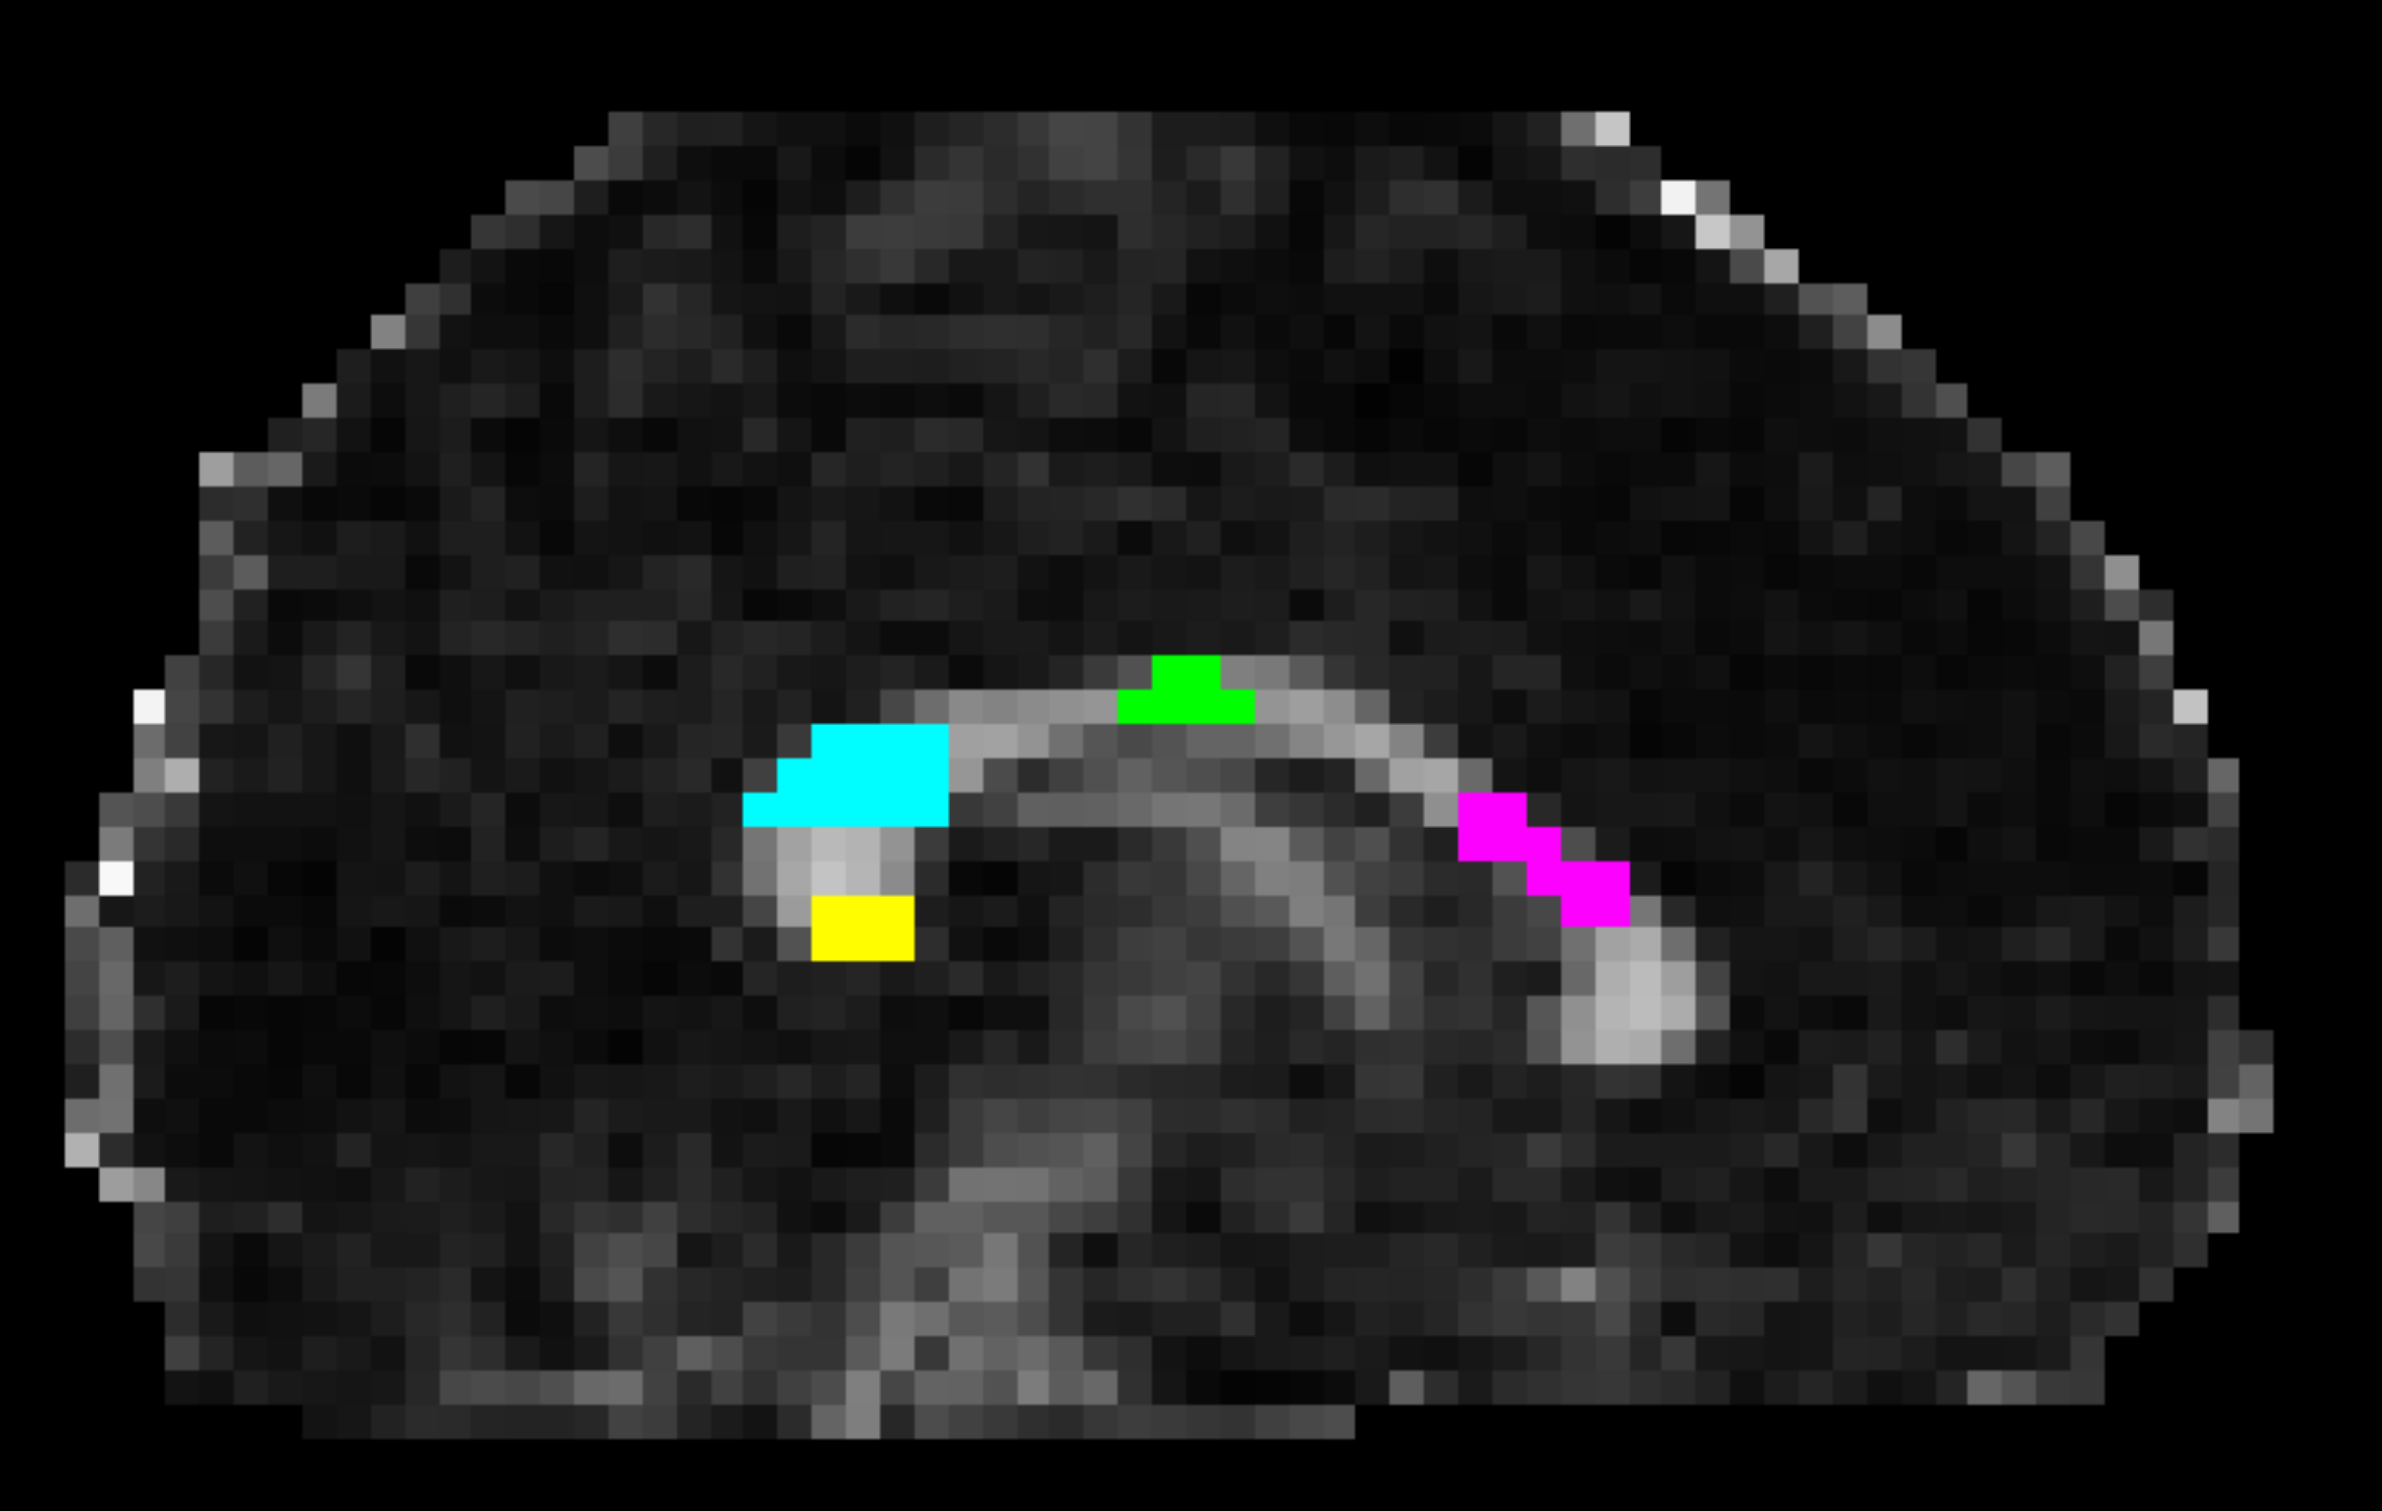
Figure 1. Corpus Callosum ROIs example in a representative subject. The ROIs were manually drawn on multiple slices of the FA map to enhance the contrast and were based on the regions matching the histology sample. From right to left: ROI2 in pink; ROI5 in green; ROI8 in light-blue; ROI10 in yellow.
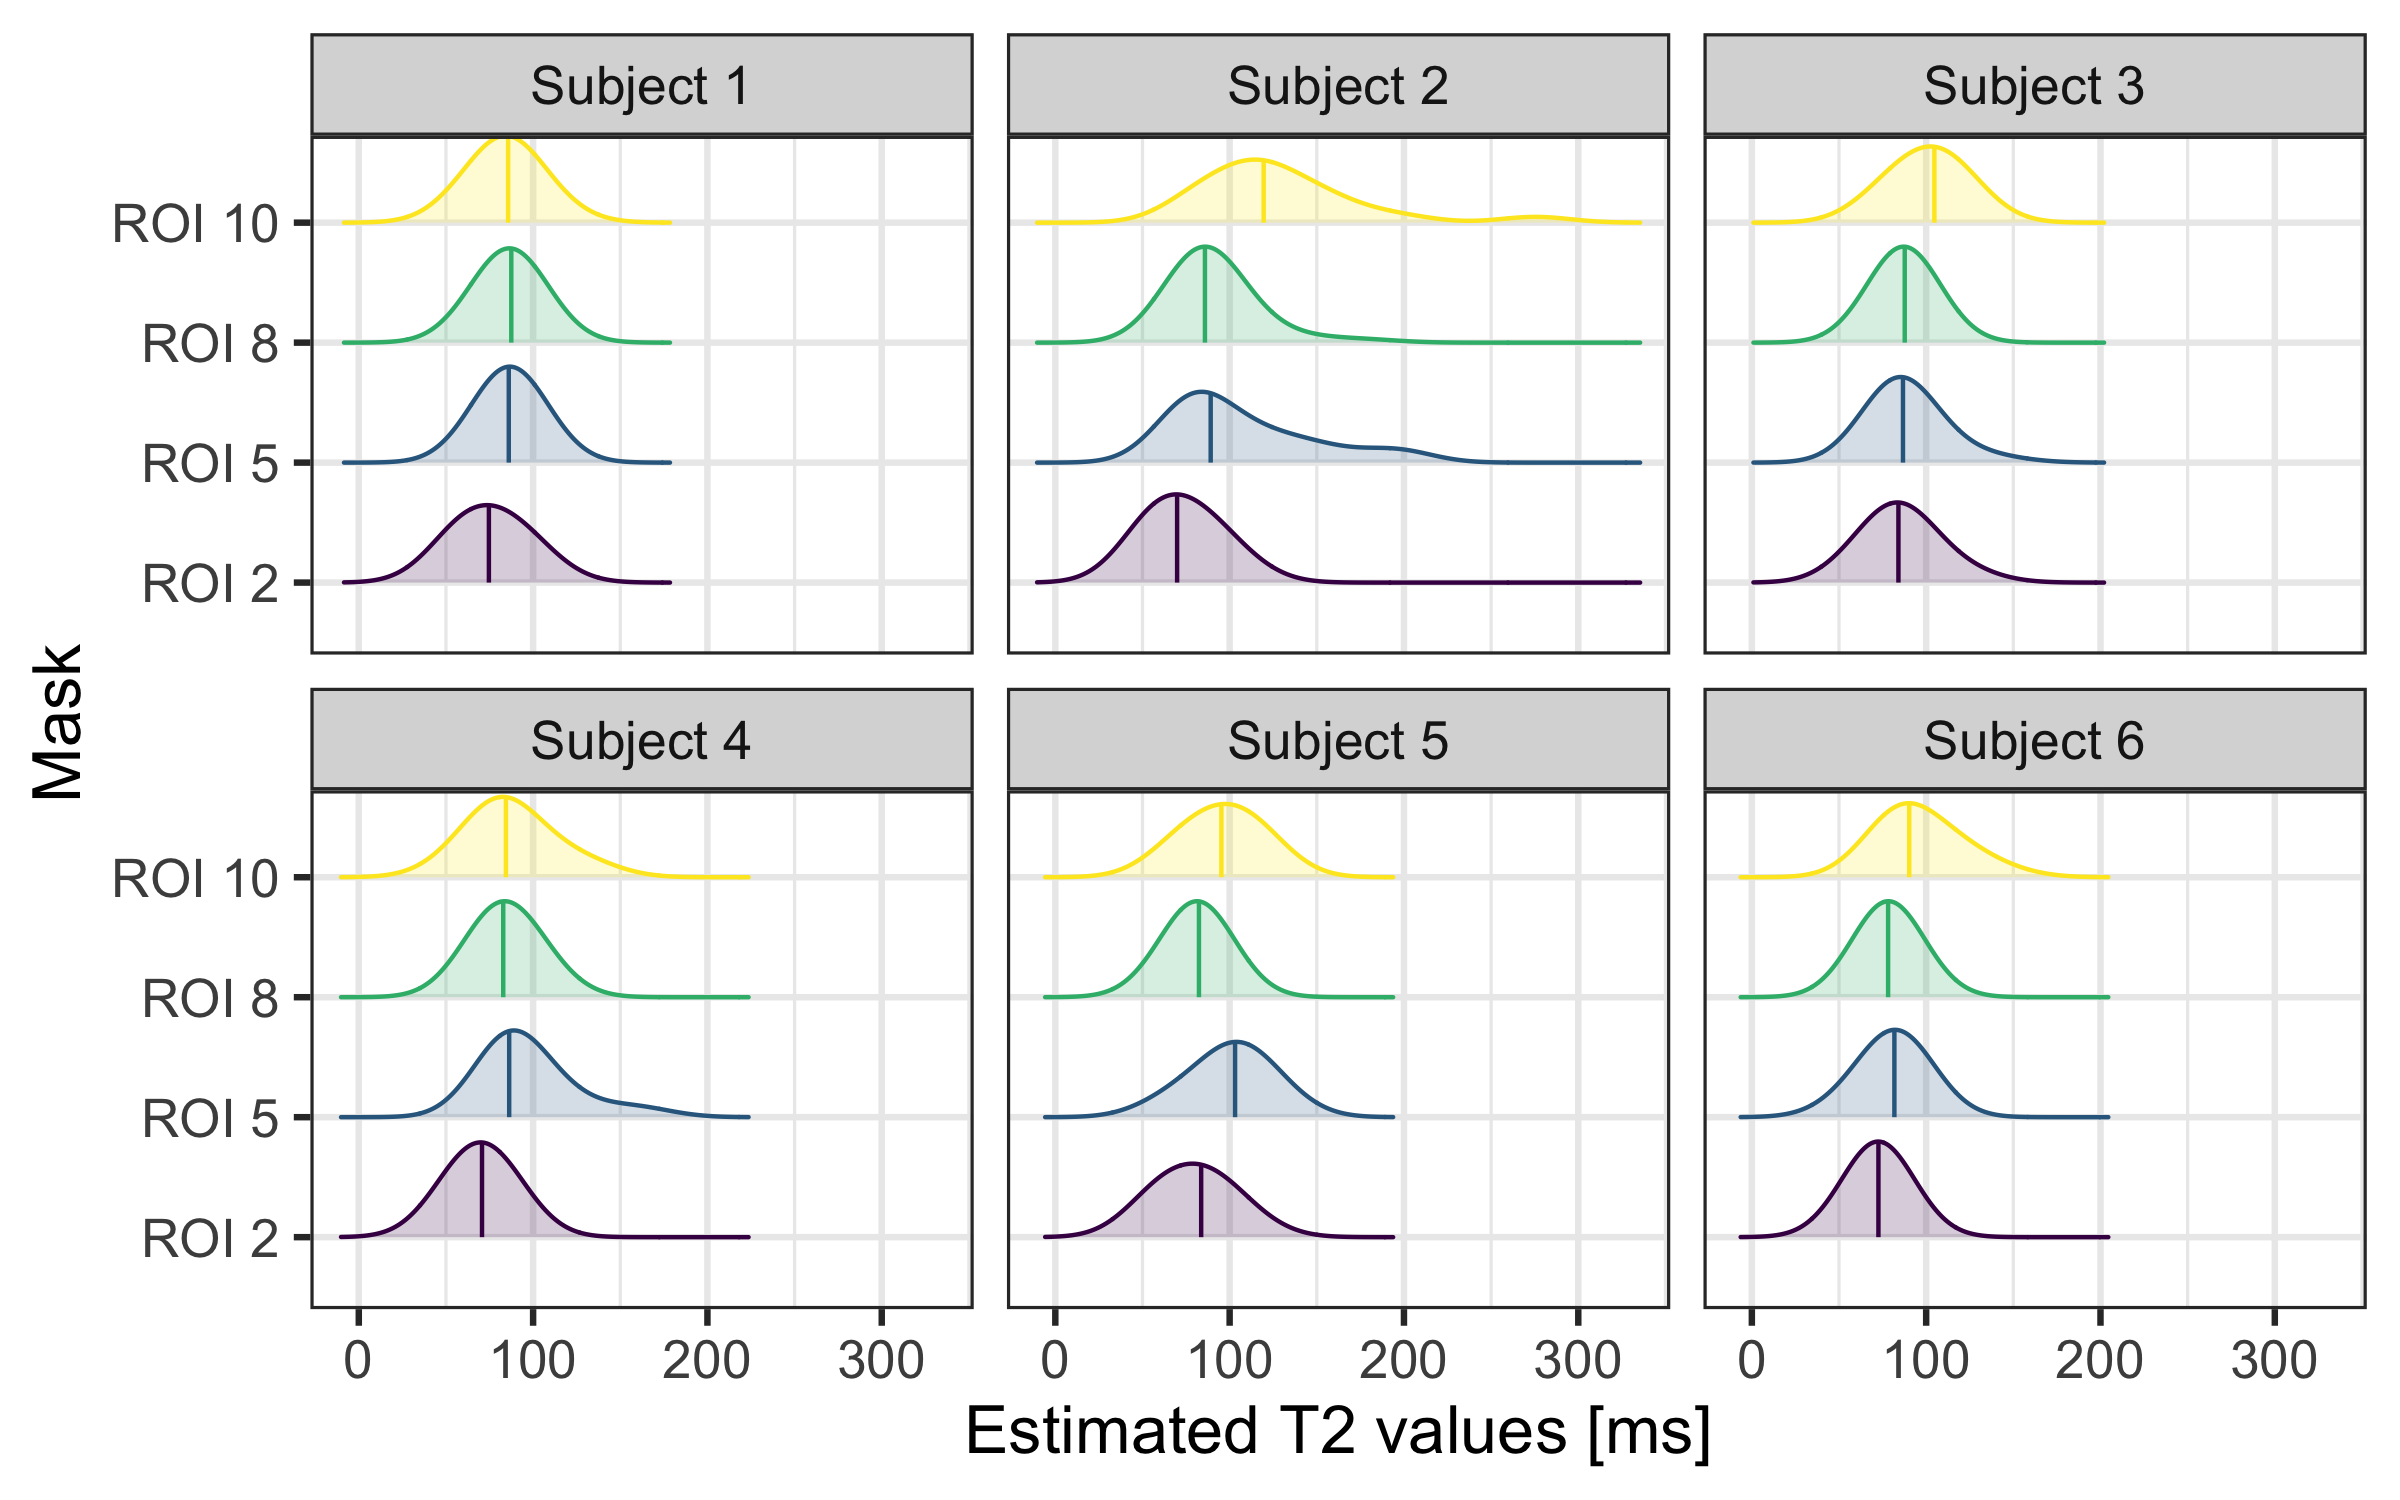
Figure 2. Intra-axonal T2 distribution for each Subject and the four ROIs. Mid-lines indicate the mean values. Note that for ROI 10 and Subject 2, and ROI5 and Subject 5, the distributions of intra-axonal T2 values are shifted to the right, in relation to the other subjects.
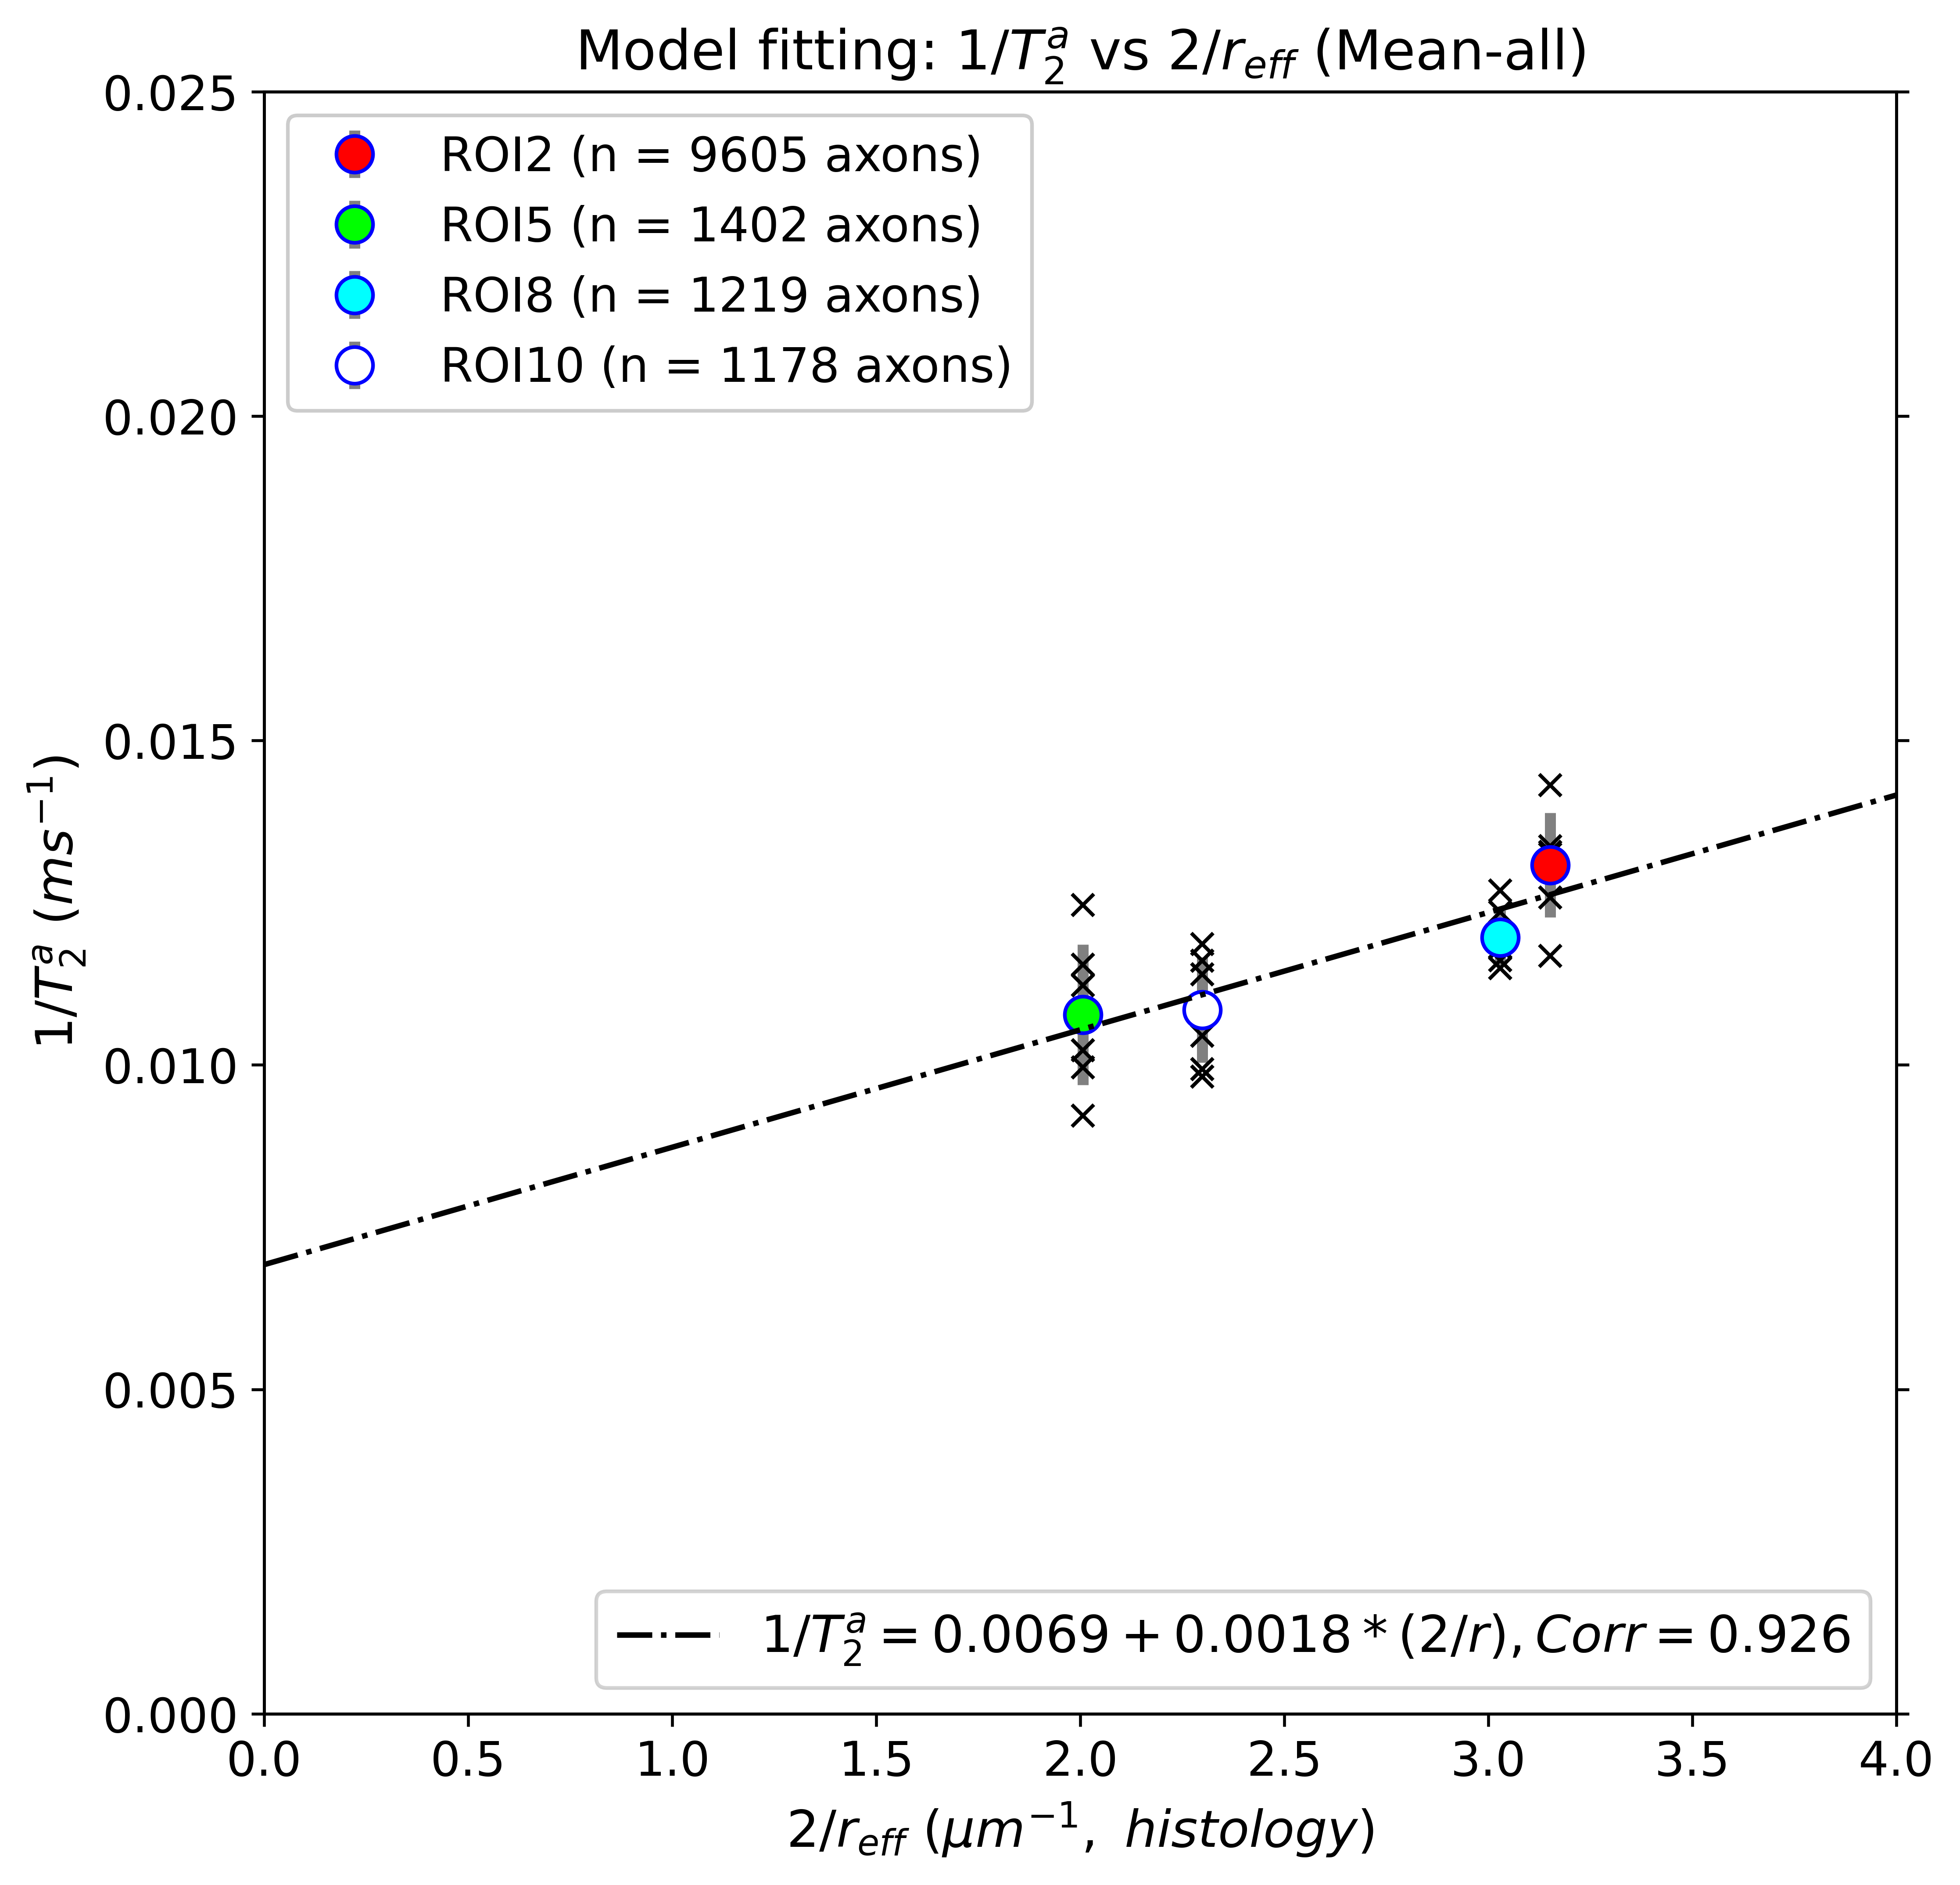
Figure 3. Linear fitting between the inverse of the intra-axonal T2 times (y-axis) and the inverse of the axon radius (x-axis) measured from histological data. The scatter plot depicts the mean values computed for all the voxels inside four corpus callosum (CC) regions, corresponding to ROI2, ROI5, ROI8, and ROI10. The number of axons sampled for each CC region is displayed.
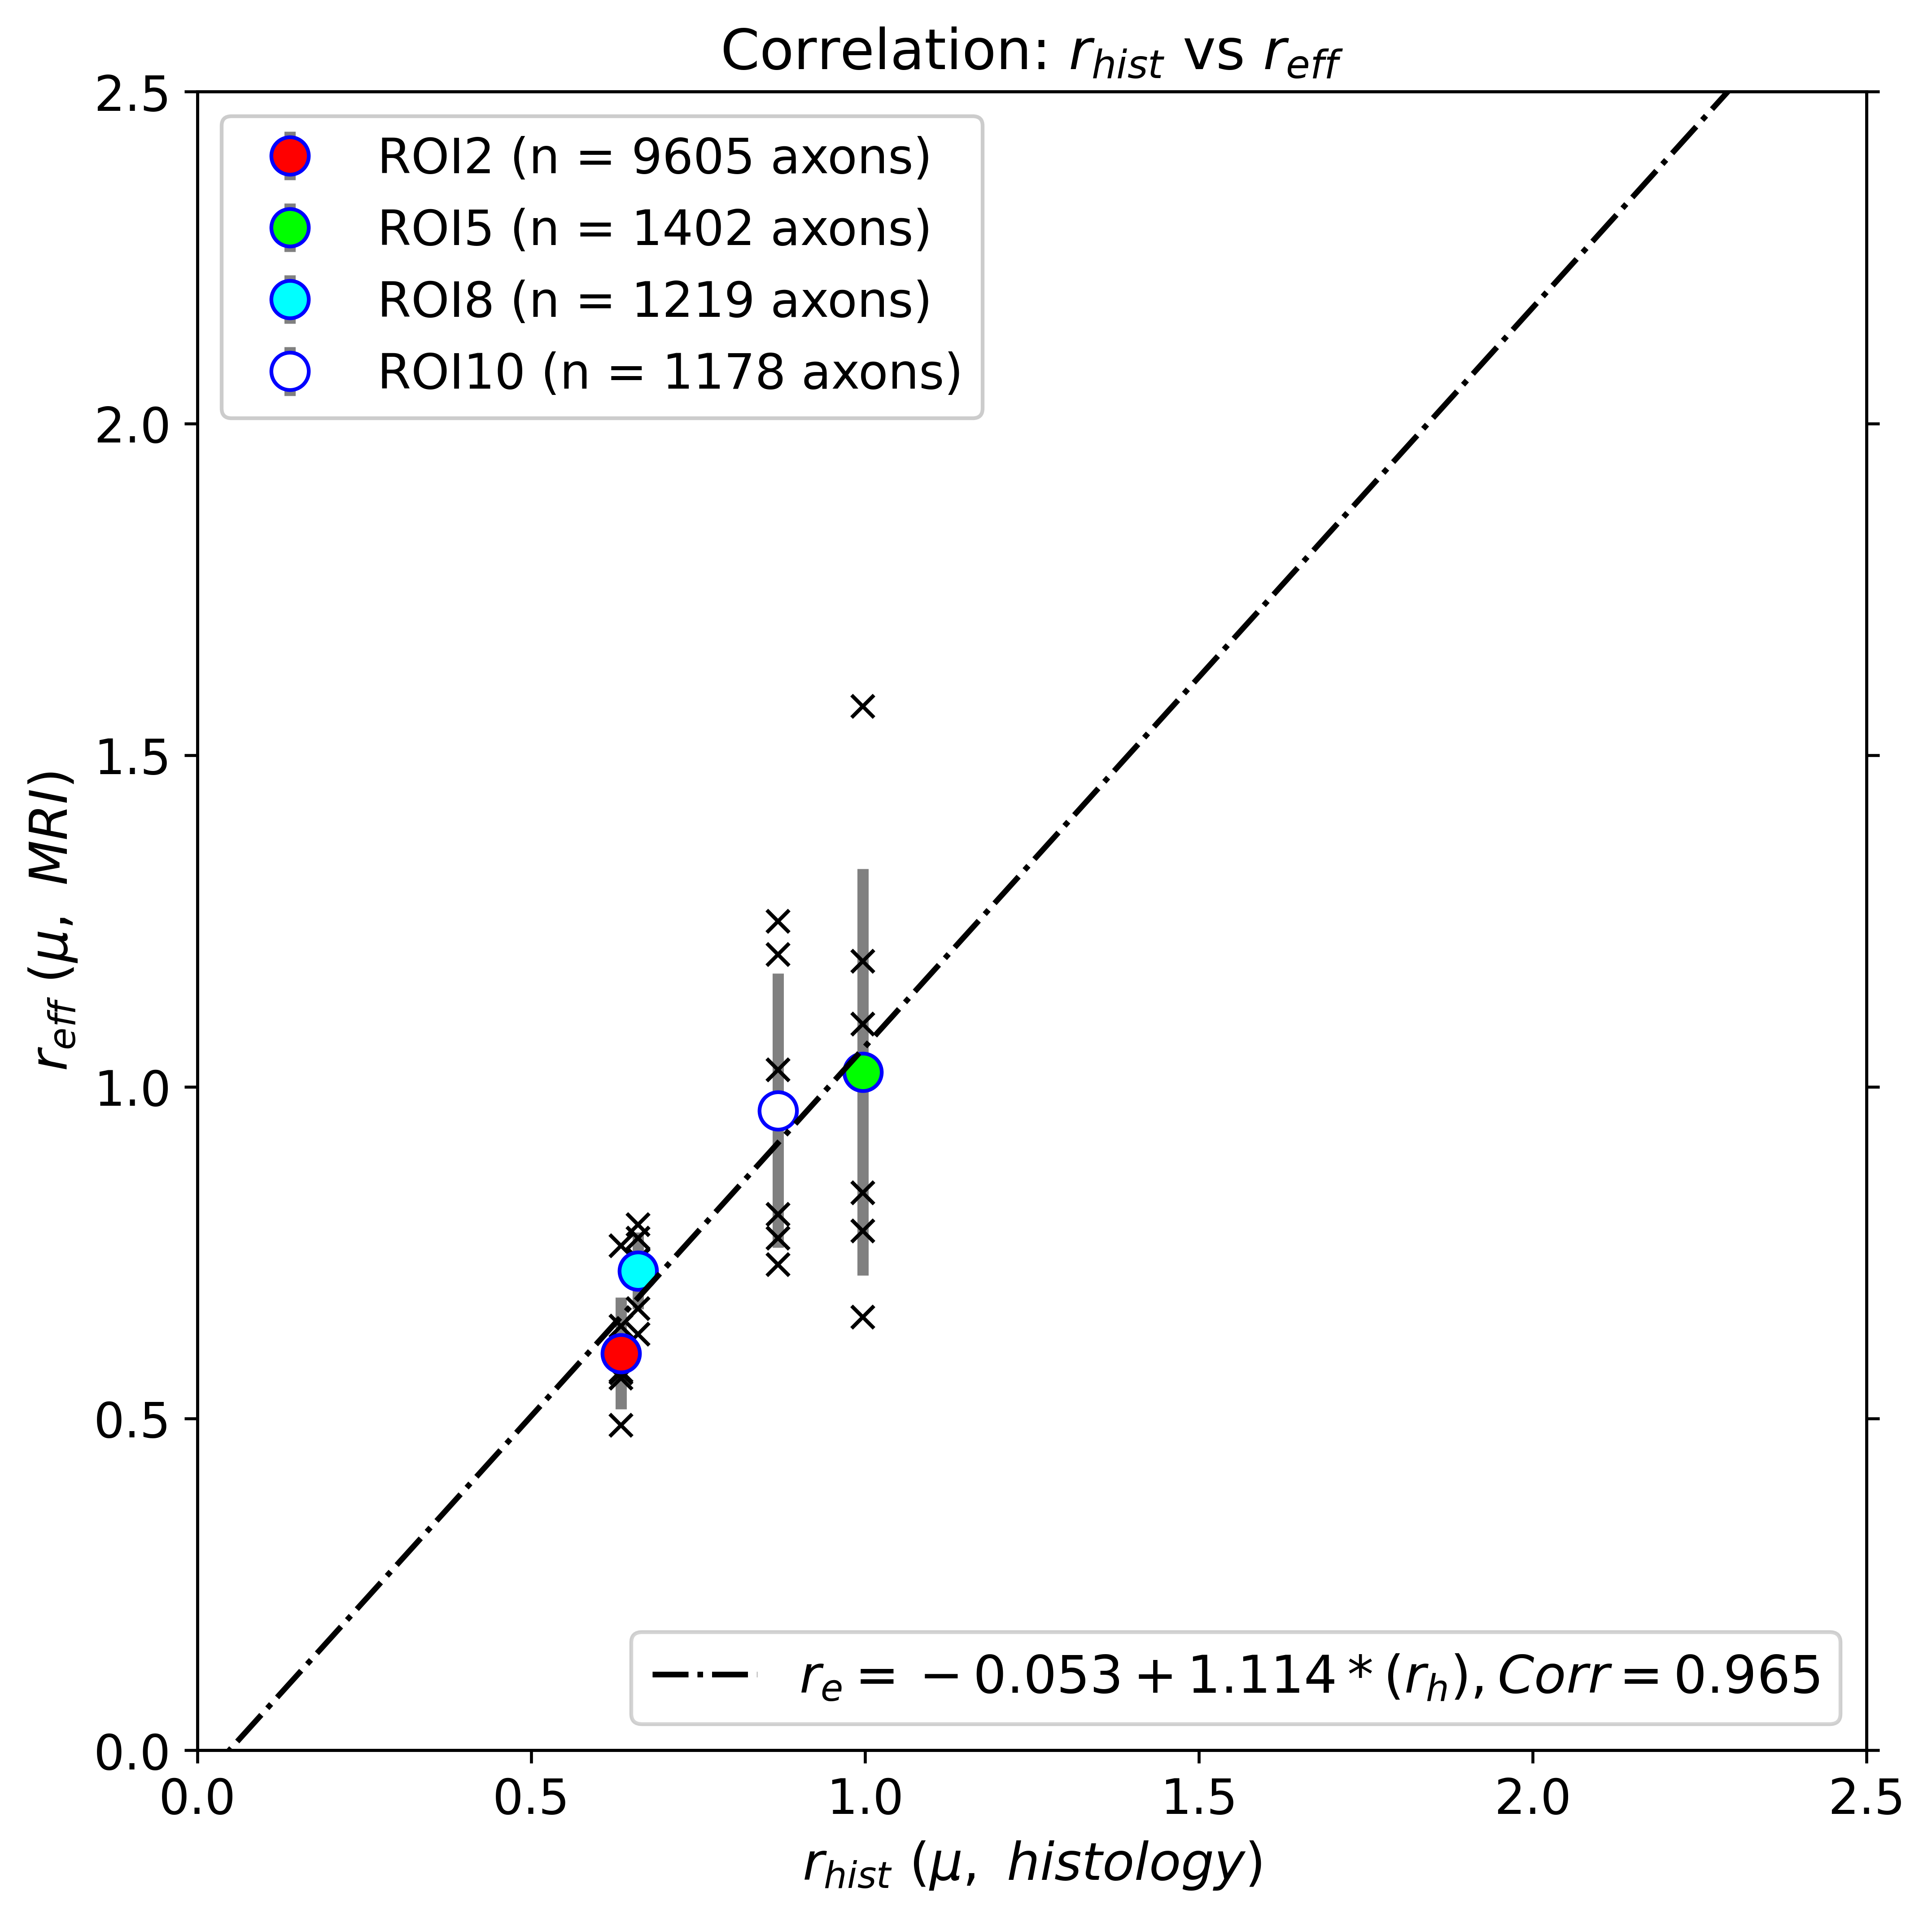
Figure 4. Linear regression between the radius estimated from dMRI-T2 data (y-axis) and the axon radius (x-axis) measured from histological data. The scatter plot depicts the mean radii computed for all the voxels inside four corpus callosum (CC) regions, corresponding to ROI2, ROI5, ROI8, and ROI10, as well as their errors (standard deviation), and the individual values of all subjects. The number of axons sampled for each CC regions is displayed.
DOI: https://doi.org/10.58530/2023/2028