2025
A robust method for estimating CVR dynamics from breath-hold BOLD data without end-tidal carbon dioxide recordings1Rotman Research Institute, Baycrest Health Sciences, Toronto, ON, Canada, 2Departments of Psychology and Psychiatry, University of Toronto, Toronto, ON, Canada, 3Department of Medical Biophysics, University of Toronto, Toronto, ON, Canada, 4Department of Biomedical Engineering, University of Toronto, Toronto, ON, Canada
Synopsis
Keywords: Data Analysis, fMRI (task based), Cerebrovascular reactivity, CVR
Cerebrovascular reactivity (CVR) can be estimated from the BOLD response to a vasoactive stimulus such as a breath-holding (BH) approximated by a sinusoidal regressor. We proposed a robust approach for estimating CVR using the frequency spectrum of BOLD data itself, without regressions or correlations with external recordings. We also estimated regional CVR time delay patterns using the BOLD signal phase relative to a non-brain reference. We demonstrate our pipeline in 18 healthy adults.Introduction
Cerebrovascular reactivity (CVR) provides a sensitive disease biomarker for a variety of cerebrovascular diseases.1–4 Existing methods employ general linear model (GLM) based regression or correlation with a vasoactive stimulus to extract CVR values from BOLD response to a vasoactive stimulus such as a breath-hold (BH) task.5–7 Such methods work best when end-tidal carbon dioxide partial pressure (PETCO2) is available. Alternatively, given a block-design BH task, modelling a BH task as a sinusoid8 or a Fourier series6 has demonstrated superior robustness when PETCO2 is available. It is questionable to what extent these existing methods will work without PETCO2 recordings, especially when subject cooperation is uncertain. We propose a novel approach for estimating the CVR from the frequency spectrum of BOLD data without modelling or correlation with other signals (e.g. PETCO2). We also employed the phase-based approach for estimating CVR time delay differences using the respiratory belt signal alone. By using data-driven CVR frequencies, our method avoids CVR estimation biases due to subject performance or regional CVR time delay variability. It also forgoes the need for PETCO2 recordings and thus can have a wide range of applications in studying patient populations.Methods
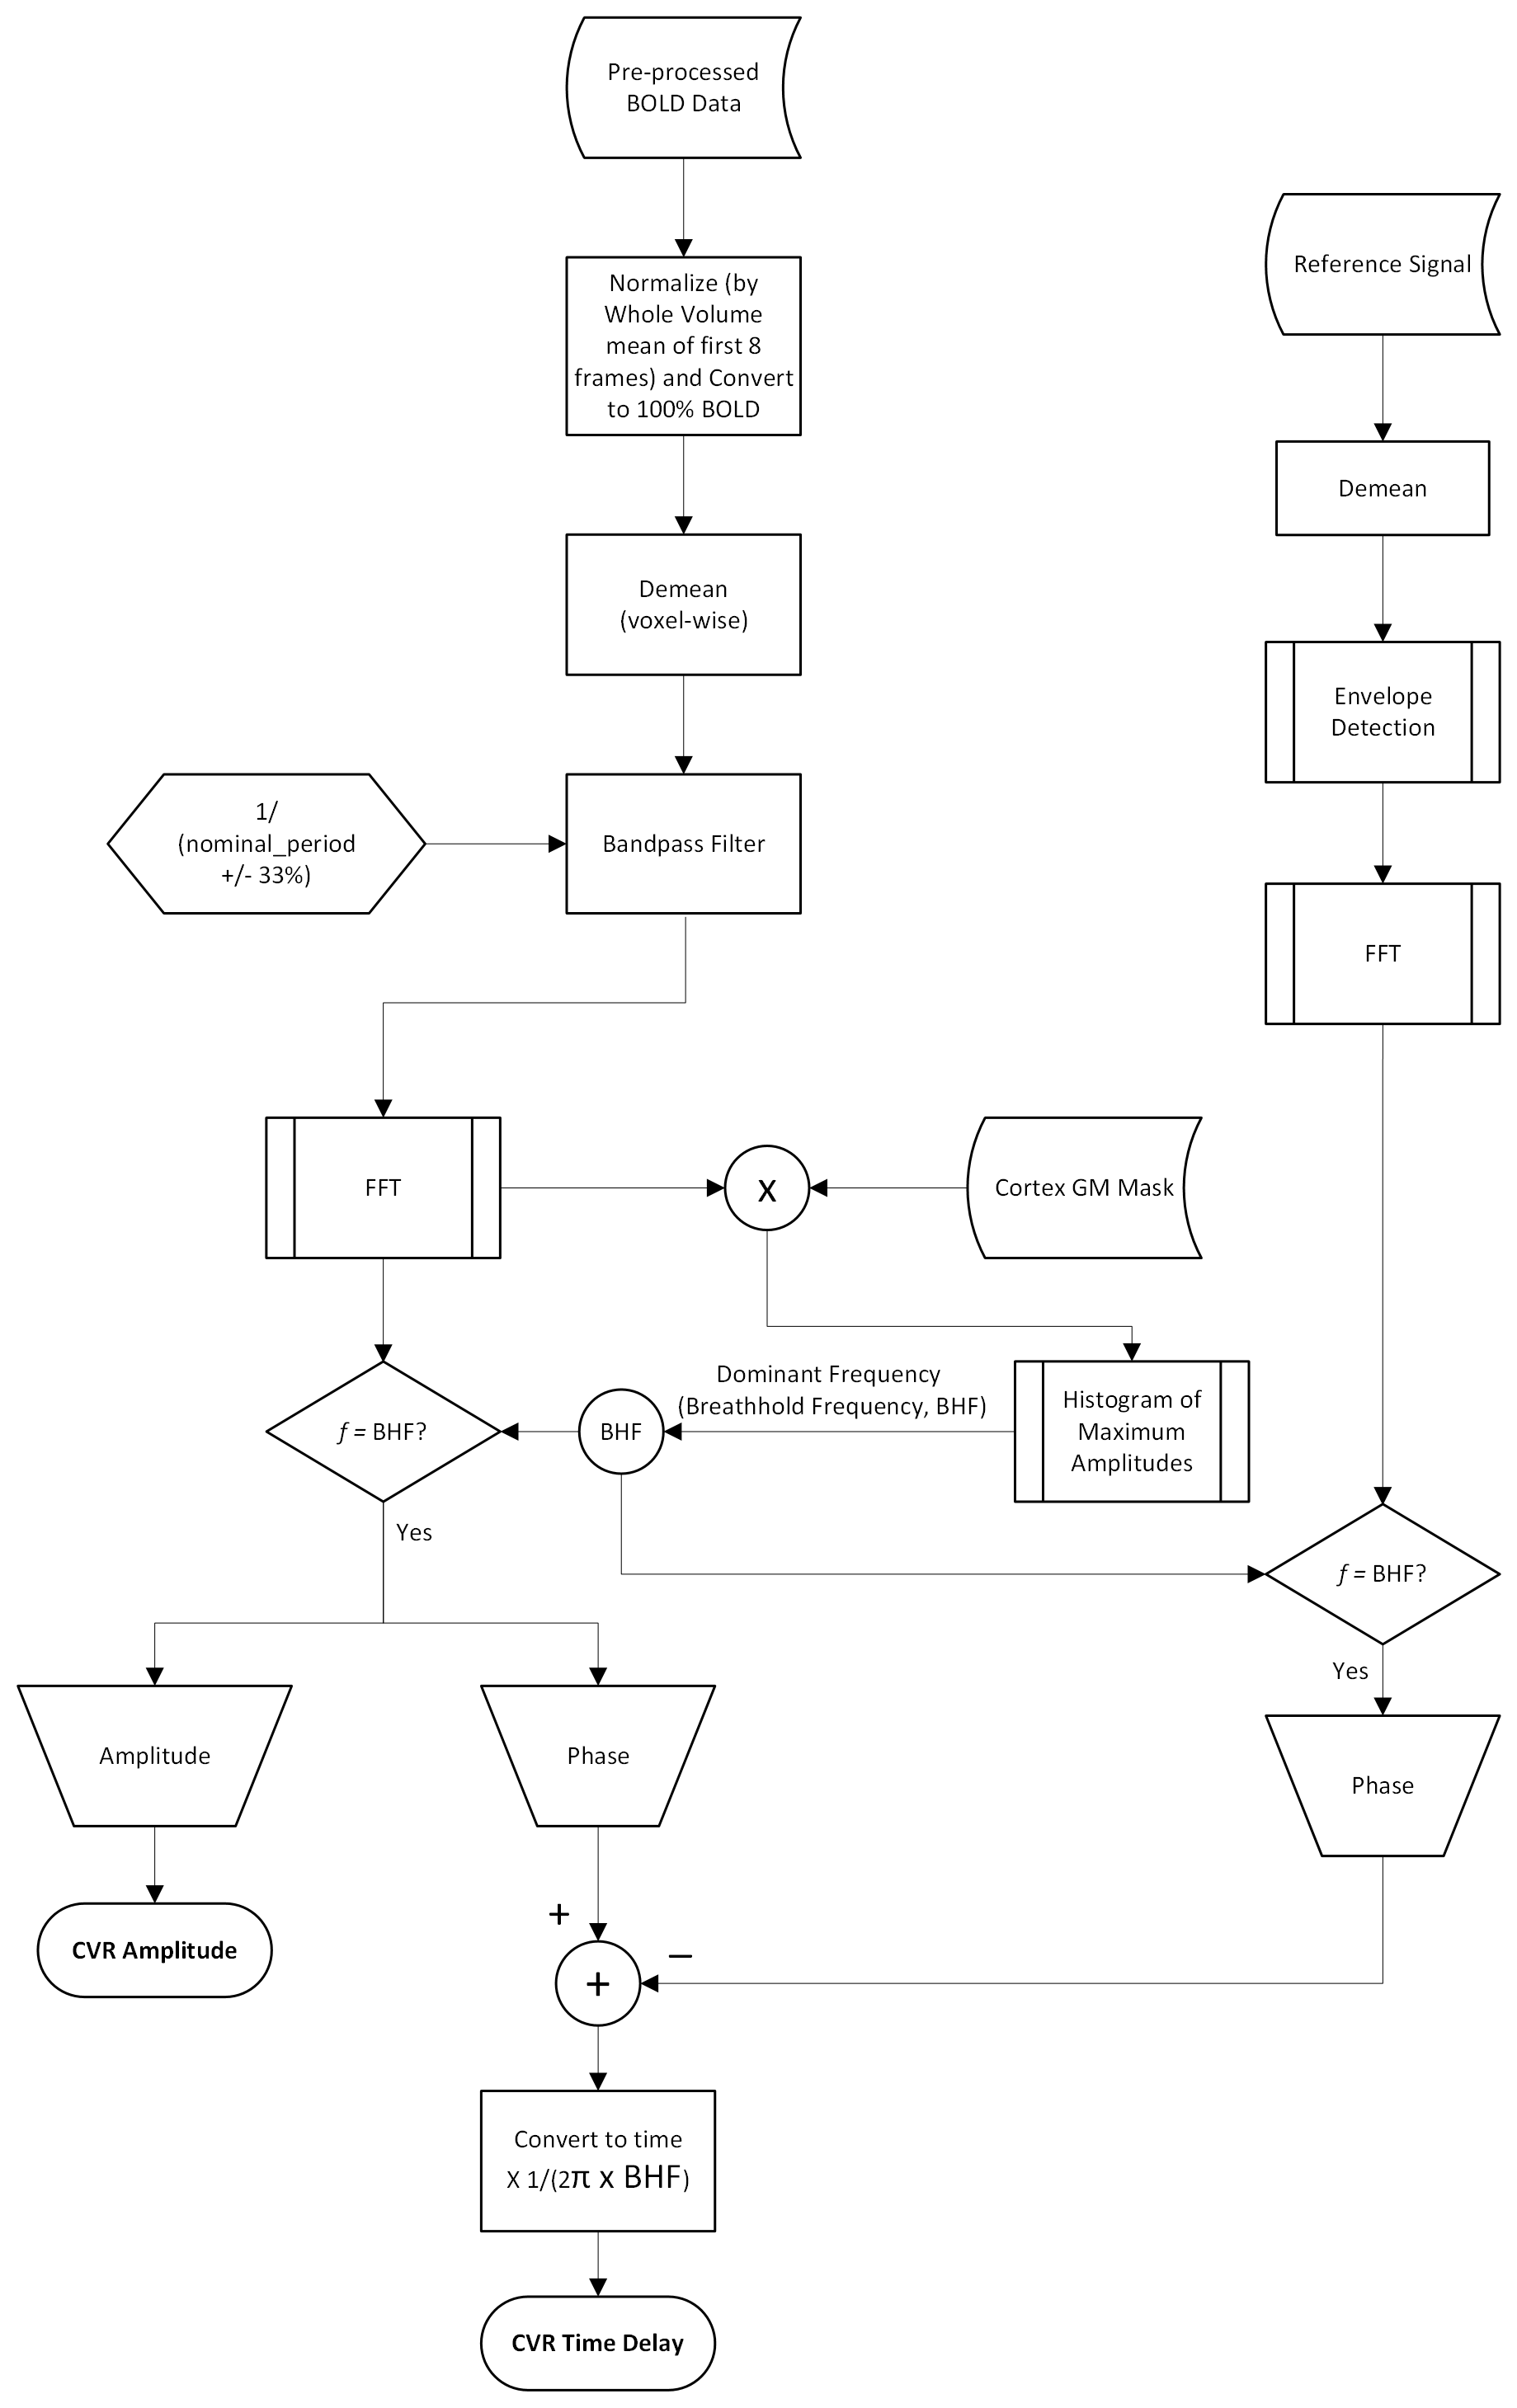
Figure 1 summarizes the proposed CVR estimation pipeline. The BOLD response to a block-design BH paradigm can be approximated by a sinusoid even if the ‘BH’ and ‘baseline’ periods are unequal8. We use this sinusoidal frequency as the target frequency to search for corresponding BOLD responses, generating a histogram of BOLD-response frequencies in the relevant frequency range (as the BOLD response may deviate slightly from the nominal task frequency due to regional variations or disease). This step also achieves quality control for the fMRI data in case a subject’s BH performance is poor. The BOLD signal is then band-pass filtered to encompass the data-driven task frequency. CVR amplitude is taken as the BOLD response amplitude at the dominant frequency (i.e. the frequency exhibited by most voxels in the BOLD-response frequency histogram of cortical voxels). The voxelwise CVR time delay was estimated as the difference between the phase angle of the de-meaned respiratory belt signal envelope at the BH frequency.We demonstrate our method on 18 healthy volunteers (mean age=70.22 years), imaged on a Siemens Trio 3T system. Each subject followed 6 repeats of 15 s breath-hold followed by a 30 s resting and 2 s exhale (period = 47 s), during which BOLD fMRI data were acquired with T2*-weighted EPI (voxel size = 3.4x3.4x6.0 mm3, TE1/TE2/TR = 9.1/25/4000 ms). Respiratory bellows were recorded using the scanner’s built-in belt. A T1 anatomical reference was also acquired. For each subject, a FreeSurfer reconstruction was performed on the T1 anatomical to generate tissue parcellations by nonlinear spatial registration to the default GCA atlas for later use. The nominal sinusoidal frequency is 0.021 Hz and thus, the passband frequencies are [0.016, 0.032] Hz corresponding to a period [47(1 +/- 0.33)] s.
Results
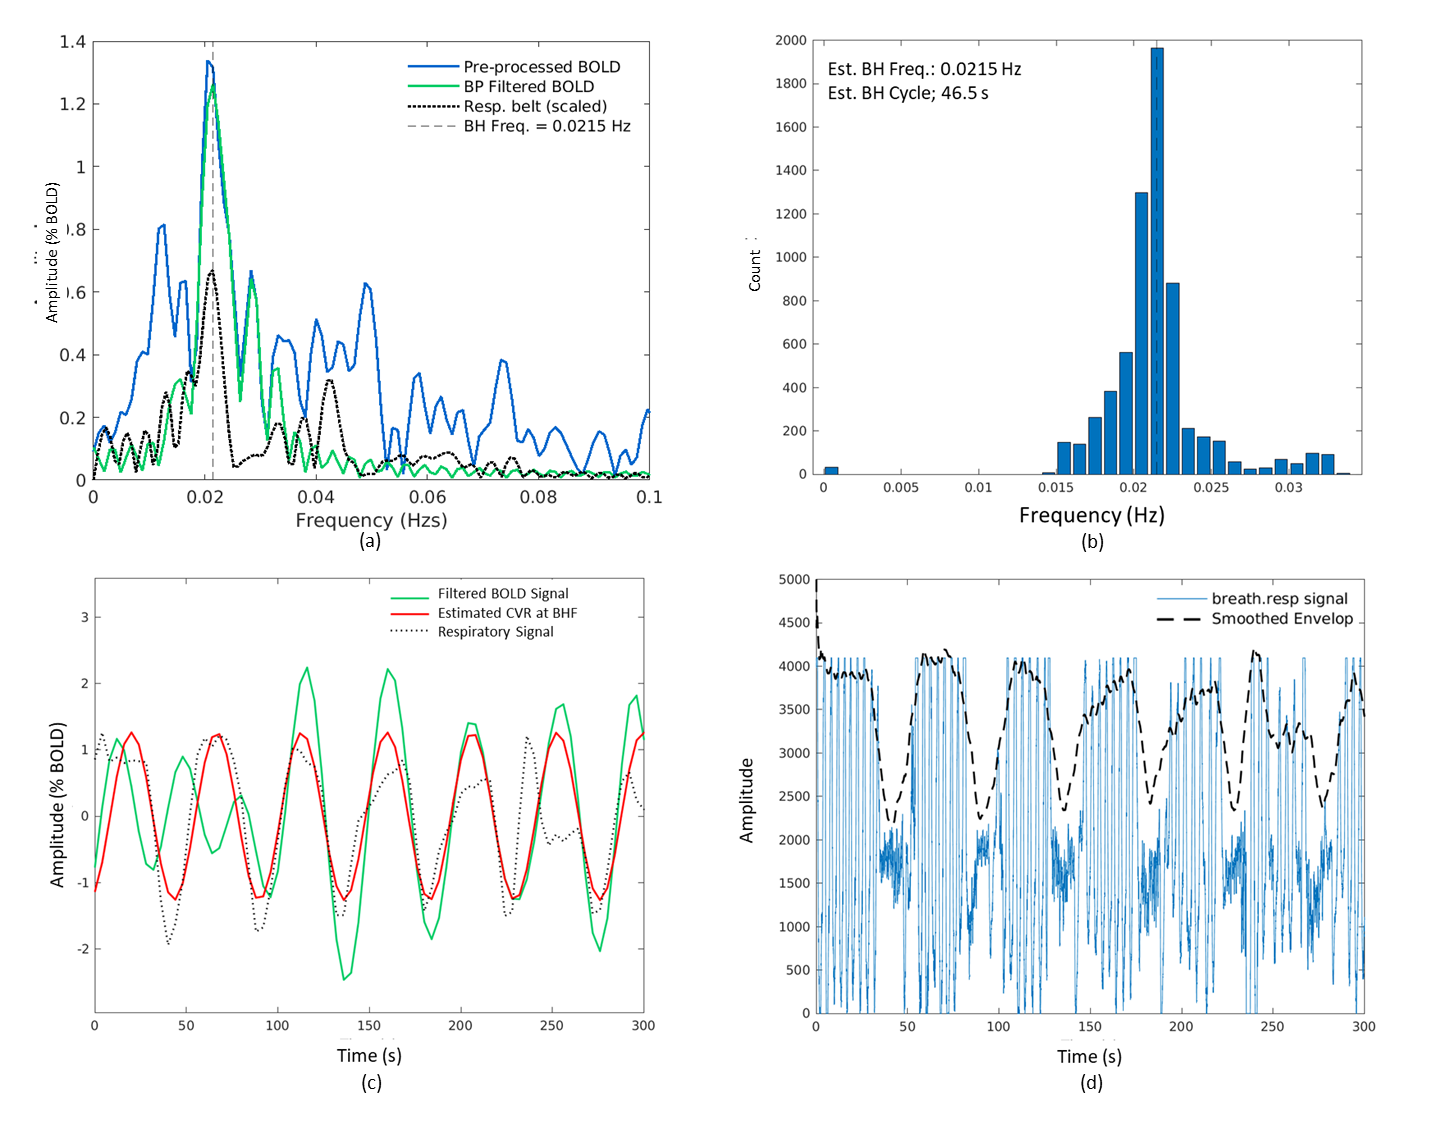
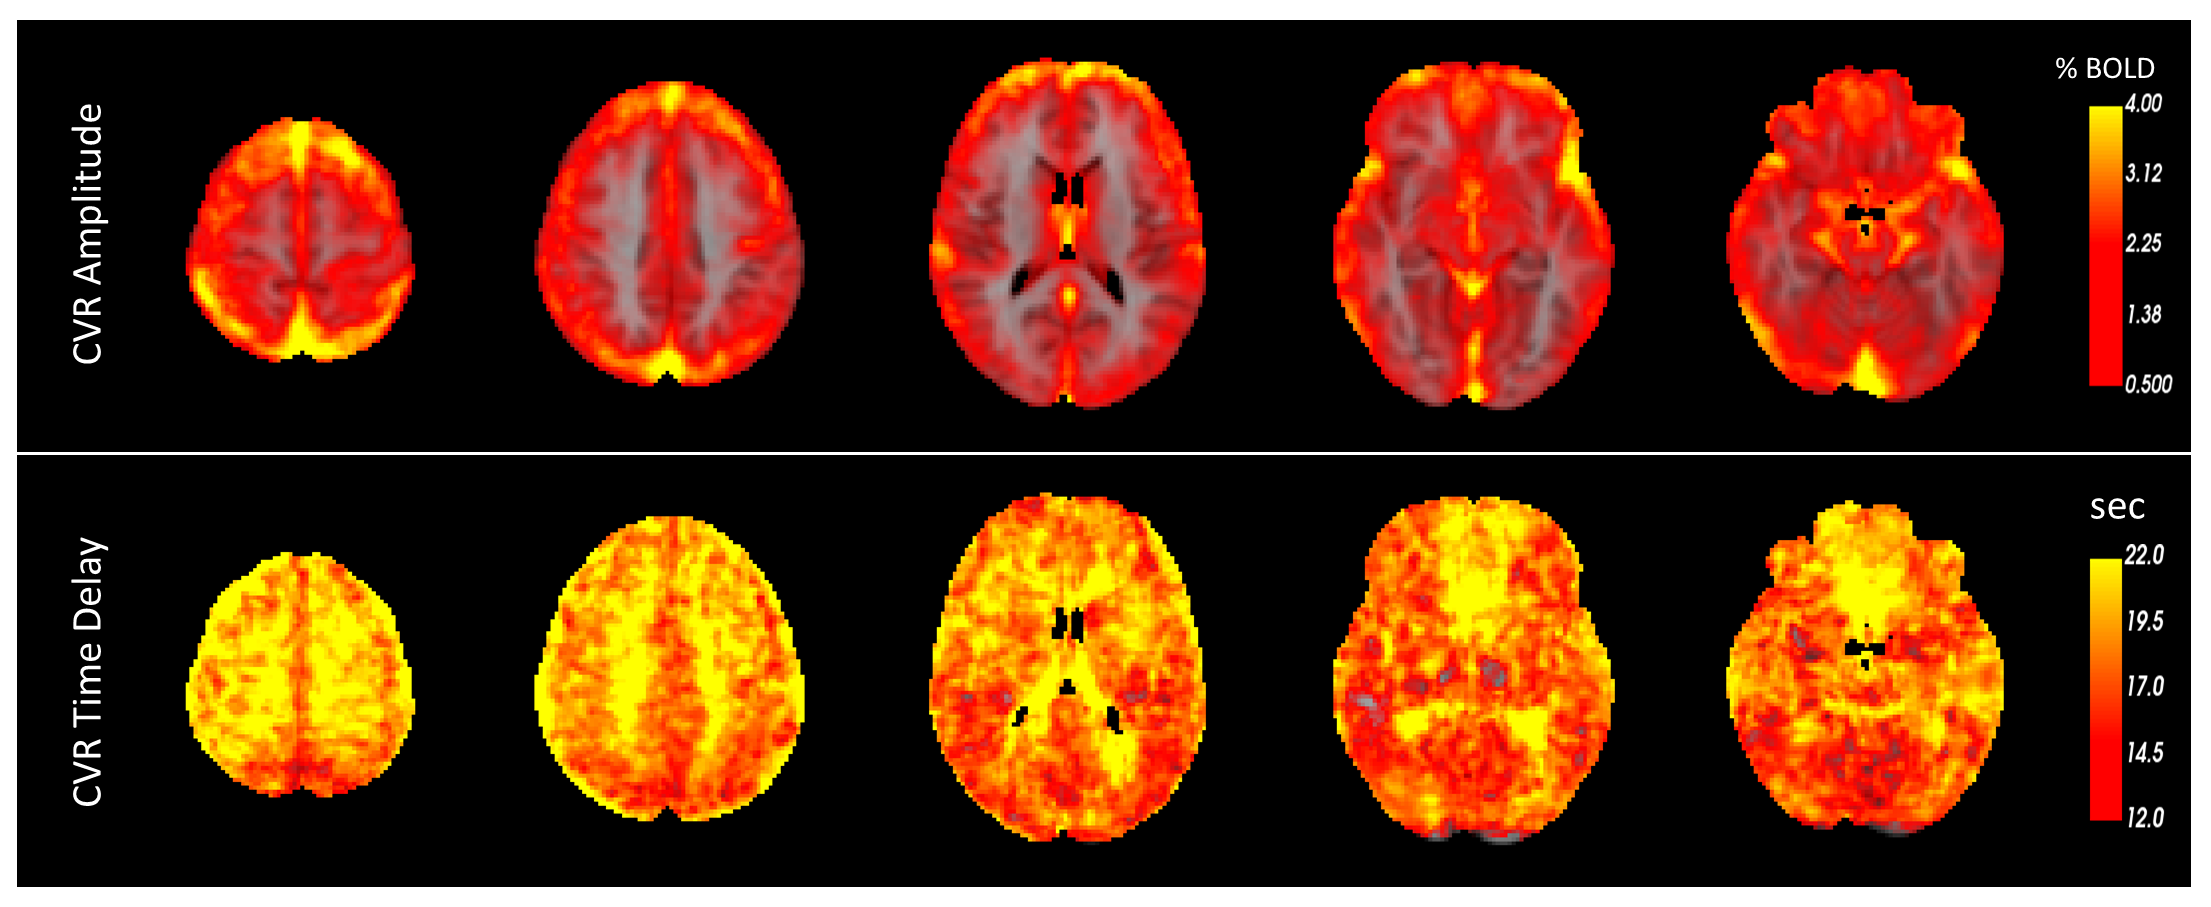
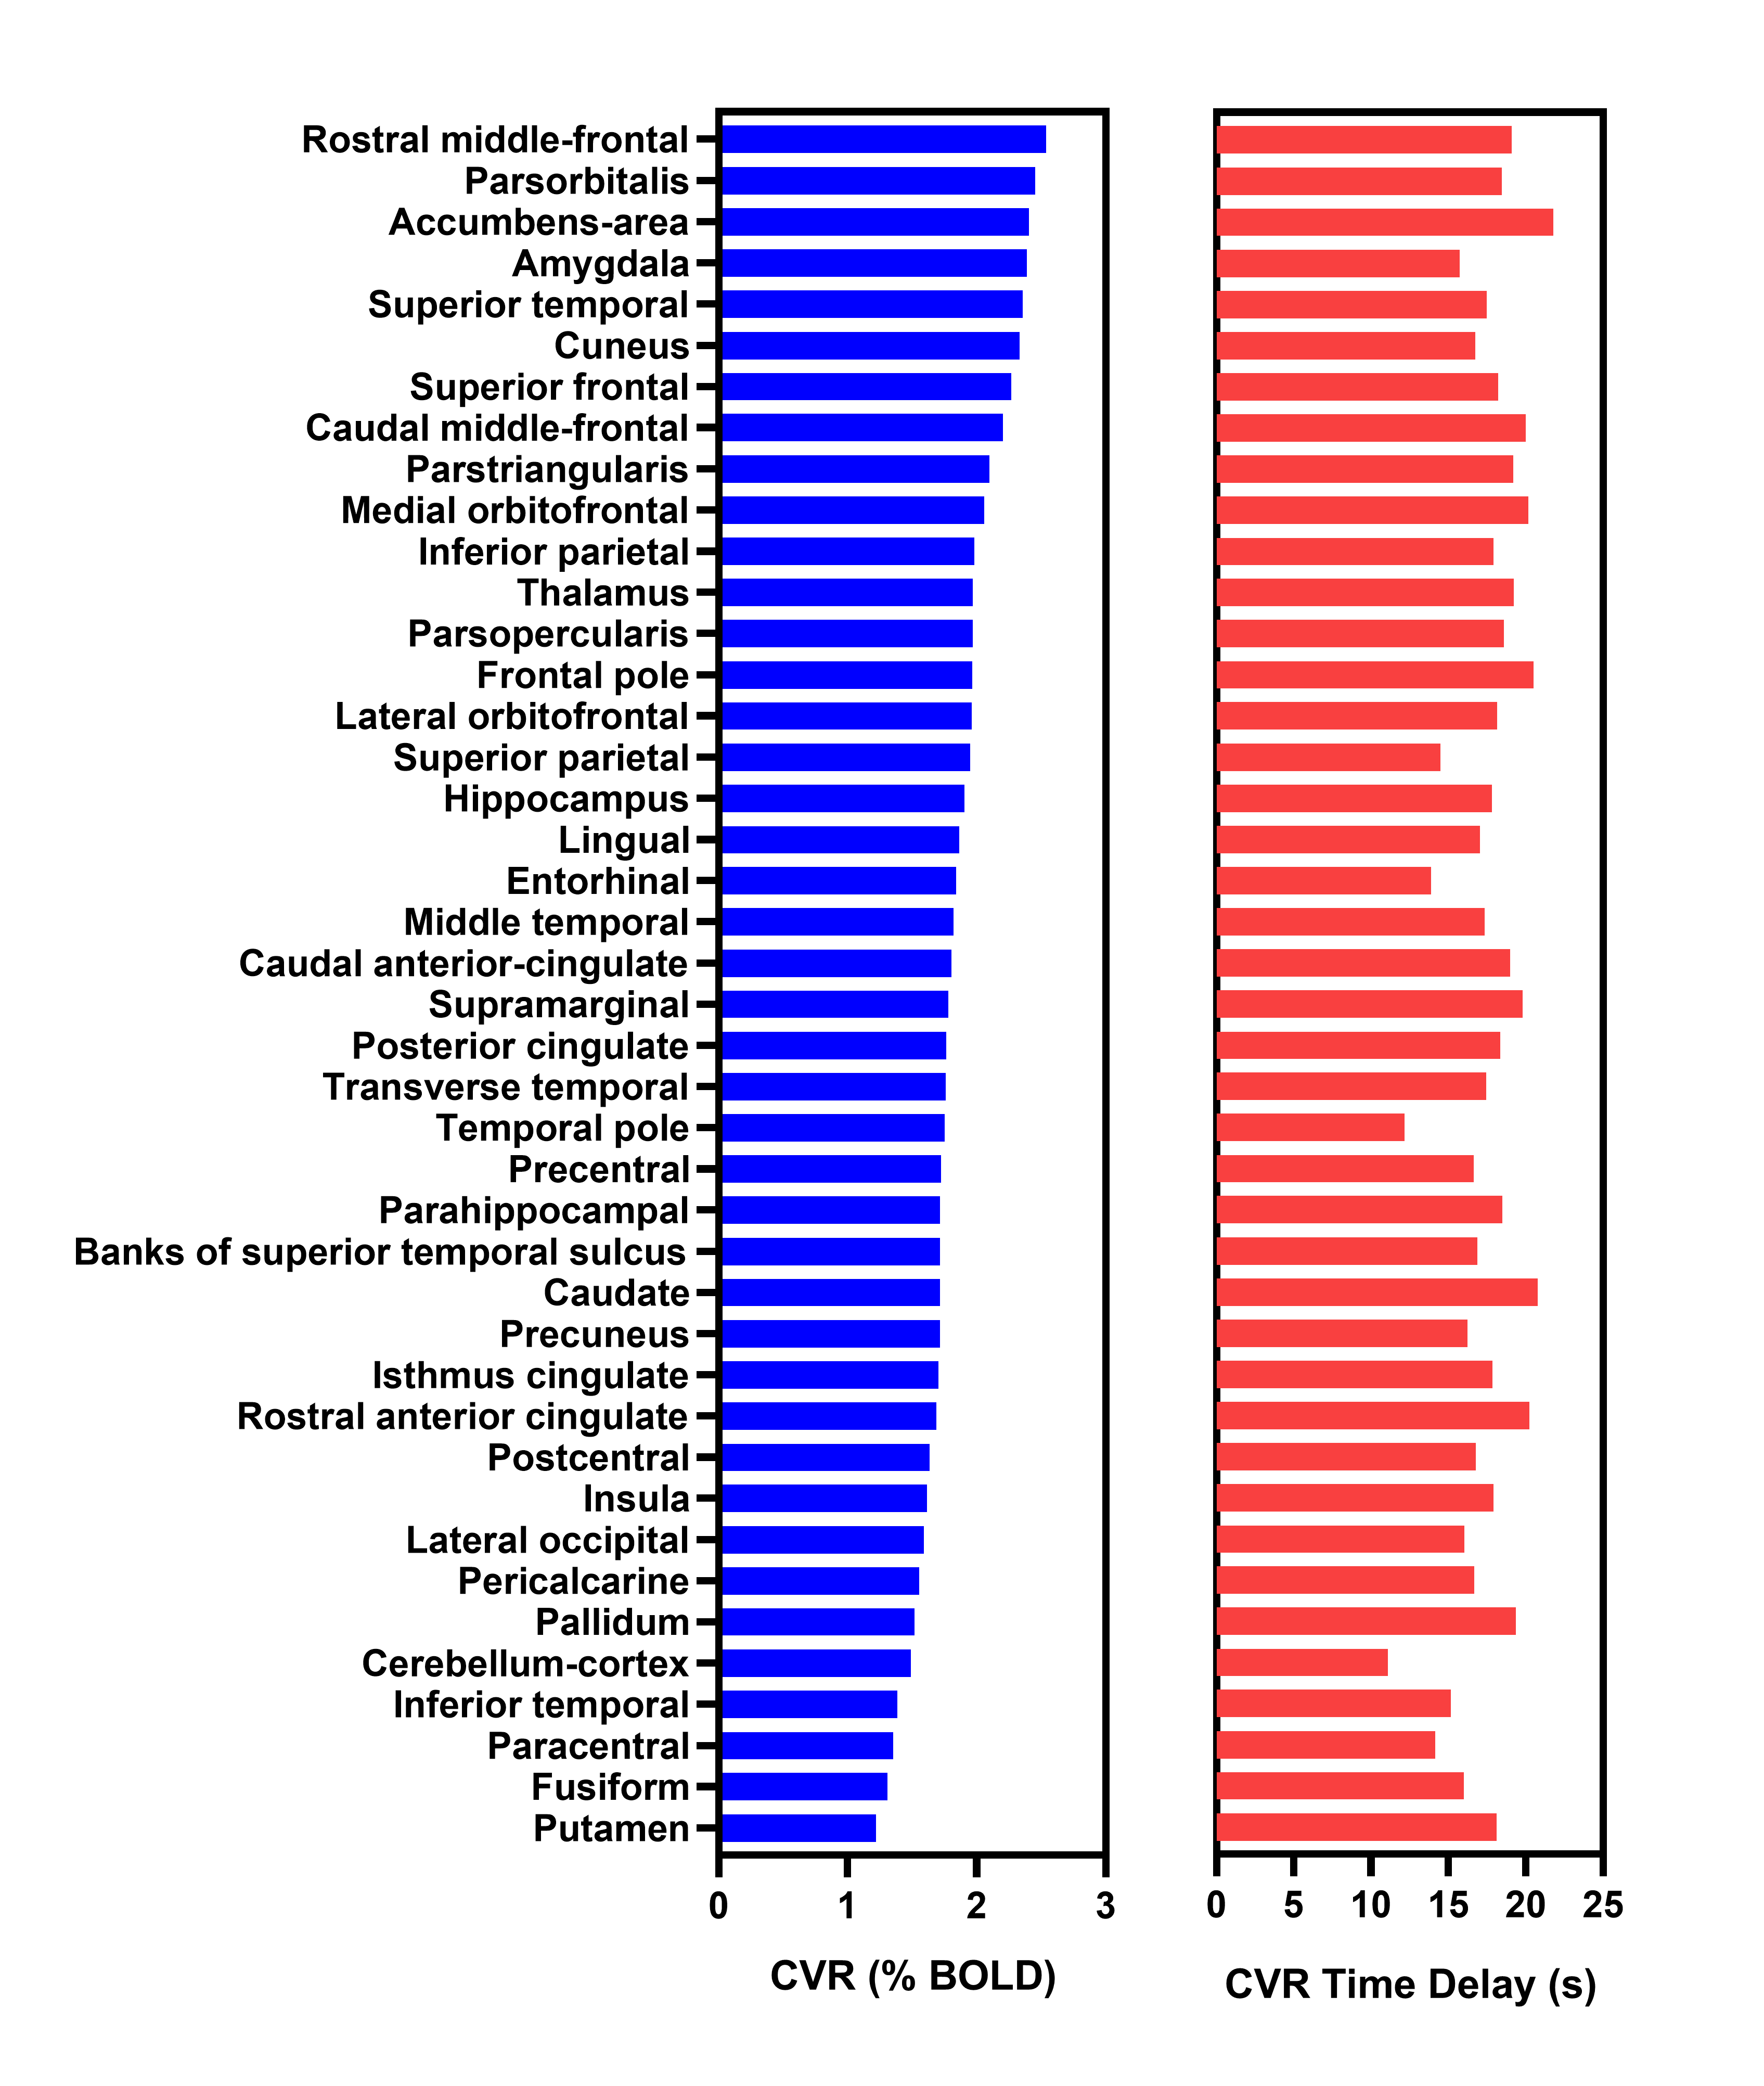
Bandpass filtering suppressed spurious signals outside the targeted BH frequency range (see Figure 2a). Across all cortical voxels, the most commonly observed frequency corresponding to the maximum amplitude of the BOLD Fourier spectrum was selected as the dominant frequency for estimating CVR. Figure 2b shows the histogram of maximum amplitudes of the spectrum in all cortical voxels. The filtered BOLD signal is well-modelled by the sinusoidal approximation and closely follows the respiratory belt signal as shown in Figure 2c. Figure 2d shows the recorded full respiratory belt signal and the extracted BH pattern from the smoothed envelope. Figure 3 shows the average CVR amplitude (%BOLD) maps and time delay (relative to the respiratory belt signal) for all subjects. GM regions in the cortex generally have a high CVR amplitude and shorter response delays than the WM and other areas of the brain. However, within the GM, there is no clear association between CVR amplitude and time delay as visible in Figure 4 for sub-regions in the cortex.Discussion and Conclusions
Breath-holding is easier to implement experimentally than conventional gas-inhalation methods5,8, but ensuring task performance can be challenging in certain populations9. In this work, we proposed a pipeline that includes data-driven adaptive capturing of the BH response irrespective of subject compliance, ensuring greater robustness in estimating the CVR using the BH task and serving as quality control of BH data, without the need for PETCO2 recordings. The CVR amplitude is estimated in units of %BOLD directly from the data-driven BH frequency. Serious deviations from the designed task paradigm were suppressed and thus did not bias the estimated CVR values. Also, CVR time delay could be estimated relative to a meaningful non-brain reference point, such as the ventricles, or an external signal like a respiratory belt recording in this work. While these results for healthy subjects showed agreement with previous similar studies, the sinusoidal approximation is more optimal for paradigms with reasonably similar ‘BH’ and ‘baseline’ periods but can be easily extended to suit more timing paradigms by adding harmonics6. We demonstrate our pipeline in a study of diabetes and hypertension in a separate abstract.Acknowledgements
This work was funded by grants from the Canadian Institutes for Health Research (MOP 111244 and FDN 148398).References
1. Geranmayeh, F., Wise, R. J. S., Leech, R. & Murphy, K. Measuring vascular reactivity with breath-holds after stroke: a method to aid interpretation of group-level BOLD signal changes in longitudinal fMRI studies. Hum. Brain Mapp. 36, 1755–1771 (2015).
2. Iranmahboob, A. et al. Vascular Reactivity Maps in Patients with Gliomas Using Breath-Holding BOLD fMRI. J. Neuroimaging 26, 232–239 (2016).
3. Conijn, M. M. A. et al. Microbleeds, lacunar infarcts, white matter lesions and cerebrovascular reactivity -- a 7 T study. Neuroimage 59, 950–956 (2012).
4. Wu, P.-H. et al. MRI evaluation of cerebrovascular reactivity in obstructive sleep apnea. J. Cereb. Blood Flow Metab. 40, 1328–1337 (2020).
5. Bright, M. G. & Murphy, K. Reliable quantification of BOLD fMRI cerebrovascular reactivity despite poor breath-hold performance. Neuroimage 83, 559–568 (2013).
6. Pinto, J., Jorge, J., Sousa, I., Vilela, P. & Figueiredo, P. Fourier modeling of the BOLD response to a breath-hold task: Optimization and reproducibility. Neuroimage 135, 223–231 (2016).
7. Pinto, J., Bright, M. G., Bulte, D. P. & Figueiredo, P. Cerebrovascular Reactivity Mapping Without Gas Challenges: A Methodological Guide. Front. Physiol. 11, 608475 (2020).
8. Murphy, K., Harris, A. D. & Wise, R. G. Robustly measuring vascular reactivity differences with breath-hold: normalising stimulus-evoked and resting state BOLD fMRI data. Neuroimage 54, 369–379 (2011).
9. Jahanian, H. et al. Measuring vascular reactivity with resting-state blood oxygenation level-dependent (BOLD) signal fluctuations: A potential alternative to the breath-holding challenge? J. Cereb. Blood Flow Metab. 37, 2526–2538 (2017).
Figures