2022
XTE: The All-in-One Short-TE Imaging Sequence1Division of Medical Physics, Department of Radiology, University Medical Center Freiburg, Freiburg, Germany
Synopsis
Keywords: Pulse Sequence Design, New Trajectories & Spatial Encoding Methods
XTE is a general implementation of various sequences, namely UTE, ZTE, SPI, PETRA, and gmPETRA. Each sequence type and their combinations can be realized within XTE by adjusting only a few parameters. We provide phantom and in vivo images acquired with XTE for different sequence settings.
Introduction
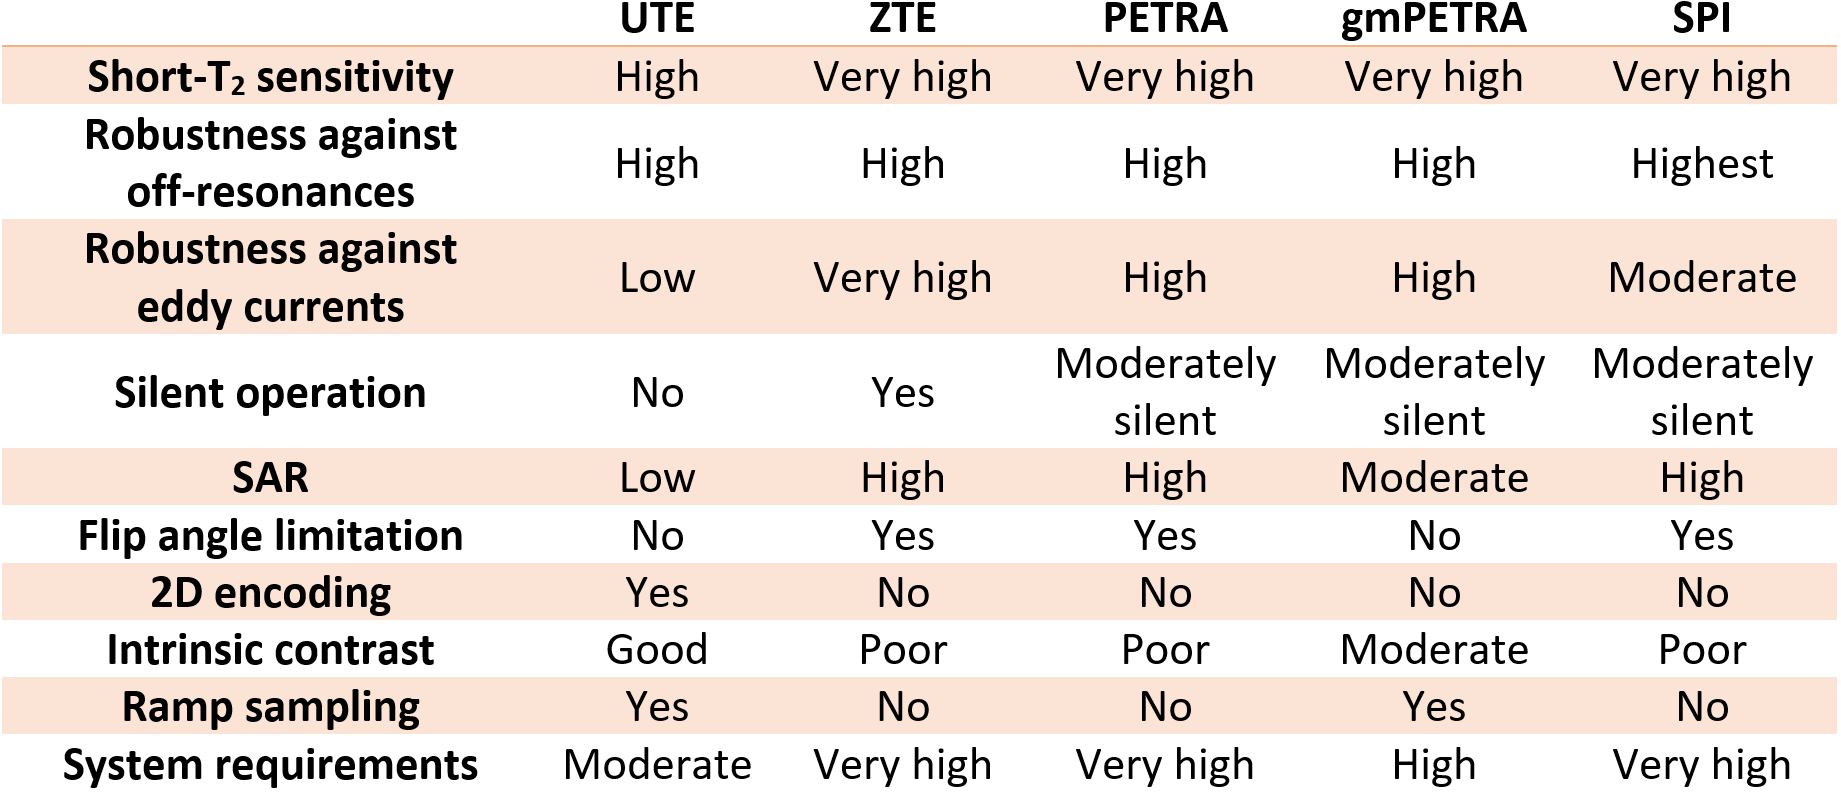
To image tissues with ultra-short T2 and T2* such as bone, tooth, or lung parenchyma, MR sequences with ultra-short TE have been developed including UTE1, ZTE2,3, PETRA4, and SPI5. Some of these sequences are available for clinical practice, but a systematic comparison and optimization for specific applications are still lacking. For example, ZTE MRI has a higher short-T2 sensitivity and resolution, greater resilience against B0 inhomogeneity effects and it is more robust against eddy currents compared to UTE. ZTE offers silent data acquisition for an increased patient comfort. However, ZTE imaging has also disadvantages6–8: it requires high-bandwidth RF excitation resulting in elevated SAR and limited flip angles, it has limited contrast and acquisition bandwidth due to the intrinsic dead time, and it can only be used for 3D encoding. The PETRA sequence overcomes the bandwidth limitation by filling the k-space gap using SPI after the radial ZTE acquisition. By modulating the gradient amplitude during excitation gmPETRA sequence enables higher-bandwidth excitation. The advantages and disadvantages of these sequences are presented in Table 1.In this work, a generalized sequence, XTE, is presented that combines all the above sequence concepts. Each sequence type and their combinations can be realized within XTE by adjusting only a few parameters. We provide phantom and in vivo images acquired with XTE for different sequence settings.
Methods
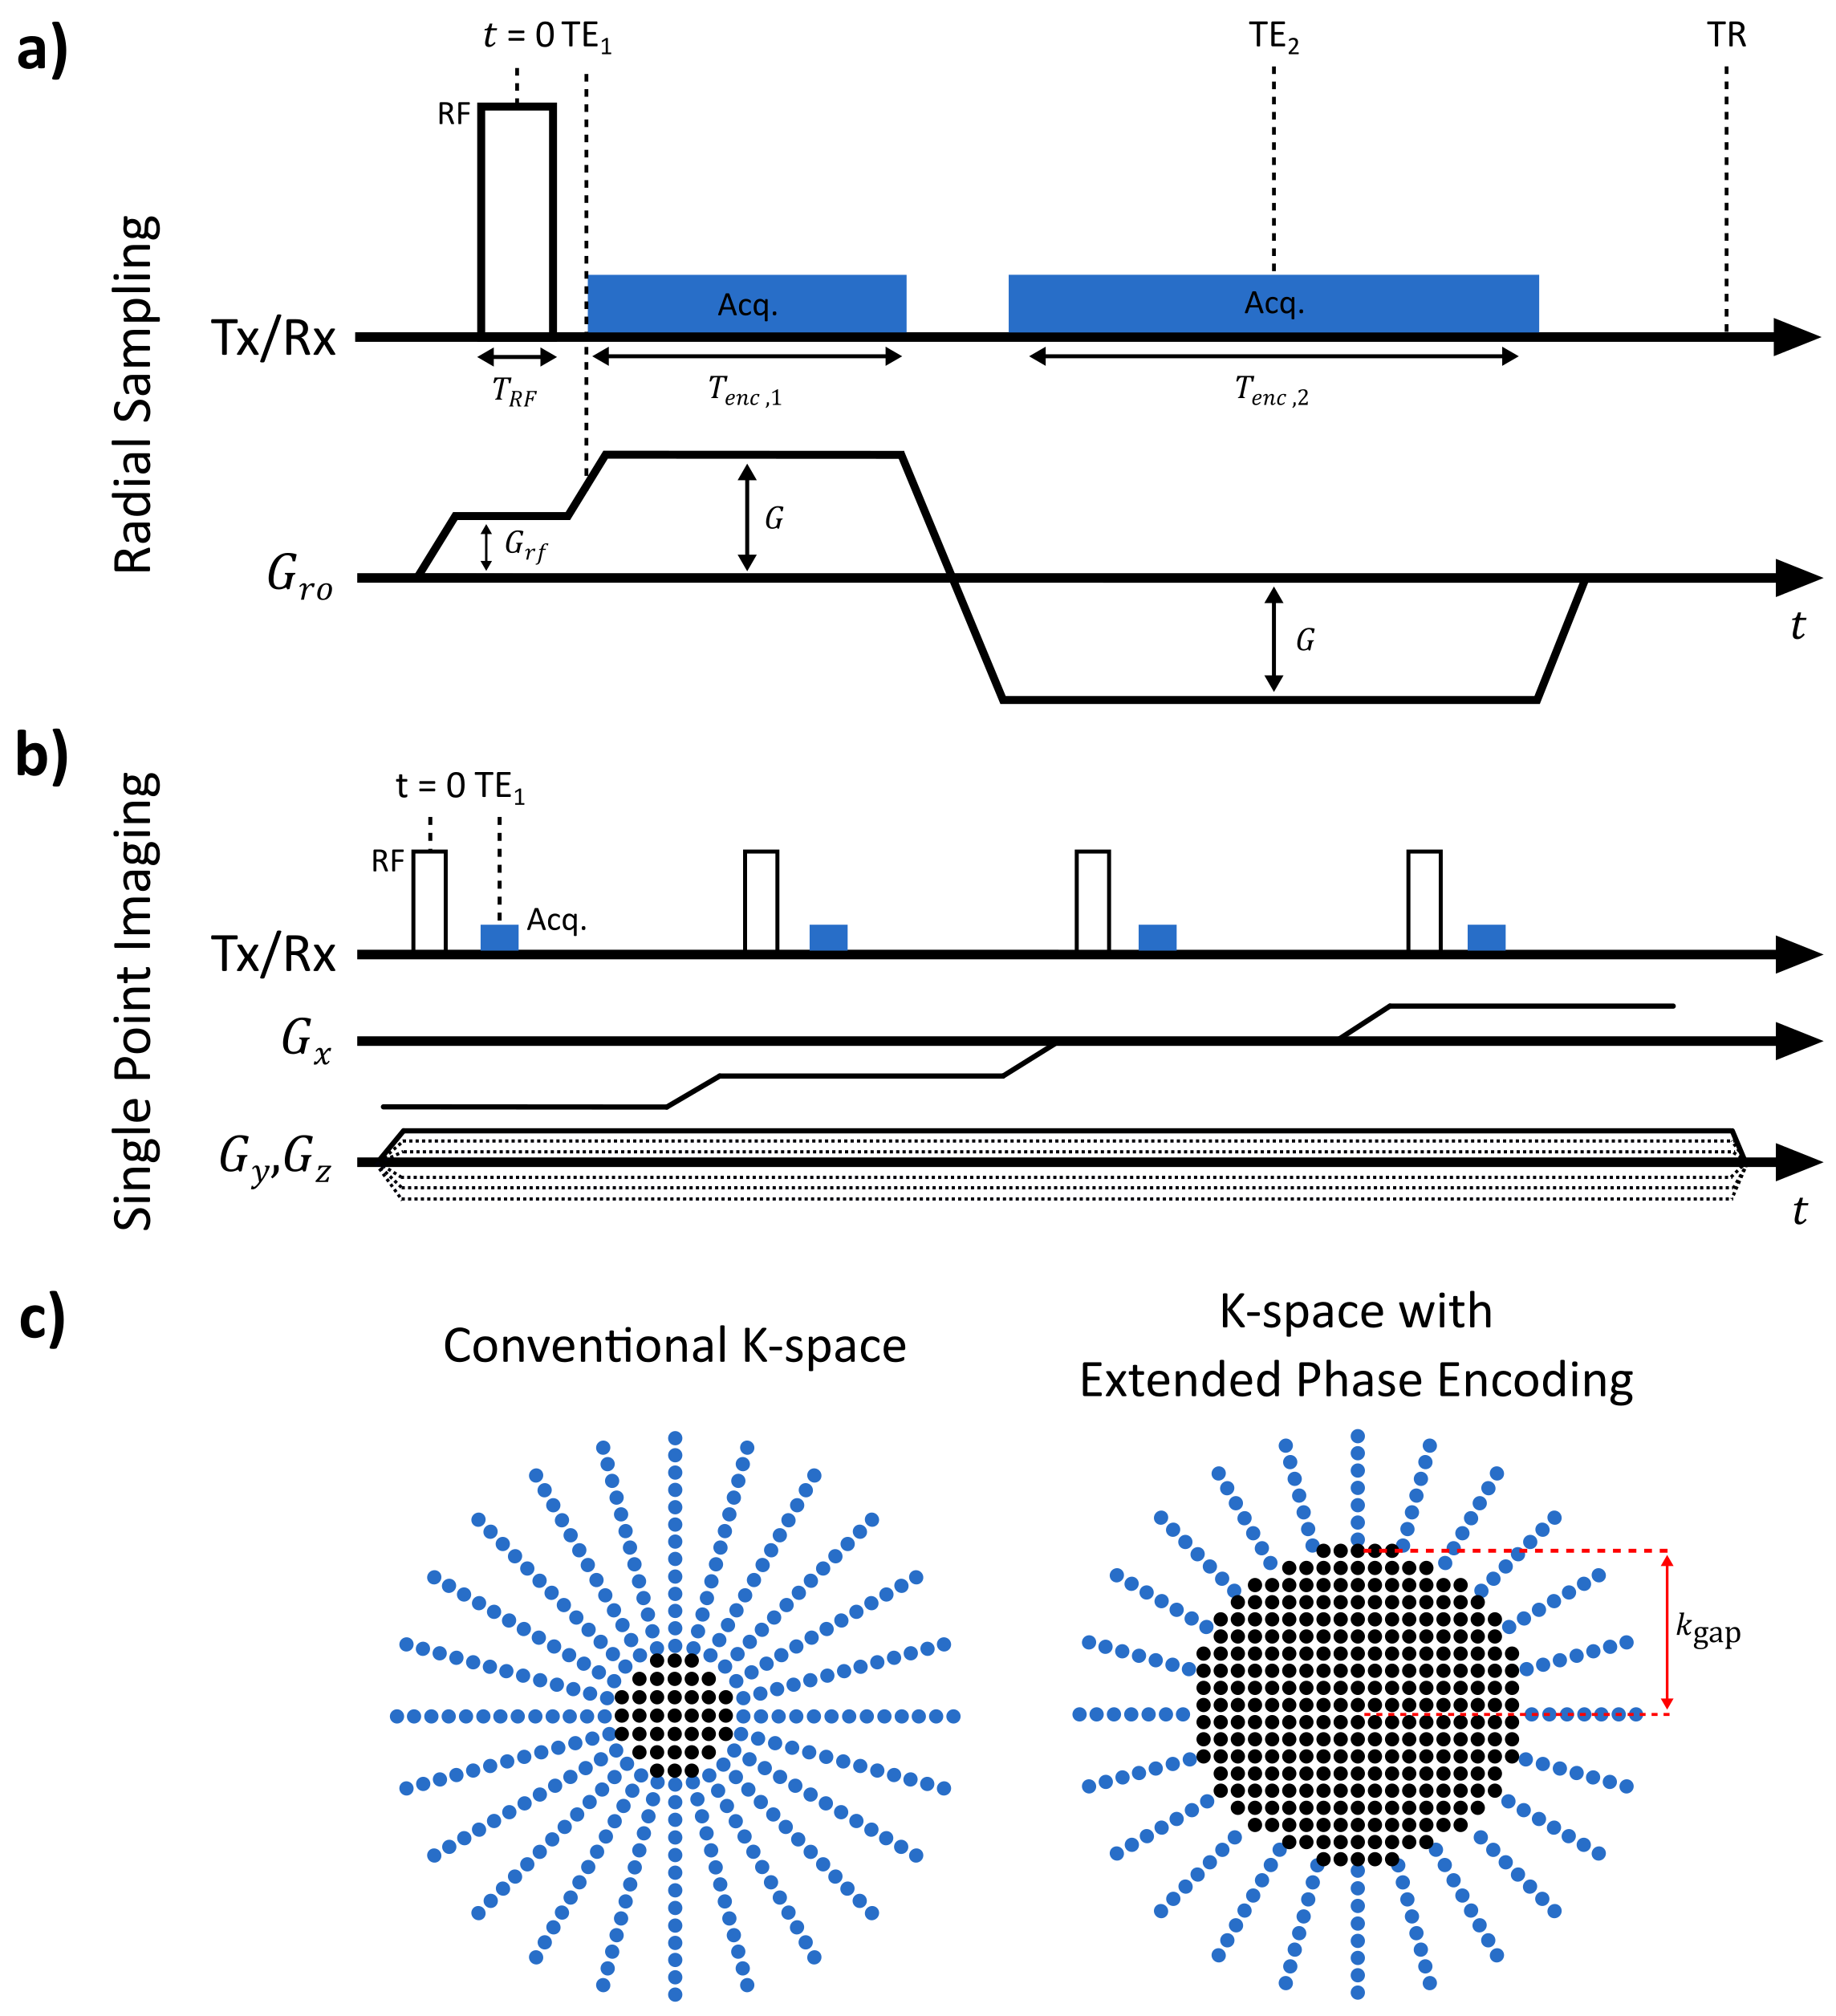
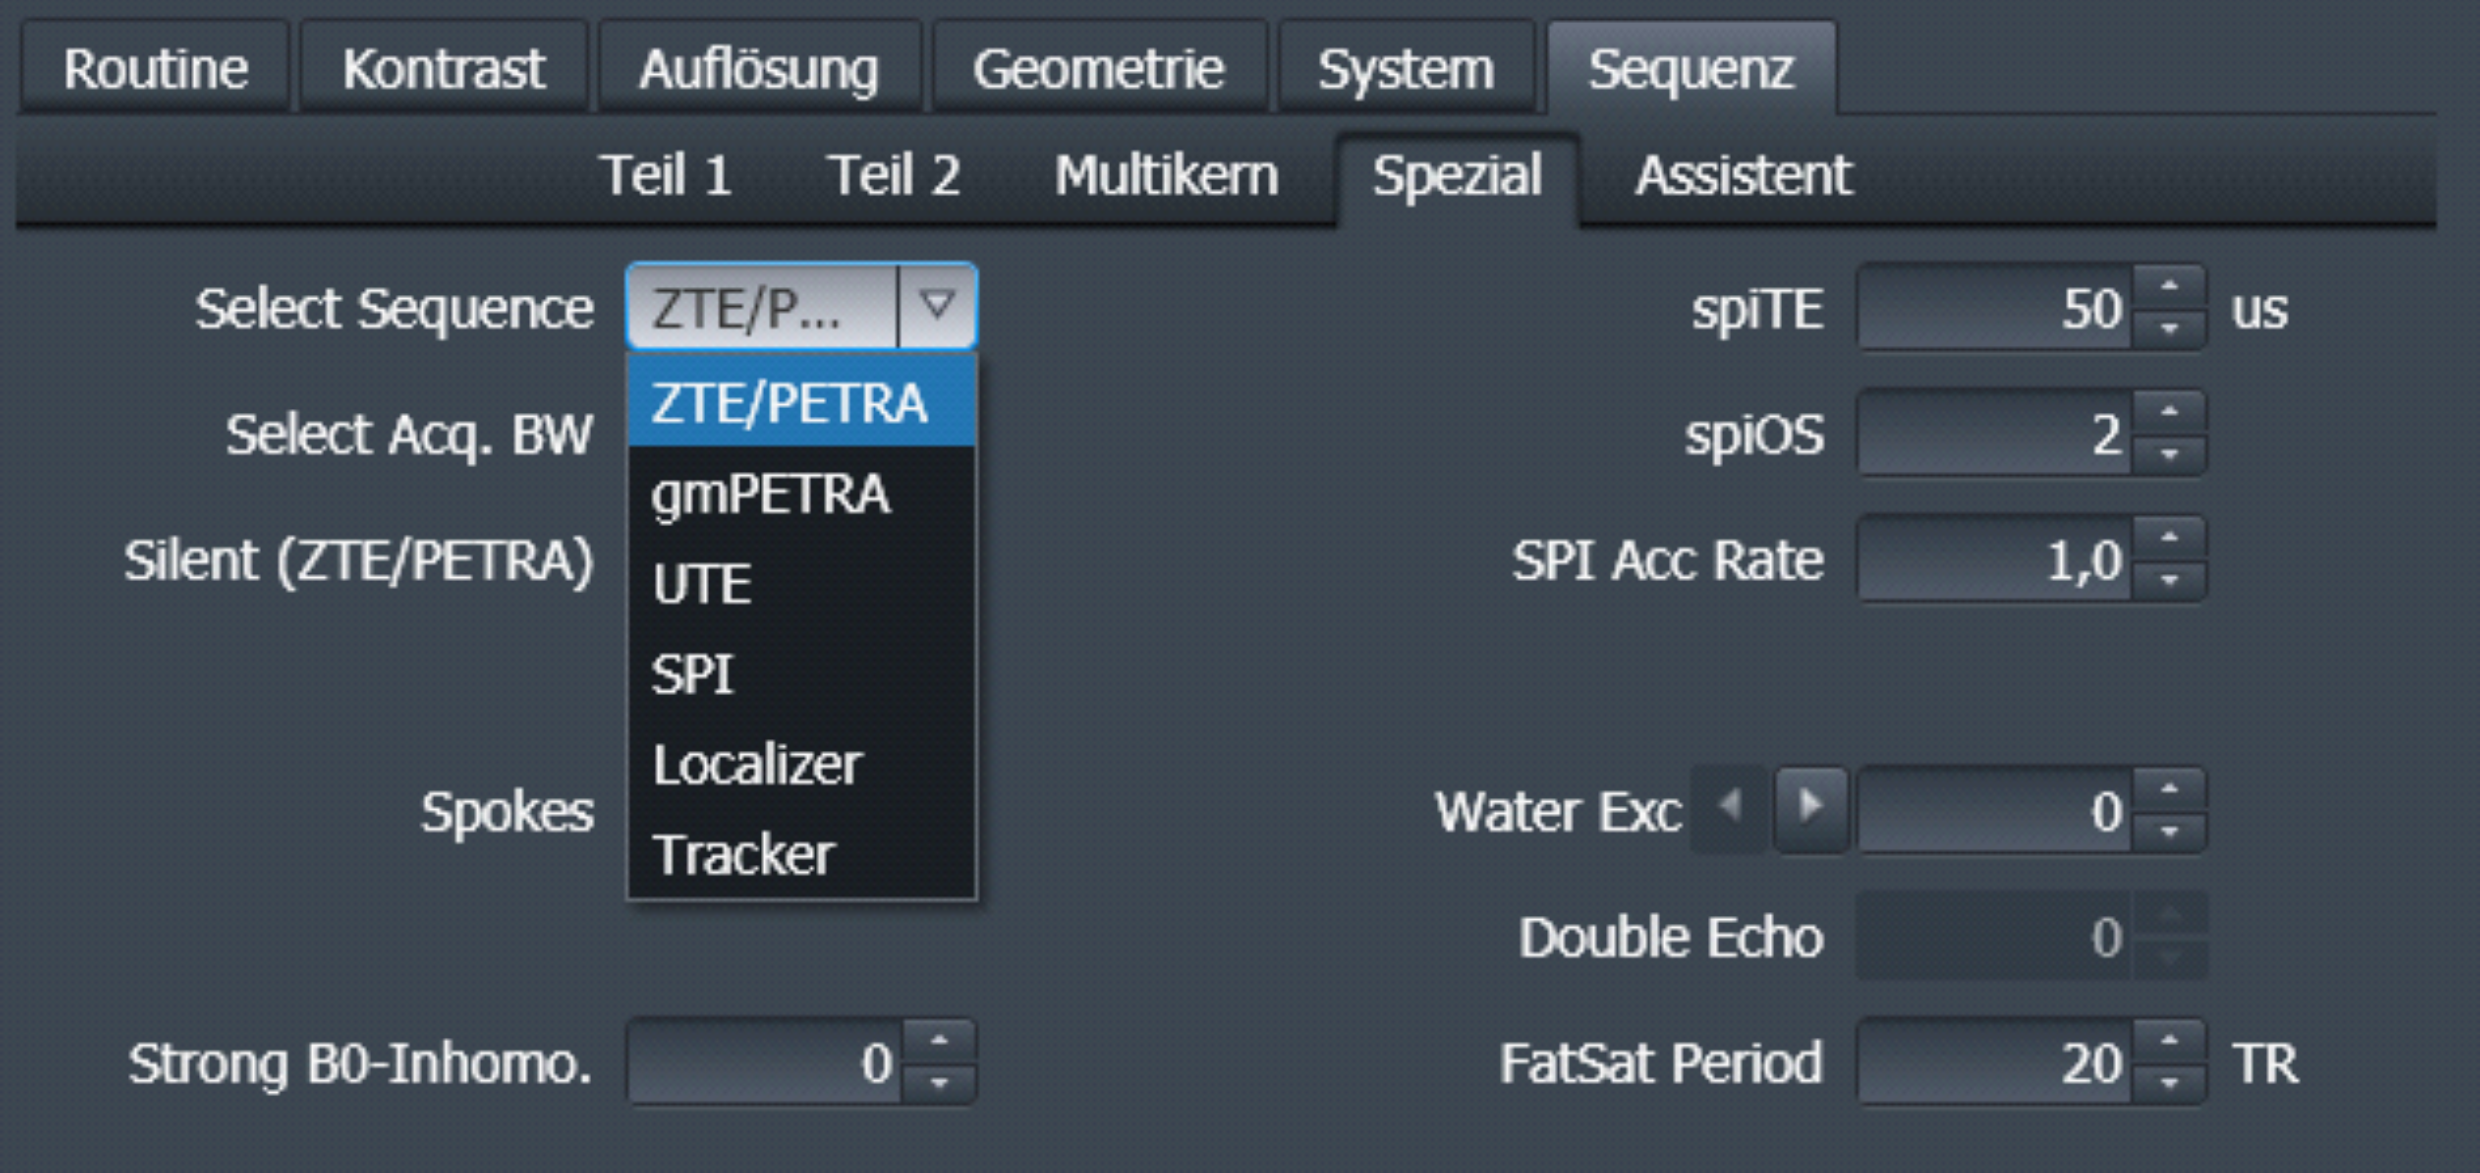
A rectangular 8µs-long RF pulse ($$$T_{RF}$$$=8µs) is used for excitation (for UTE: $$$T_{RF}$$$=20µs). For ZTE, PETRA, and SPI a radial gradient (amplitude $$$G_{rf}$$$) is applied during excitation, whereas $$$G_{rf}$$$=0 for UTE (Fig.1). When ZTE/PETRA is selected (Fig.2), $$$G_{rf}$$$ is set to the readout gradient amplitude $$$G$$$, whereas for gradient-modulated PETRA (gmPETRA) $$$G_{rf}$$$ is set to fit the FOV within the full-width-half-maximum (FWHM) of the excitation profile. Encoding times ($$$T_{enc,1}$$$ and $$$T_{enc,2}$$$) are calculated from the given readout gradient waveform and desired resolution.The size of the central phase encoding region for single point imaging (SPI) is determined with TE (spiTE in Fig.2) independent from the selected sequence (Fig.1c):
$$k_{gap}= \int_{0}^{\text{TE}} G_{ro}(t)dt$$
$$N_{gap}=k_{gap}\cdot \text{FOV} \cdot \text{OS}_{\text{SPI}}$$
$$N_{SPI}=\frac{4}{3}\pi N_{gap}^3$$
where $$$N_{gap}$$$ is the number of missing dwells along a radial spoke, and $$$N_{SPI}$$$ is the total number of SPI points. When the SPI and radial samples overlap in k-space, radial samples are omitted during reconstruction.
Using $$$G_{rf}$$$ and TE of the SPI as variables, XTE is a generalization of all other short-TE sequences. Increasing $$$G_{rf}$$$ and TE increases $$$k_{gap}$$$, resulting in an increase of the phase-encoded portion of k-space (Fig.1c). Thus, the XTE sequence can be adapted from full radial frequency encoding (UTE, ZTE) via a hybrid acquisition (PETRA) to full phase encoding (SPI) acquisition.
In silent ZTE and PETRA, the readout gradients are not ramped down after the acquisition; this can cause overheating of the gradient system stopping the measurement. By disabling the silent option, gradients are ramped down to decrease the gradient duty cycle for cooling. In addition, XTE also incorporates 1-1 binomial excitation pulses, double echo acquisition, inversion recovery, and frequency-selective fat suppression pulses.
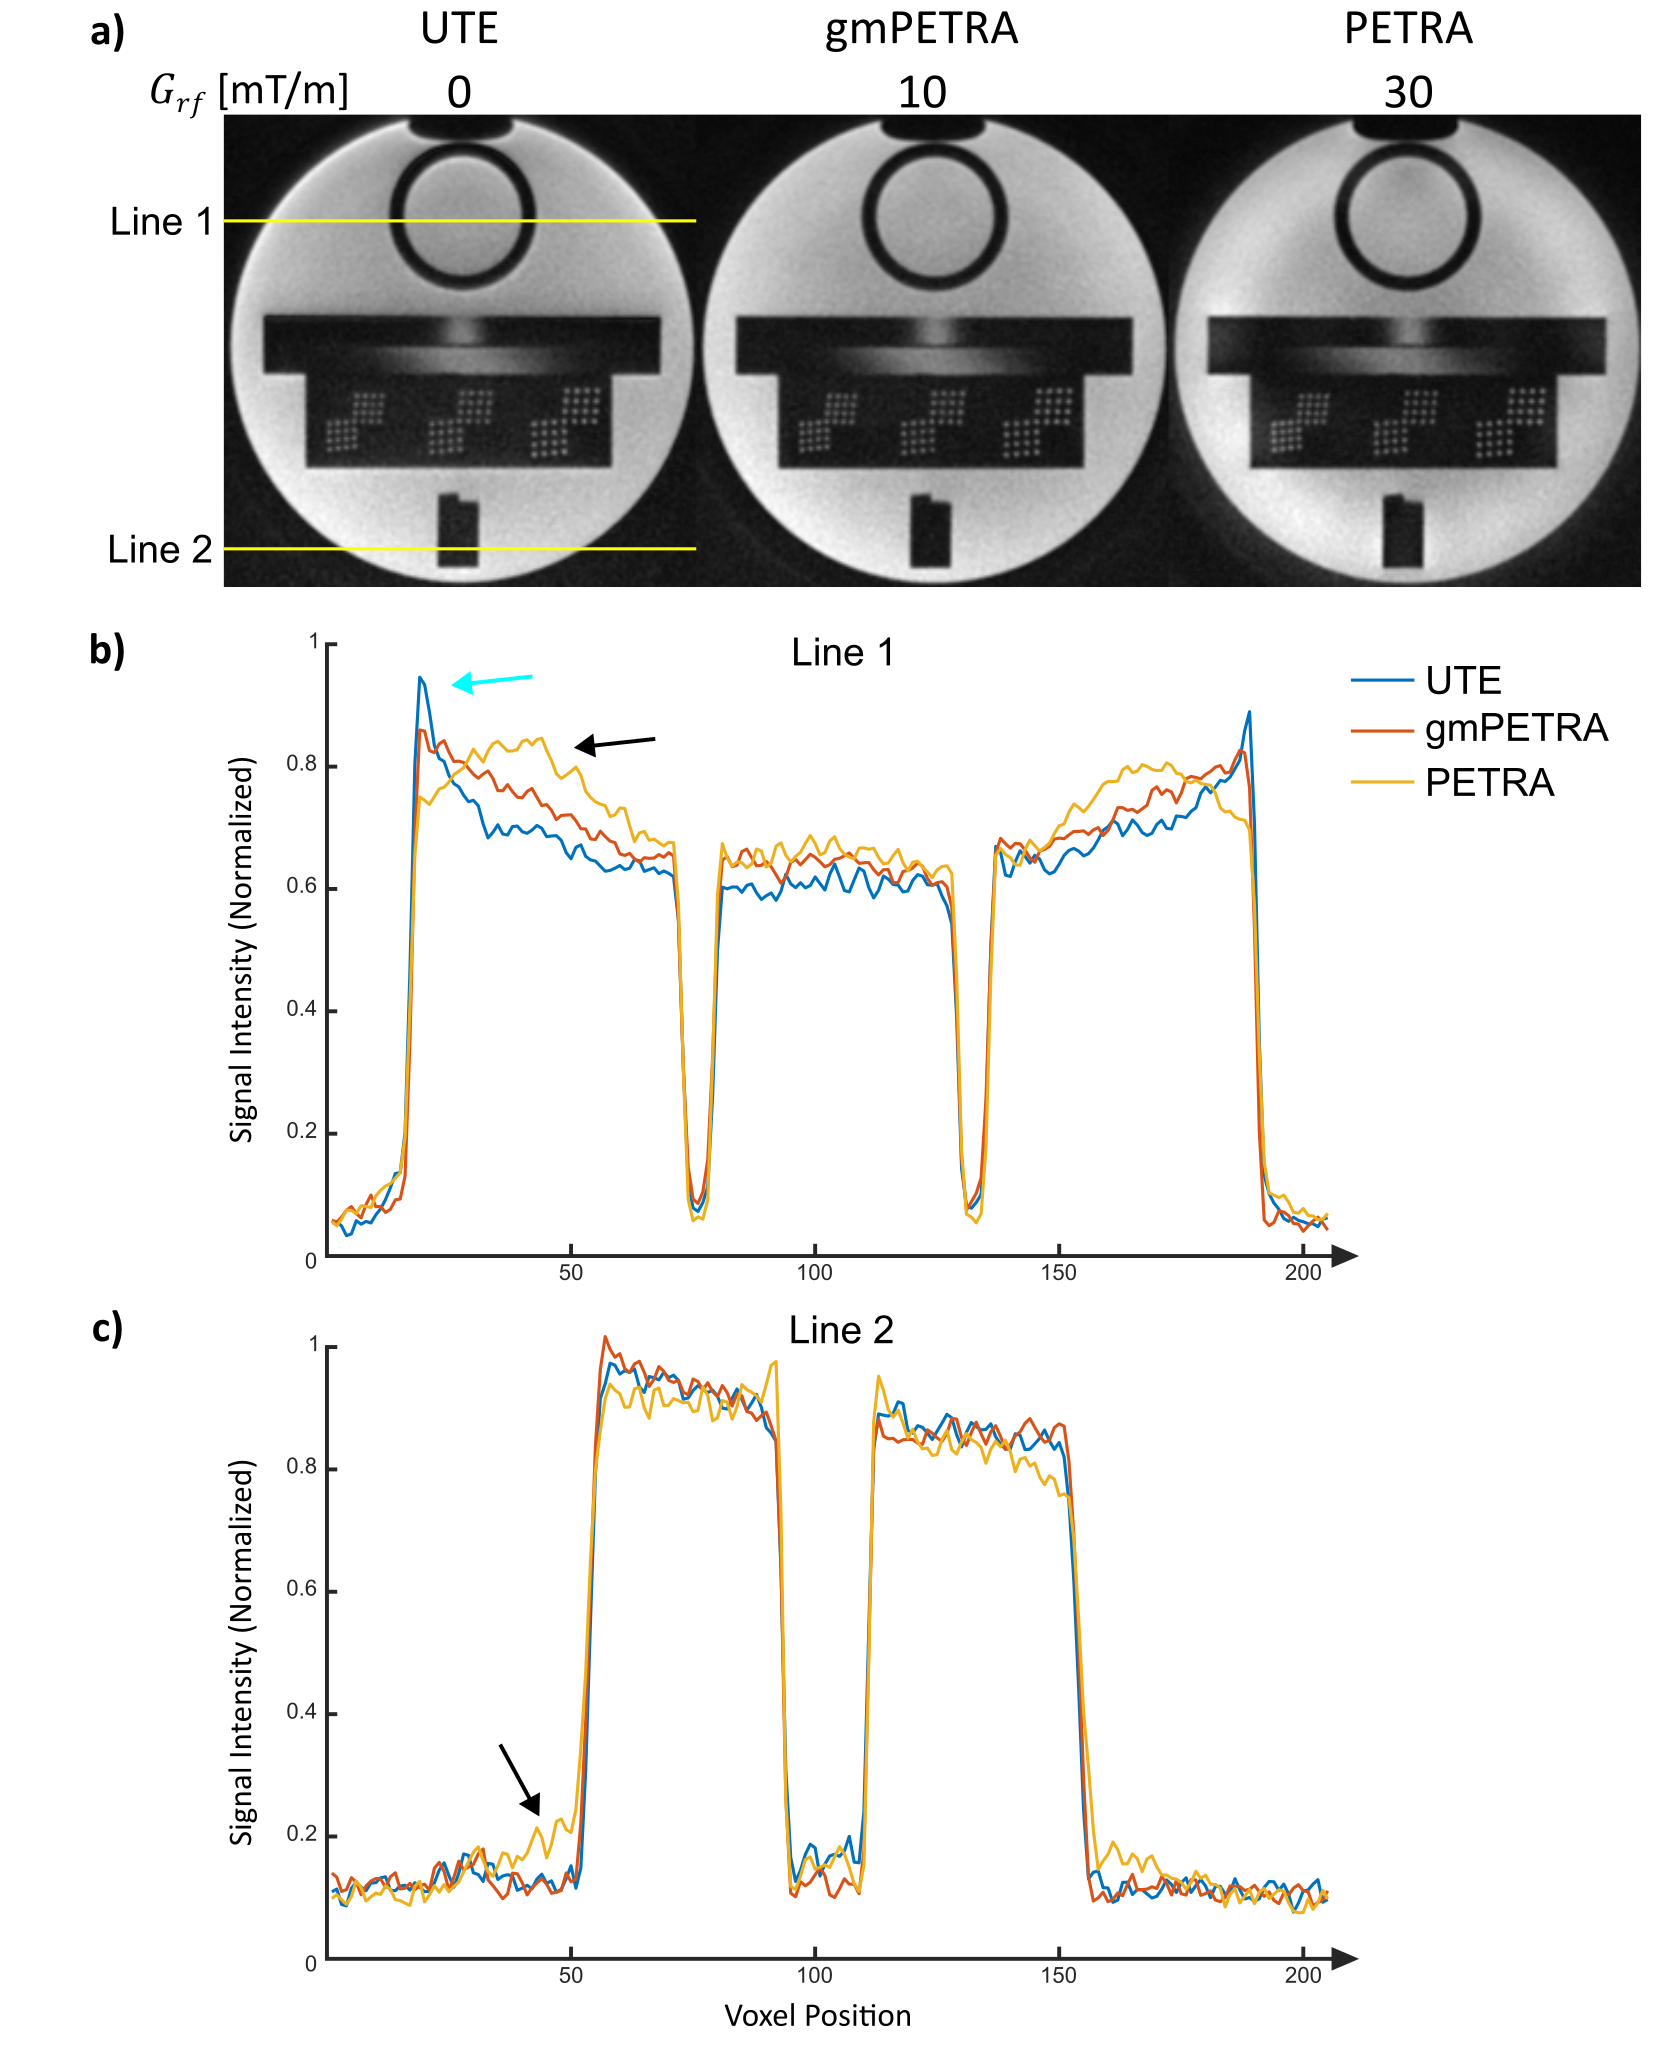
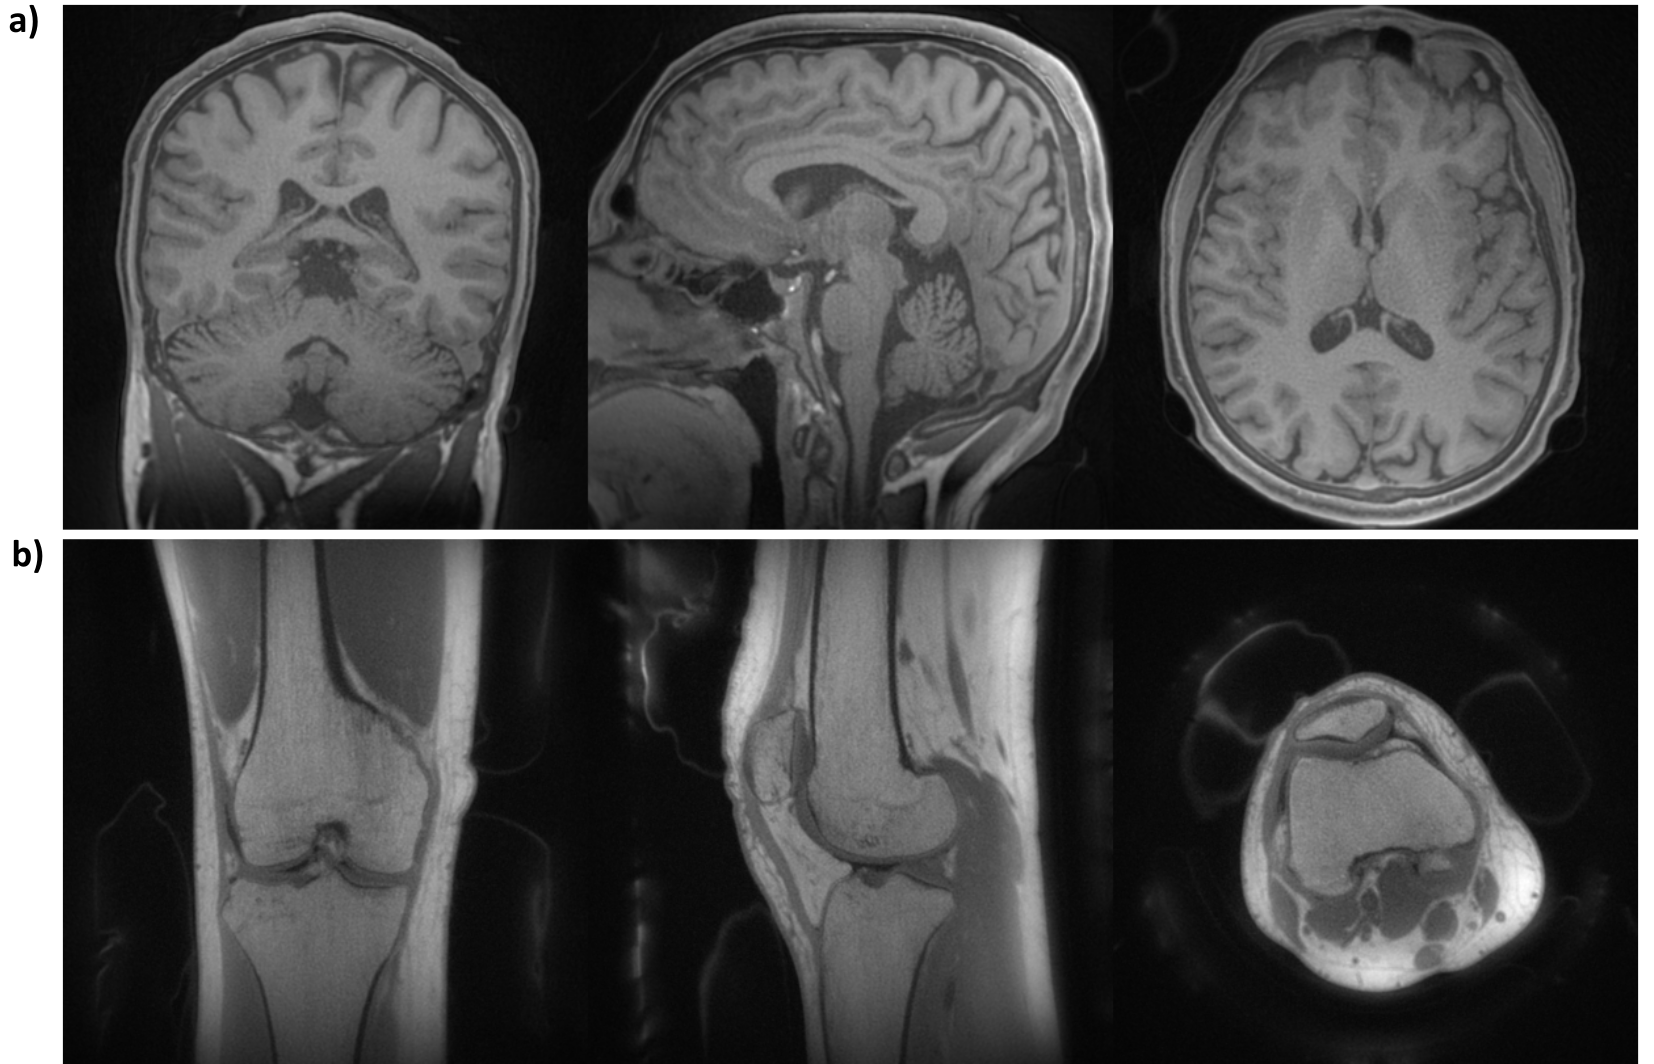
The XTE sequence was implemented on a clinical 3T MRI system (PRISMAfit, Siemens) and tested in a resolution phantom and in 2 healthy volunteers using a Tx/Rx knee coil (QED, USA) and the 20-channel head coil (Siemens AG, Erlangen, Germany). For phantom imaging, acquisition parameters of UTE/gmPETRA/PETRA were: FOV=(180mm)3, (0.5mm)3 isotropic voxel size, FA=5°, TE=50µs, TR=2ms, $$$G$$$=30mT/m, $$$G_{rf}$$$=0/10/30mT/m, $$$T_{enc,1}$$$=890/830/780µs, $$$T_{RF}$$$=20/8/8µs, 100,000 spokes (half-radials). In vivo UTE brain imaging parameters were: FOV=(192mm)3, (0.5mm)3 isotropic voxel size, binomial excitation with FA=4°, TE=20µs, TR=2.8ms, $$$G$$$=40mT/m, 300,000 spokes. In vivo PETRA knee imaging parameters were: FOV=(180mm)3, (0.5mm)3 isotropic voxel size, FA=6°, TE=50µs, TR=2ms, $$$G=G_{rf}=$$$30mT/m, 120,000 spokes.
For the image reconstruction, the radial samples were re-gridded onto a Cartesian grid and then combined with the SPI samples after applying a density compensation filter. Then, k-space data were modulated to shift the image to the off-center position. Finally, a 3D FFT was applied, or an iterative image reconstruction with total variation and $$$\ell_1$$$-norm constraints9 was used for undersampled data (BART toolbox10 for compressed sensing).
Results
In Fig.3 XTE phantom images are presented that were acquired with UTE, gmPETRA, and PETRA. Due to the non-ideal excitation profile, signal distortions and inhomogeneity artefacts were observed in the PETRA data (black arrows). An additional signal increase at the edges of the UTE and gmPETRA images was caused by the sensitivity profile of the receive coils (cyan arrow).In Fig.4, in vivo XTE images of the brain (UTE) and the knee (PETRA) are presented. XTE provided high resolution images of different body parts with different sequences (UTE and PETRA). In the PETRA images inhomogeneity artifacts are again visible at the periphery of the FOV. Due to ultra-short TE, signal from background (e.g., positioning pads, coil elements) was also captured.
Conclusion
In this work, we present an ultra-short TE MRI sequence which is a general implementation of various sequences, namely UTE, ZTE, SPI, PETRA, and gmPETRA. XTE provides high resolution images with different sequences by only changing the sequence type in the sequence user interface.Acknowledgements
.References
(1) Tyler, D. J.; Robson, M. D.; Henkelman, R. M.; Young, I. R.; Bydder, G. M. Magnetic Resonance Imaging with Ultrashort TE (UTE) PULSE Sequences: Technical Considerations. J. Magn. Reson. Imaging 2007, 25 (2), 279–289. https://doi.org/10.1002/jmri.20851.
(2) Hafner, S. Fast Imaging in Liquids and Solids with the Back-Projection Low Angle ShoT (BLAST) Technique. Magn. Reson. Imaging 1994, 12 (7), 1047–1051.
(3) Lauterbur, P. C. Image Formation by Induced Local Interactions: Examples Employing Nuclear Magnetic Resonance. nature 1973, 242 (5394), 190–191.
(4) Grodzki, D. M.; Jakob, P. M.; Heismann, B. Ultrashort Echo Time Imaging Using Pointwise Encoding Time Reduction with Radial Acquisition (PETRA). Magn. Reson. Med. 2012, 67 (2), 510–518. https://doi.org/10.1002/mrm.23017.
(5) Emid, S.; Creyghton, J. High Resolution NMR Imaging in Solids. Phys. B C 1985, 128 (1), 81–83.
(6) Weiger, M.; Pruessmann, K. P. Short-T2 MRI: Principles and Recent Advances. Prog. Nucl. Magn. Reson. Spectrosc. 2019, 114–115, 237–270. https://doi.org/10.1016/j.pnmrs.2019.07.001.
(7) Garwood, M. MRI of Fast-Relaxing Spins. J. Magn. Reson. 2013, 229, 49–54. https://doi.org/10.1016/j.jmr.2013.01.011.
(8) Gatehouse, P. D.; Bydder, G. M. Magnetic Resonance Imaging of Short T2 Components in Tissue. Clin. Radiol. 2003, 58 (1), 1–19. https://doi.org/10.1053/crad.2003.1157.
(9) Ilbey, S.; Jungmann, P. M.; Fischer, J.; Jung, M.; Bock, M.; Özen, A. C. Single Point Imaging with Radial Acquisition and Compressed Sensing. Magn. Reson. Med. 2022, 87 (6), 2685–2596. https://doi.org/10.1002/mrm.29156.
(10) Tamir, J. I.; Ong, F.; Cheng, J. Y.; Uecker, M.; Lustig, M. Generalized Magnetic Resonance Image Reconstruction Using the Berkeley Advanced Reconstruction Toolbox. In ISMRM Workshop on Data Sampling & Image Reconstruction, Sedona, AZ; 2016.
Figures