2017
The effect of imaging parameters, aging, and circadian rhythm on Freesurfer's estimates: A single subject study at 7T over 7 years1Biomedical Magnetic Resonance, Otto von Guericke University, Magdeburg, Germany, 2German Center for Neurodegenerative Disease, Magdeburg, Germany, 3Institute of Cognitive Neurology and Dementia Research, Otto von Guericke University, Magdeburg, Germany, 4Max Planck Institute for Human Cognitive and Brain Sciences, Leipzig, Germany, 5Center for Behavioral Brain Sciences, Magdeburg, Germany, 6Leibniz Institute for Neurobiology, Magdeburg, Germany
Synopsis
Keywords: Data Analysis, Aging
In this explorative study, the effect of imaging parameters, image quality, circadian rhythm, and aging on FreeSurfer’s estimates is investigated. To that end, the human phantom, an openly available data of a single subject scanned at 7T over 7 years with various MR protocols, is used.Introduction
Freesurfer1,2 is one of the most frequently applied tools in neuroimaging to quantify brain morphology such as variability in cortical thickness and regional brain volume due to aging3. Further, imaging parameters such as voxel volume can be a bias in the estimates4. In contrast to most studies which utilize harmonized protocols and large cohorts, here, an openly available dataset of a single subject scanned over approximately 7 years with various MR protocols (i.e. voxel volume: 0.1 mm³-1 mm³) is used. In this preliminary study, a broad, explorative analysis is conducted to investigate the effect of imaging parameters, image quality, circadian rhythm, and aging on FreeSurfer’s estimates.Methods
Form the human phantom5,6, 75 MPRAGE volumes of the single healthy male (29-year-old at study start) meeting the following criteria were selected: 32-channel head coil; maximal GRAPPA factor 2 (47x no GRAPPA, 28x GRAPPA 2, 1x excluded), maximal 7/8 partial Fourier (53x no partial Fourier; 22x 7/8; 6x excluded). Along with the image data, the FreeSurfer (v6 with conf2hires; recon-all script including resampling to 1mm isotropic resolution) and MRIQC7 results are provided readily in the data repository. For all 75 volumes gray to white matter contrast-to-noise ratio (CNR) was > 1.5 and the EFC8 < 0.75. For correlation and modeling the following input variables were selected empirically: voxel volume, partial Fourier, GRAPPA factor, CNR, year (starting from 0 at the first scan), and time of day. Significance of Pearson’s correlations were Bonferroni corrected. Linear models were used to understand how the combination of input variables explained the variance in FreeSurfer’s global and regional estimates. As a baseline, only the voxel volume is considered. Successively, more variables are added to the model: partial Fourier, GRAPPA factor, CNR, year, and time of day. Hence a total of six models are compared using adjusted R² values (corrects R² for number of variables used). The variable order was motivated by first considering imaging parameters, then the image quality, and lastly, aging and the circadian rhythm. This comparison provides a glimpse into the relevance of each variable in explaining the variance in the data while keeping the number of models investigated reasonably small.Results
Voxel volume is distributed bimodally (see Fig.1). CNR increases with voxel volume, with a significant correlation. While data was acquired over approximately 7 years and between 8:00 to 22:00, the majority was acquired mid-day and in year 5 and 6. One-by-one Pearson correlation (Bonferroni corrected; see Fig.2) yields significant correlation for estimated total intracranial volume (eTIV) with voxel volume and CNR; brain volume with partial Fourier; total and cortical gray matter (GM) volume with years, respectively. No significant correlation with aging was found for subcortical GM volume. White matter (WM) volume correlates significantly with all imaging parameters and CNR. Surprisingly, ventricle volume decreased with aging, but the data was not normalized for changes in eTIV or global brain volume. To understand how the model variables jointly explain the variance in Freesurfer estimates, the adjusted R² is reported (see Fig.3 for global and Fig.4 for regional estimates, respectively). Further, average increase in adjusted R² across ROIs for all models are shown in Tab.1. The absolute and increase in adjusted R² was region-specific and different for volume, area, and thickness estimates. Further, comparing ROIs across hemispheres showed stark differences. Modeling variables reflecting the effective resolution, i.e. voxel volume and partial Fourier, explains largely variances in eTVI, WM volume, and on average for regional volume and thickness, but not surface estimates. Including the GRAPPA factor did not increase R² considerably. On average, adding CNR showed only for ROI volume a noteworthy increase. Aging, modeled by years, had a considerable contribution for all estimates on average, particularly cortical volumes. On average, time of day, modeling the circadian rhythm, increased considerably R² for all regional metrics but the average thickness.Discussion
Using data acquired at 7T over 7 years, an explorative assessment of imaging parameters, quality, aging, and circadian rhythm on Freesurfer estimates for a single subject was conducted. Modeling the effective resolution, i.e. voxel volume and partial Fourier, had a considerable contribution to the data variance potentially due to image blurring. Time-related variables, i.e. modeling aging and circadian rhythm, had considerable, but ROI-specific effects. In the future, this initial, explorative analysis needs to be refined. First, further FreeSurfer options, i.e. longitudinal assessment, have to be considered. Secondly, more advanced models need to be employed. The here used linear assumption is suboptimal for i.e. the periodic circadian rhythm. Further, the increase in R² when adding a variable to the modeling is no direct measure of the contribution of the respective variable in isolation, but the overall model performance. Third, acquiring new data to better capture the circadian rhythm in within a day instead of pooling it from approximately 7 years would be ideal. Finally, adding further variables (i.e. hydration level) could improve the overall low to moderate R² values.Acknowledgements
This work was funded by the DFG-MA 9235/1-1 and MA 9235/3-1References
1. https://surfer.nmr.mgh.harvard.edu/
2. Fischl, Bruce, and Anders M. Dale. "Measuring the thickness of the human cerebral cortex from magnetic resonance images." Proceedings of the National Academy of Sciences 97.20 (2000): 11050-11055.
3. Salat, David H., et al. "Thinning of the cerebral cortex in aging." Cerebral cortex 14.7 (2004): 721-730.
4. Lüsebrink, Falk, Astrid Wollrab, and Oliver Speck. "Cortical thickness determination of the human brain using high resolution 3 T and 7 T MRI data." Neuroimage 70 (2013): 122-131.
5. Lüsebrink, Falk, et al. "Comprehensive ultrahigh resolution whole brain in vivo MRI dataset as a human phantom." Scientific Data 8.1 (2021): 1-13.
6. Lüsebrink, Falk, et al. "Data from: Comprehensive ultrahigh resolution whole brain in vivo MRI dataset as a human phantom." https://doi. org/10.1038/s41597-021-00923-w  (2020).
7. Esteban, Oscar, et al. "MRIQC: Advancing the automatic prediction of image quality in MRI from unseen sites." PloS one 12.9 (2017): e0184661.
8. Atkinson, David, et al. "Automatic correction of motion artifacts in magnetic resonance images using an entropy focus criterion." IEEE Transactions on Medical imaging 16.6 (1997): 903-910.
Figures
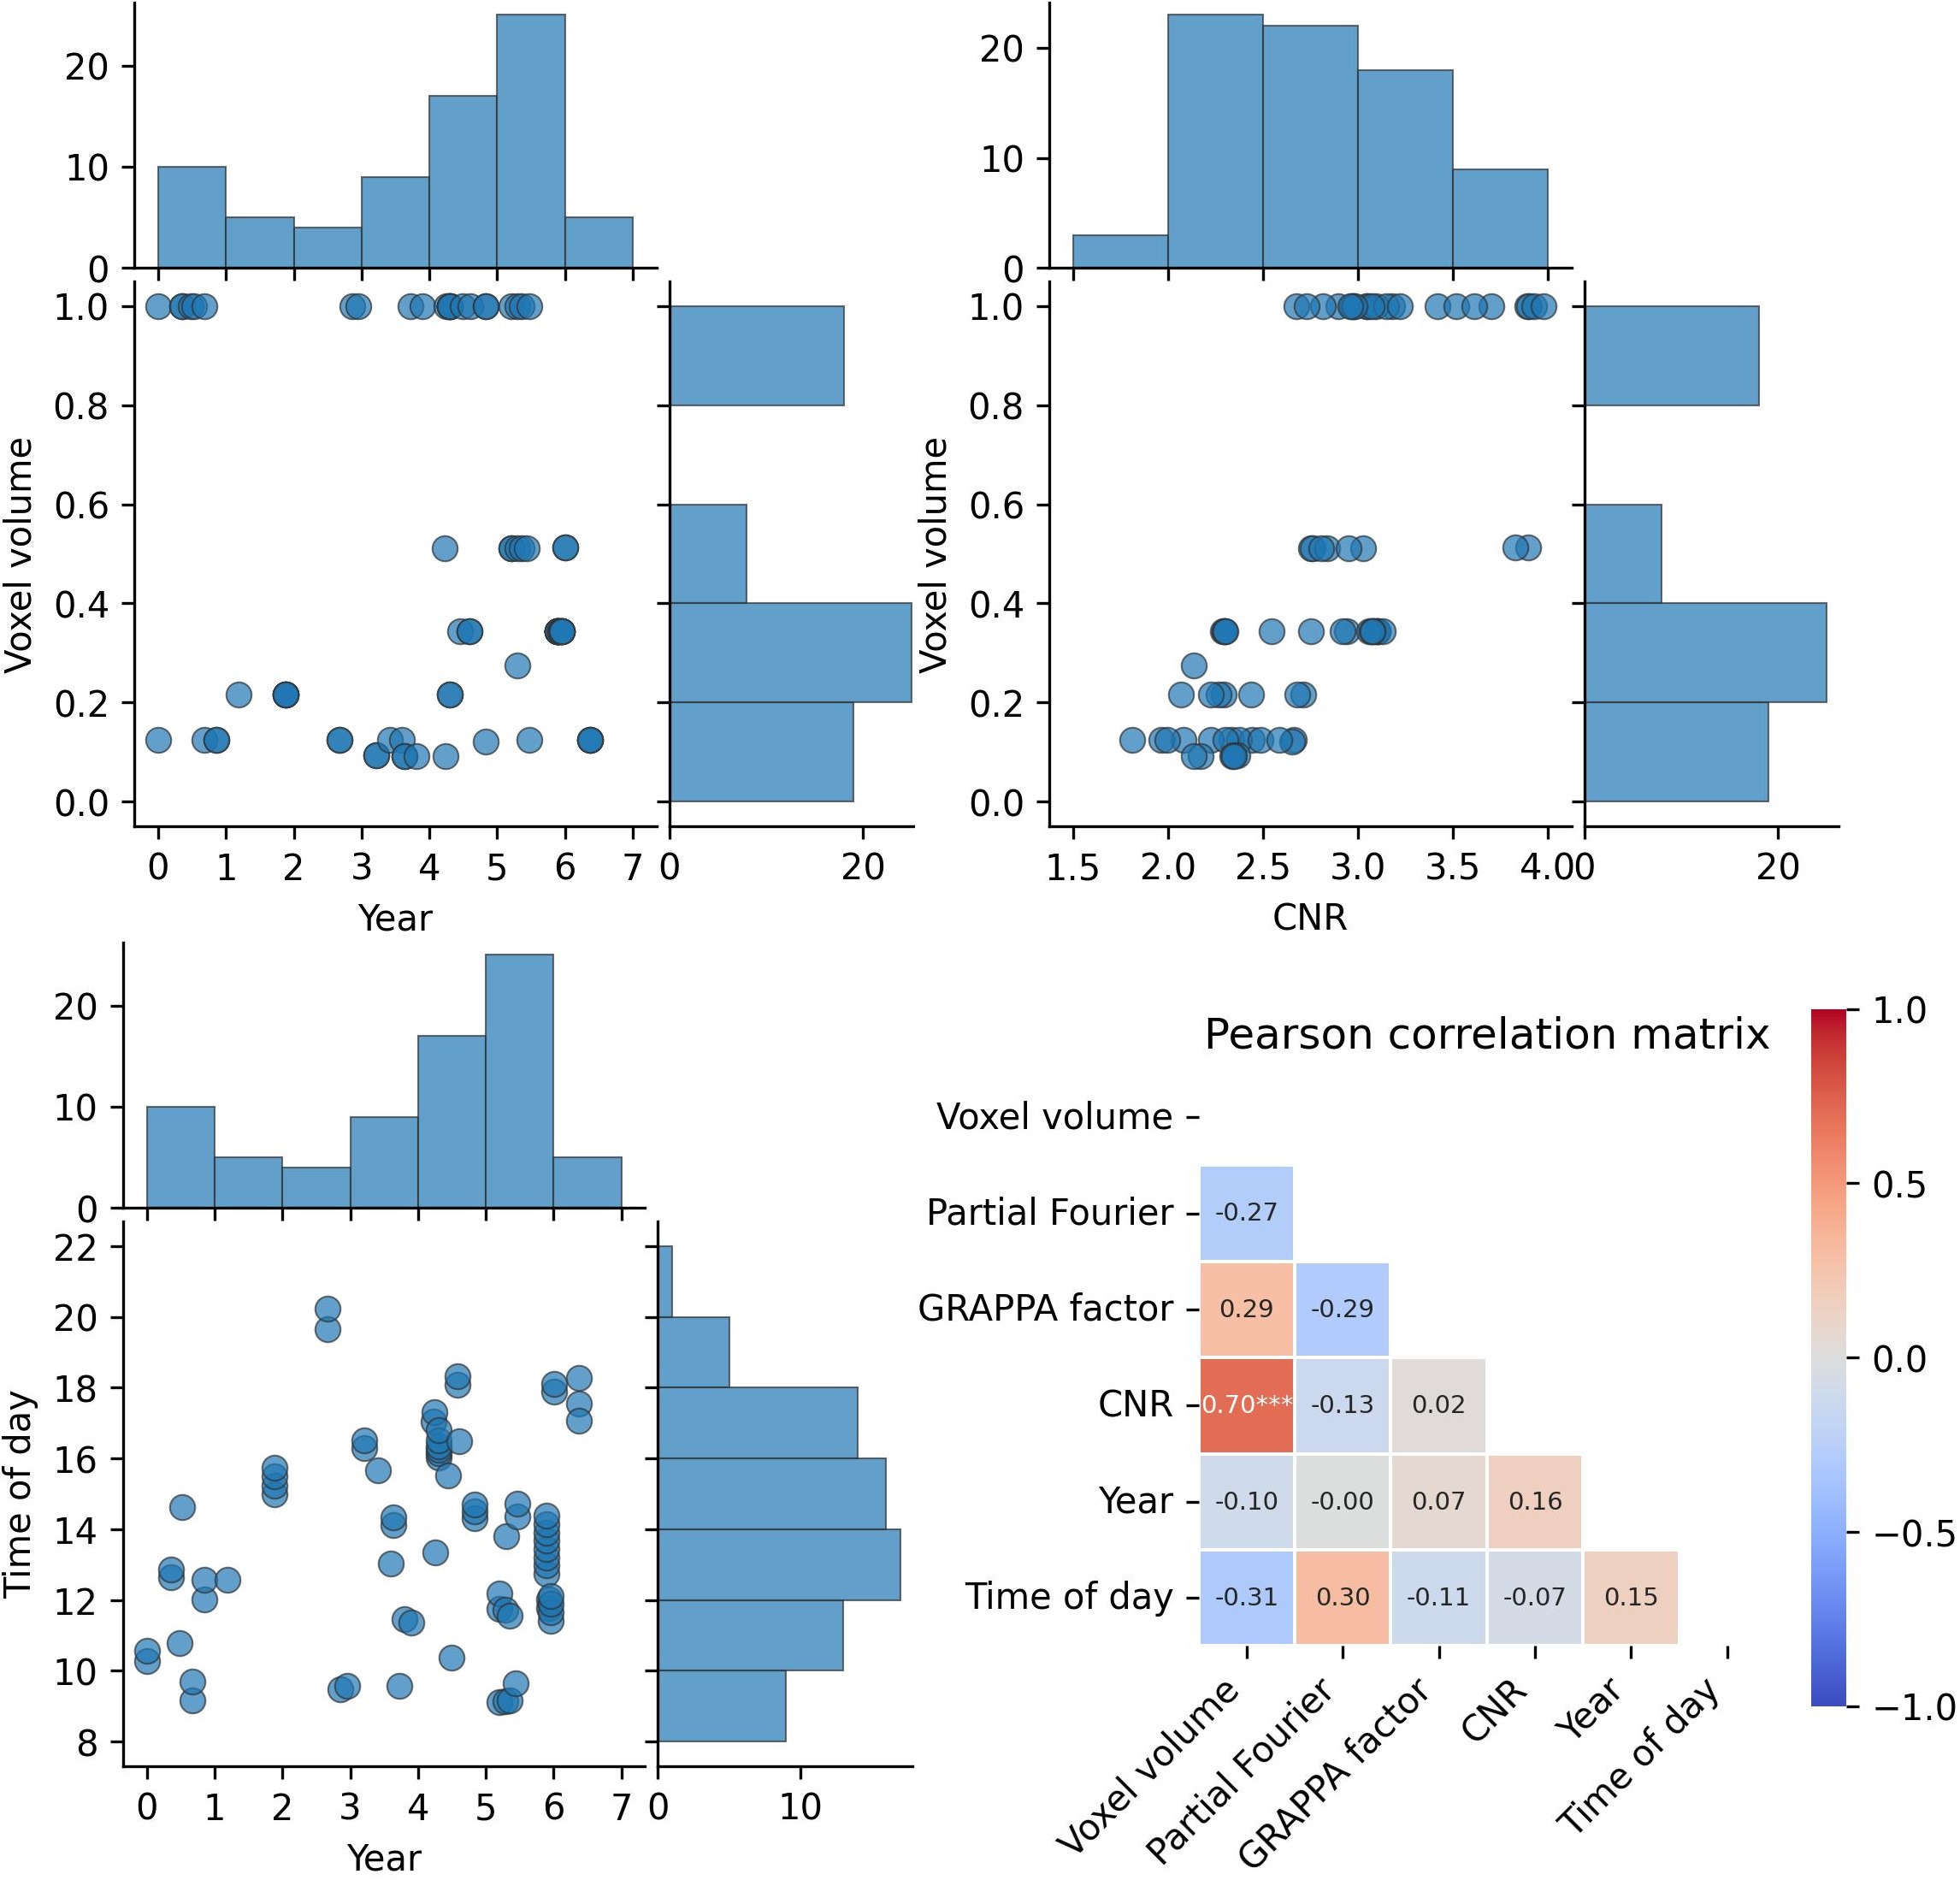
Figure 1: Distribution and correlation of the 75 data sets of a single subject used. Partial Fourier and GRAPPA distributions are reported in the text (both binary). Only CNR and voxel volume correlate significantly. Significance levels after Bonferroni correction: p<0.1 *, p<0.01 ** p<0.001 ***
CNR– gray to white matter contrast-to-noise ratio
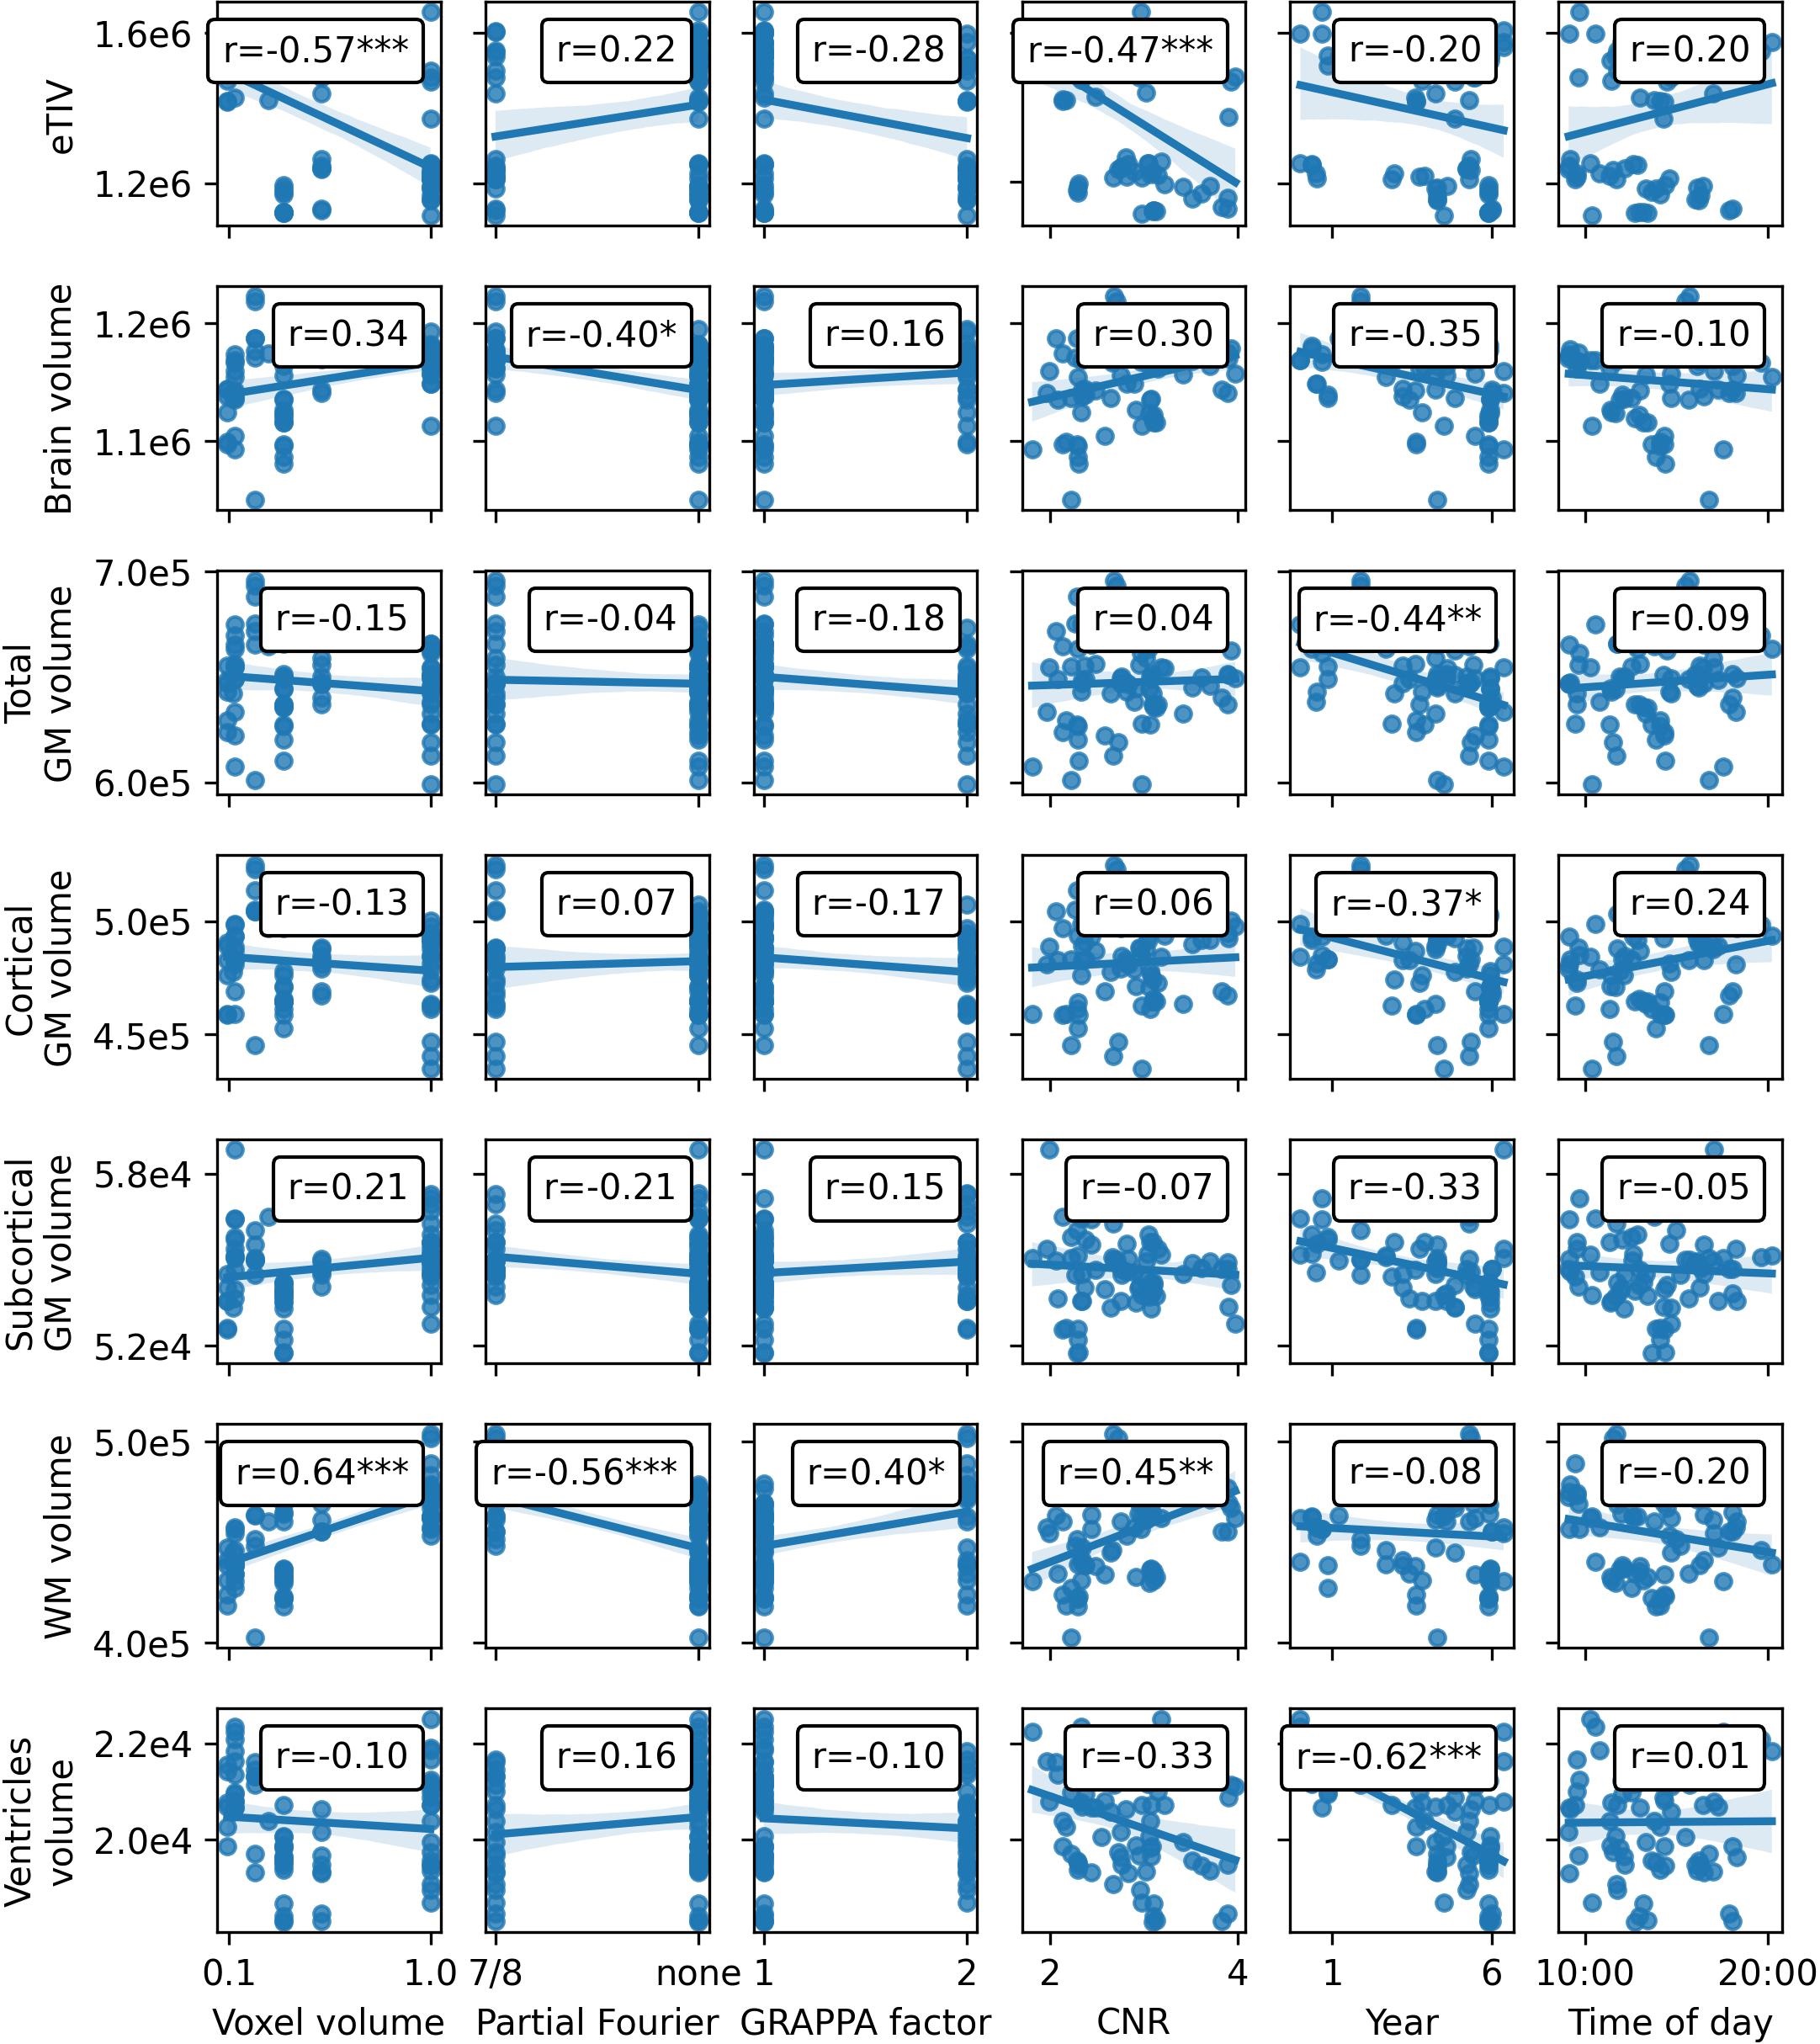
Figure 2: Pearson correlation of imaging parameters, CNR, and time variables with global estimates from FreeSurfer. Significance levels after Bonferroni correction: p<0.1 *, p<0.01 ** p<0.001 ***
CNR – gray to white matter contrast-to-noise ratio; eTIV – estimated total intracranial volume; GM – gray matter; WM – white matter
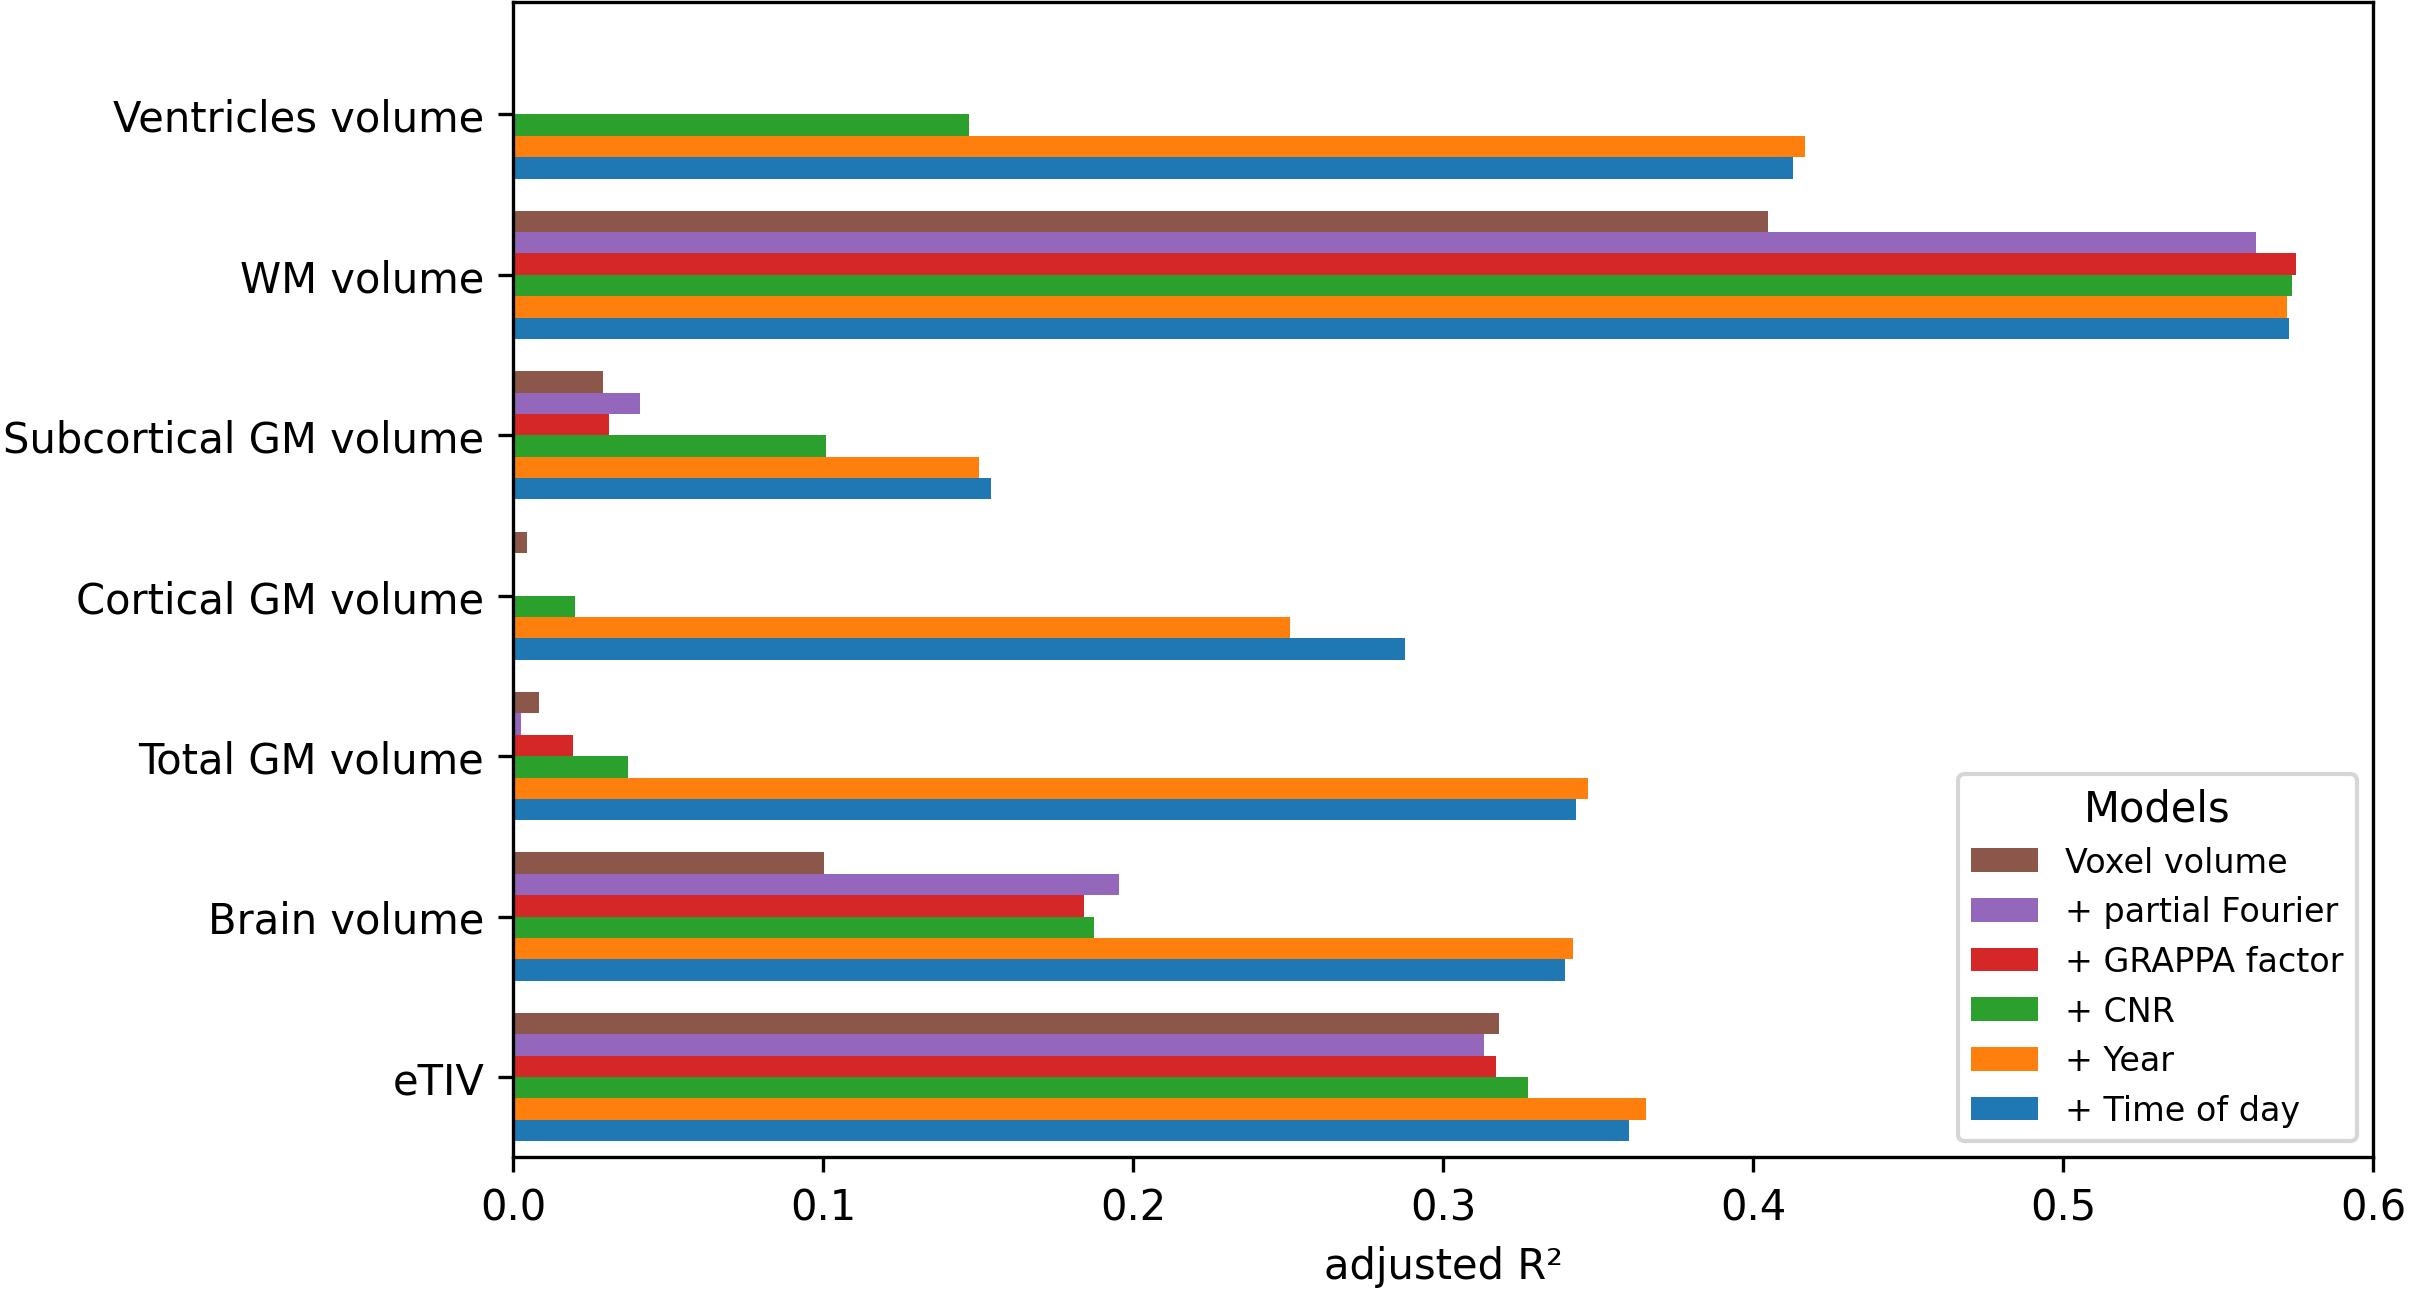
Figure 3: Comparison of the explained variance (adjusted R²) in the global FreeSurfer metrics when adding successively more variables to the linear model.
eTIV – estimated total intracranial volume; GM – gray matter; WM – white matter
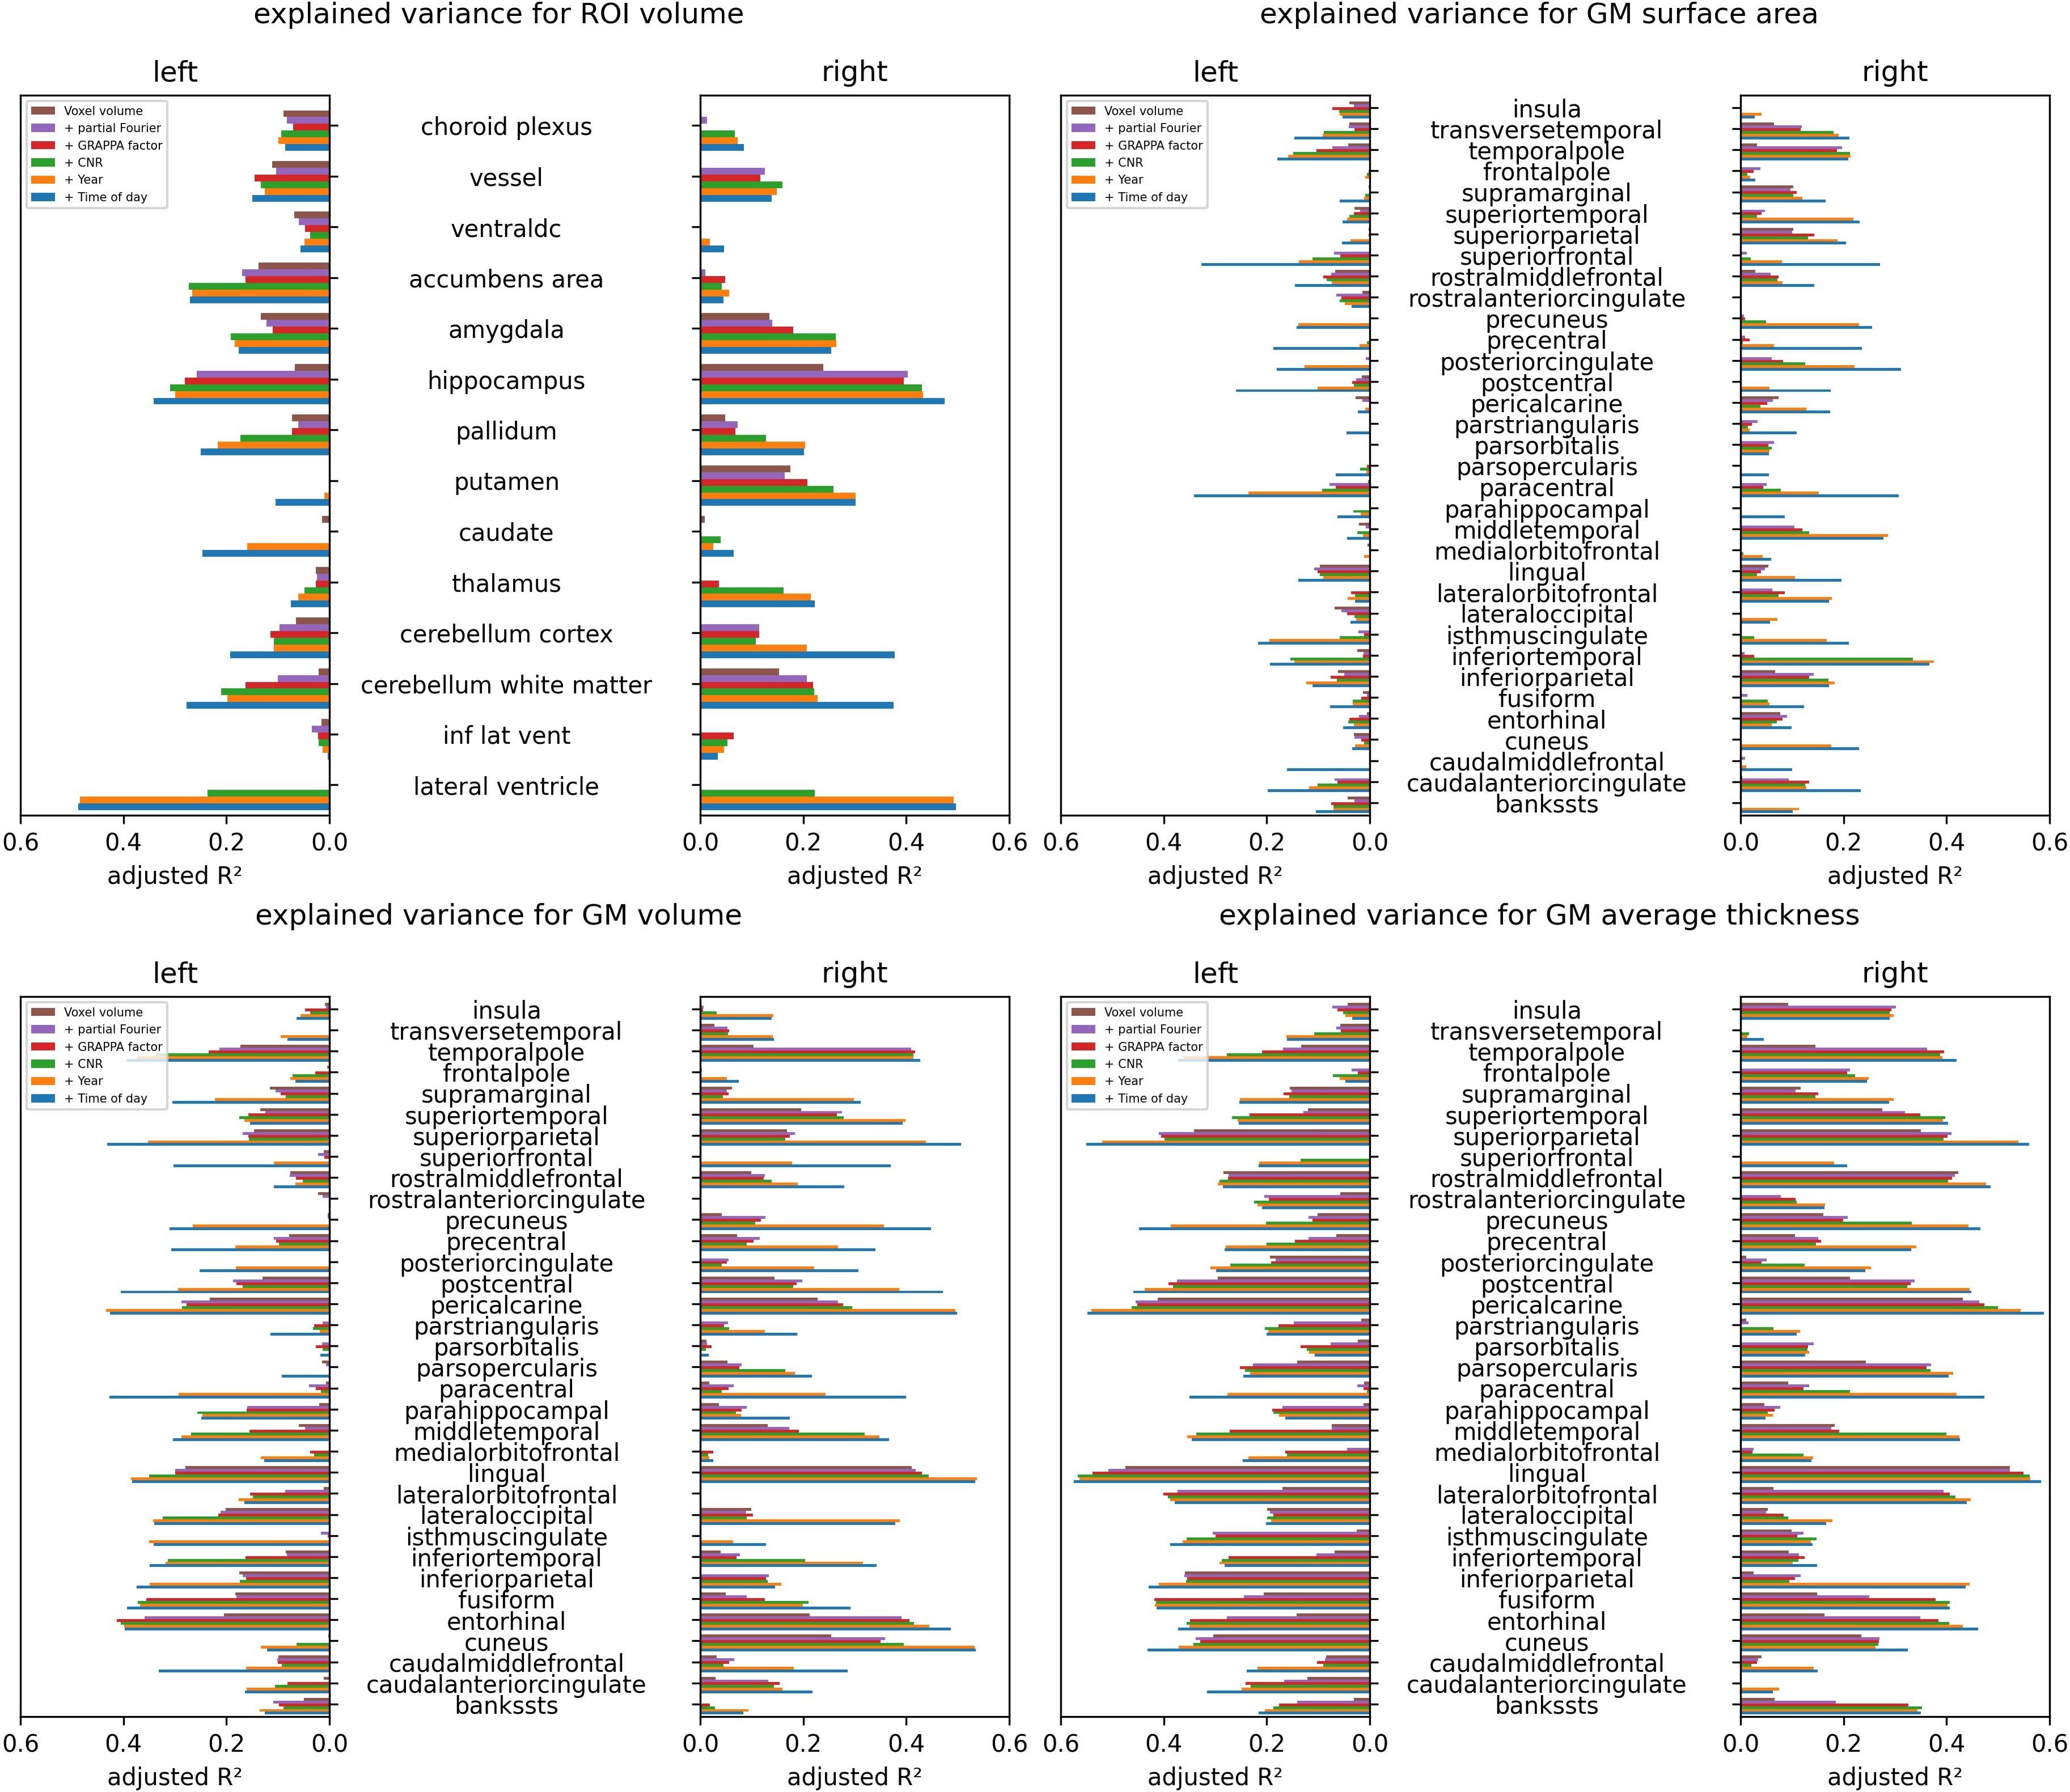
Figure 4: Region-specific comparison of the explained variance (adjusted R²) in different FreeSurfer metrics when adding successively more variables to the linear model.
CNR – gray to white matter contrast-to-noise ratio;

Table 1: Average increase and standard deviation in adjusted R² per variable added;
CNR – gray to white matter contrast-to-noise ratio;