2014
Pilot Tone respiratory signal processing with RF interference suppression and validation against image navigator1Siemens Shenzhen Magnetic Resonance Ltd., Shenzhen, China, 2Siemens Healthcare GmbH, Erlangen, Germany
Synopsis
Keywords: Data Processing, Data Processing, physiology signal
Pilot Tone (PT) has been demonstrated to extract respiratory signal successfully. However, RF interferences are not considered. We propose a method to create a high-quality PT respiratory signal, while suppressing RF interference. At beginning of a measurement, initial RF suppression matrix and respiratory combination vector are learned. Then a PT respiratory signal can be generated to trigger measurement. Afterwards, RF suppression matrix is updated during each RF train. We validate our method in a moving phantom and in 39 volunteers against image navigator. Results show that our method can suppress RF interference effectively- highly correlated with image navigator.Introduction
Pilot Tone (PT) is a novel and promising method to detect motion. Initially, PT respiratory signal had been demonstrated to have good correlation with image-based ground truth1. Recently, several methods2-7 have been proposed to extract PT respiratory signal from multi-channel PT data using either independent motion data as ground truth or statistical methods like blind source separation and the resulting signals were compared with respiratory cushion or bellows data3 and with k-space center self-navigators3,6. However, RF interferences were not considered. A separate RF calibration scan can be used to effectively suppress RF interference for PT based cardiac triggering where the receive coil selection can be fixed for the whole exam8. In the respiratory workflow, multiple coil selections are required, thus a separate RF calibration scan is not practical. Therefore, we propose a method to create a high-quality PT respiratory signal while suppressing RF interference.Methods
At the beginning of a measurement, we collect a 12s of data as the learning phase, then the resulting raw PT signal is L. If there are RF pulses during this phase, RF interference suppression matrix Vrf is learned as described below; otherwise, Vrf is initialized as unit matrix. Respiratory combination vector vresp is learned as described below from RF interference suppressed data L’ which is calculated as:$$L'=L* V_{rf}\tag{1}$$
Then the real-valued respiratory signal p(t) is calculated as
$$p(t) = real(d(t) * V_{rf}*v_{resp})\tag{2}$$
d(t) is the multi-channel PT data vector at time t. After the learning phase, the PT respiratory signal can be calculated by (2), which is used to trigger measurement. During the triggering phase, Vrf is updated during each RF train.
RF suppression matrix
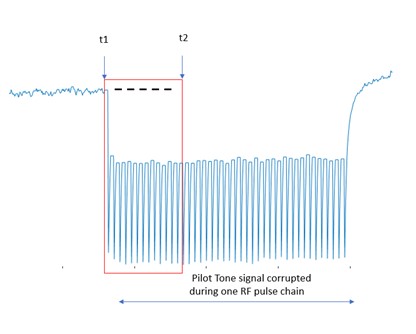
Figure 1 shows an exemplary channel of PT data, corrupted by one RF pulse train. The time point t1 is the time just before the first RF pulse in the RF train is applied. The time point t2 is the time shortly after the first RF pulse. Due to the short duration, changes in the respiratory signal between t1 and t2 are negligible. Thus, the effect of RF pulse on the PT data is represented by the change of the signal from t1: p(t1:t2)-p(t1) and used as calibration data R. If there are several training RF pulse trains, we average the calibration data to suppress other signal contributions, e.g., from respiration or cardiac motion to form a more accurate calibration data matrix R. Then Vrf is calculated from the eigenvectors of RH * R. Provided eigenvalues are in ascending order, NT is the channels or lines of R, take the first NT-b columns as Vrf. b normally is 1 or 2, which means to remove the largest 1 or 2 components of RF interference.
Respiratory combination vector
vresp is constructed by
$$ v_{resp} = v * r * s\tag{3}$$
Learning data L’ is bandpass filtered into respiratory feature data for maximum respiratory (0.2Hz to 0.6Hz), v is last eigenvector of the respiratory feature data. To generate a real-valued respiratory signal, the combined complex-valued signal needs to be rotated in the complex plane by rotation factor r to bring the max variance direction to the real axis. Finally, the respiratory signal sign s with values (+1/-1) is multiplied, to ensure that respiratory phases (inspiration/expiration) always correspond to the same PT respiratory signal extremum; it is determined by respiratory curve shape based SVM method9.
Validation
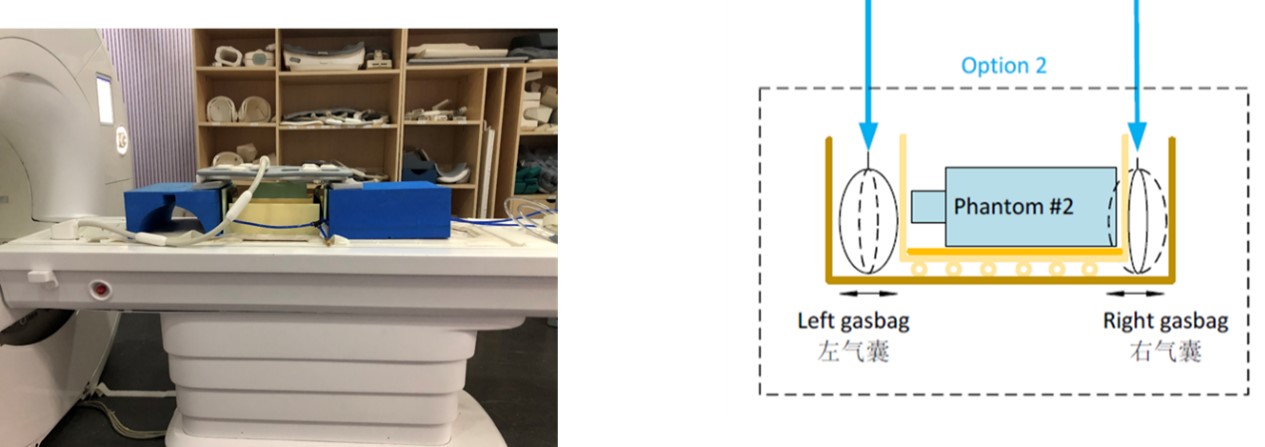
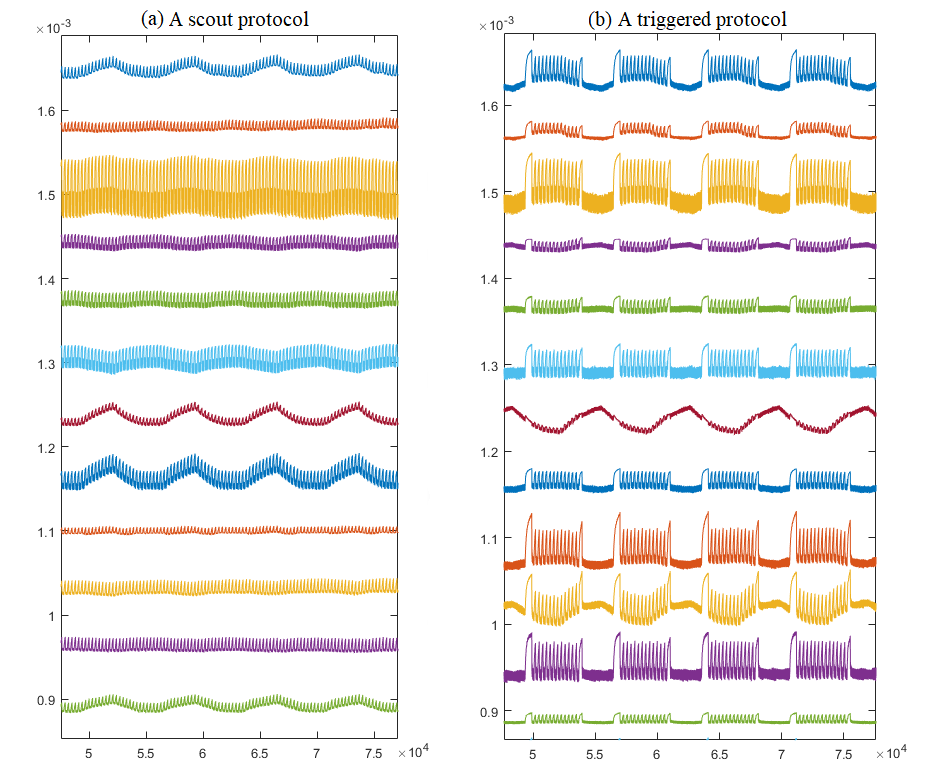
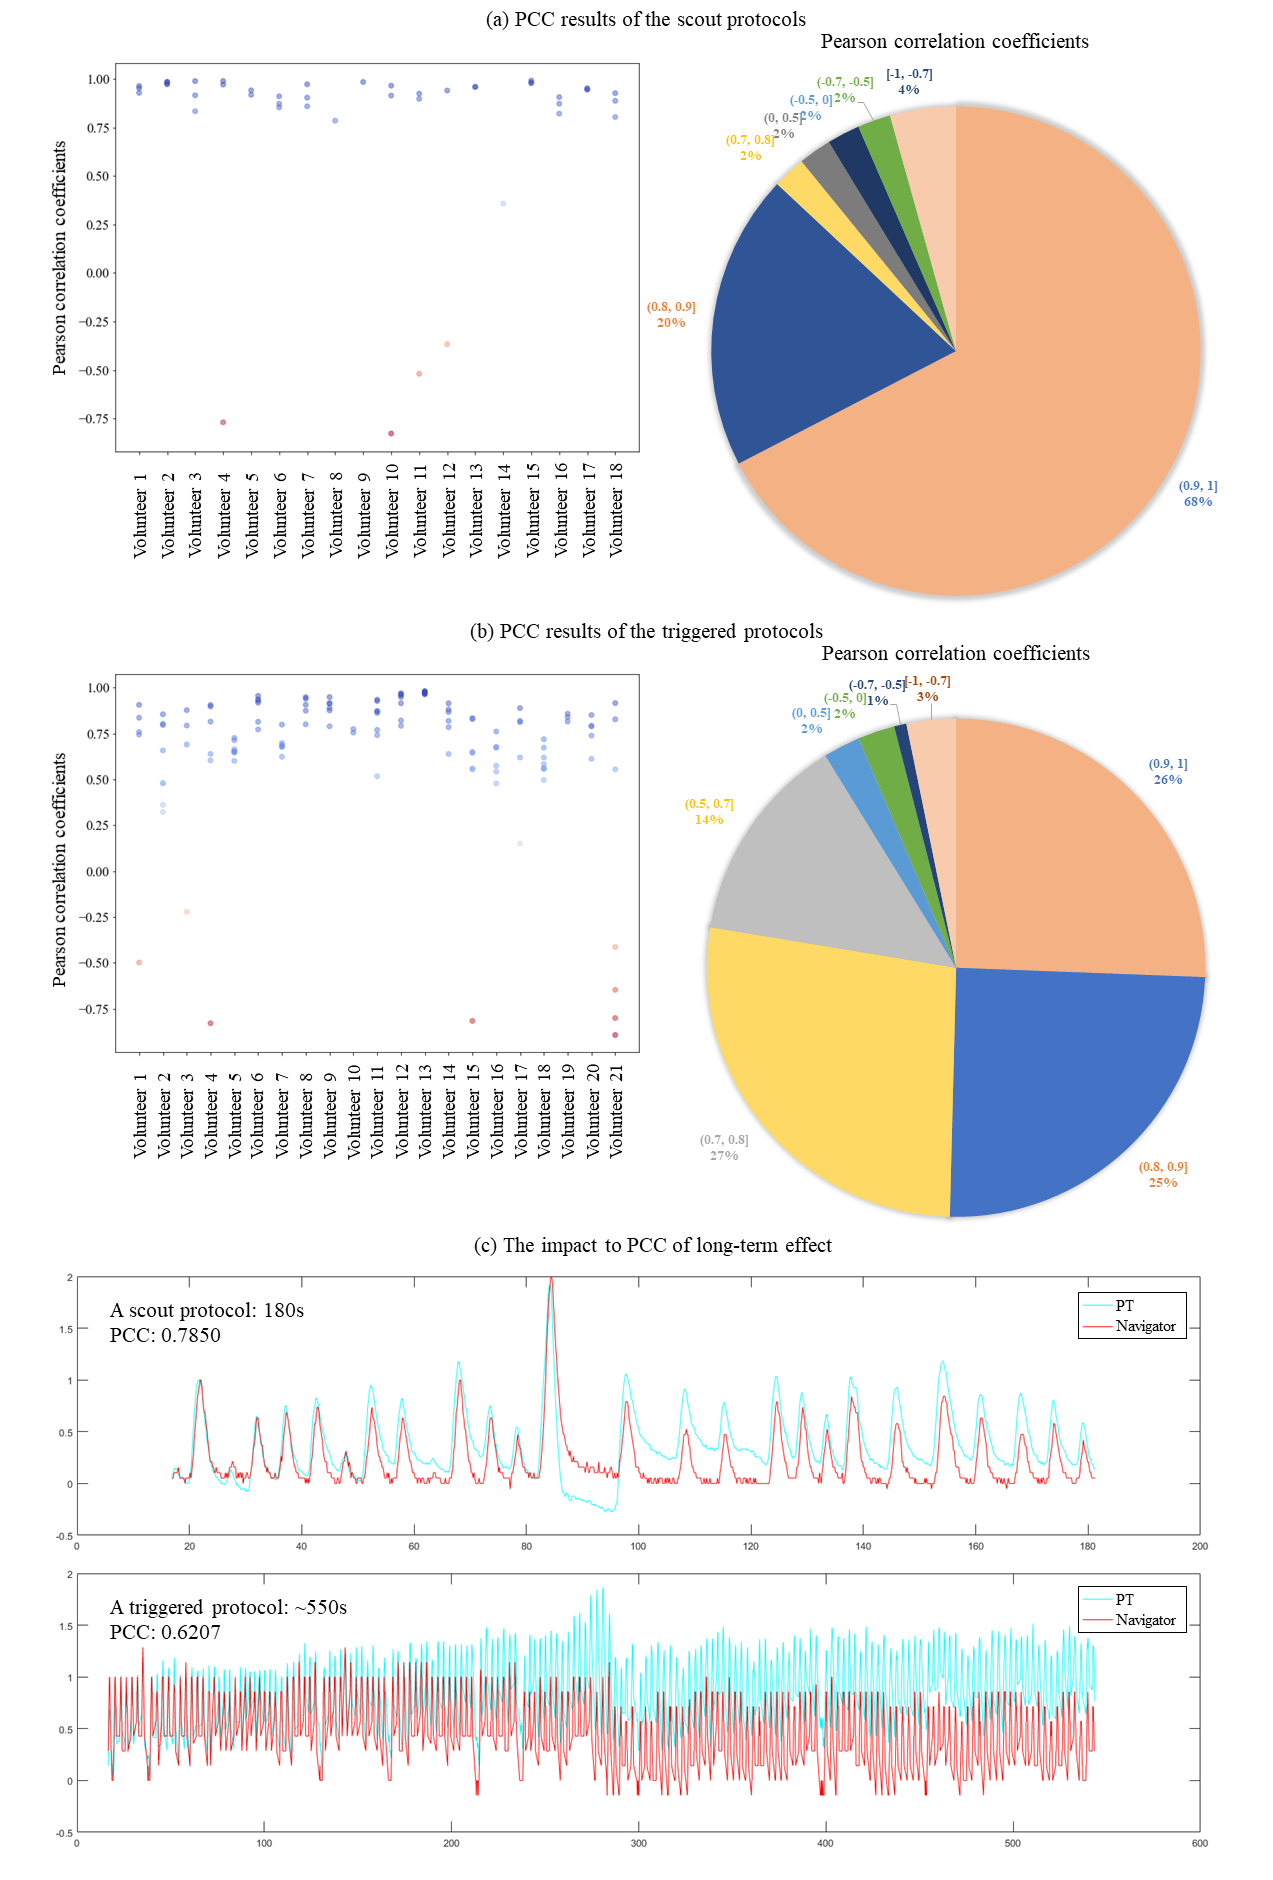
We validated our method in a moving phantom and volunteers on the 0.55T MR scanner (MAGNETOM Free.Star/Free.Max, Siemens Healthineers): We compared respiratory signals of PT with image navigator only(scout) and image navigator triggered measurements. Image navigator was placed at the top edge of moving phantom and liver dome of volunteers. A moving phantom (Figure 2) experiment was first conducted to validate the proposed method. We calculated the Pearson correlation coefficients (PCC) between the respiratory signal from PT and the scout protocol (Figure 3(a)) and the triggered protocol (Figure 3(b)), 11 different protocols in total. To further validate our method, 2 volunteer tests were conducted. One test performed on 18 volunteers measured with scout protocol. The other conducted on 21 volunteers including measurements of 10 typical clinical respiratory triggered protocols.
Results and Discussion
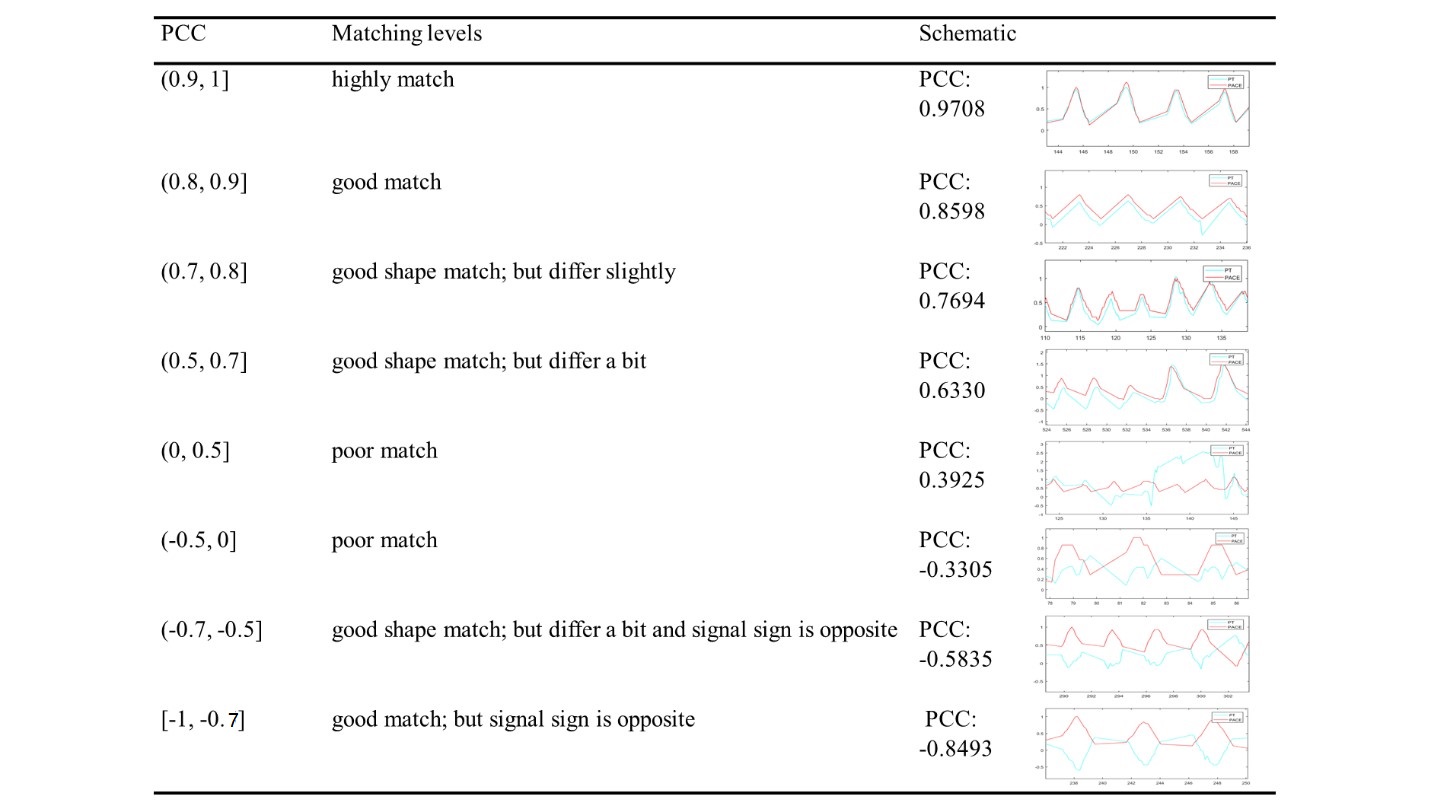
The result of moving phantom, PCC of 97.32% ± 2.6%, demonstrates that the PT respiratory signal highly matches in moving phantom, both scout and triggered measurements.Figure 5(c) indicates PCC of triggered protocols are lower than scout protocols. We can still see the triggered protocol which has PCC of ~0.62 matches well. Thus, we take |PCC| >= 0.7 for scout protocols and |PCC| > = 0.5 for triggered protocols as good match. Absolute values are taken for separating respiratory sign from this evaluation. Different PCC values represent different matching levels which are illustrated in Figure 4. For scout protocols, Figure 5(a) shows 96% of PT signals matched navigator signals well. For triggered protocols, Figure 5(b) 96% of PT signals match navigator signals well.
Conclusion
Our experimental results suggest that the respiratory PT signal, calculated with the described algorithm, has a high correlation with the image navigator signal in the presence of different types of RF interference. This proves that the proposed method suppress RF interference effectively.Acknowledgements
No acknowledgement found.References
1. Speier P, Fenchel M, Rehner R: Pt-nav: a novel respiratory navigation method for continuous acquisitions based on modulation of a pilot tone in the MR-receiver. Magn Reson Mater Phys Biol Med 28, 97-98 (2015)
2. Vahle T, Bacher M, Rigie D, et al. Respiratory Motion Detection and Correction for MR Using the Pilot Tone: Applications for MR and Simultaneous PET/MR Examinations. Invest Radiol. 2020;55(3):153-159. doi:10.1097/RLI.0000000000000619
3. Solomon E, Rigie DS, Vahle T, et al. Free-breathing radial imaging using a pilot-tone radiofrequency transmitter for detection of respiratory motion. Magn Reson Med. 2021;85(5):2672-2685. doi:10.1002/mrm.28616
4. Ludwig J, Speier P, Seifert F, Schaeffter T, Kolbitsch C. Pilot tone–based motion correction for prospective respiratory compensated cardiac cine MRI. Magn Reson Med. 2021;85(5):2403-2416. doi:10.1002/mrm.28580
5. Chen C, Liu Y, Simonetti OP, et al. Cardiac and respiratory motion extraction for MRI using Pilot Tone-a patient study. Published online 2022. http://arxiv.org/abs/2202.00055
6. Falcão MBL, Di Sopra L, Ma L, et al. Pilot tone navigation for respiratory and cardiac motion-resolved free-running 5D flow MRI. Magn Reson Med. 2022;87(2):718-732. doi:10.1002/mrm.29023
7. Hatef J, Vijaykumar A, Chen C, Liu Y, Ahmad R. Channel Pruning to Improve Robustness of Pilot Tone-based Cardiac Trigger Detection. ISMRM 31st Annu Meet Exhib. 2022;86(1):2021-2022.
8. Speier P, Huang YT, Hayes C, et al. Enabling Pilot Tone cardiac triggering for complete cardiac examinations using an RF calibration procedure. In: Proc. Intl. Soc. Mag. Reson. Med. 30(2022).
9. He, Jin Qiang, Shu Qun Xie, and Fang Dong. "Method and apparatus for determining respiration phase, magnetic resonance imaging method and system." U.S. Patent Application 16/998,340, filed February 25, 2021.
Figures