2000
The noise suppression of resting fMRI data based on eigenvector correction1Dalian University of Technology, Dalian, China, 2University of Jyvaskyla, Jyvaskyla, Finland
Synopsis
Keywords: Motion Correction, Artifacts
The fMRI signal has been very noisy for artifacts induced various reasons, and yet the head motion and non-neuronal contributions are always the most tickle one. And too severe of motion corruption usually will lead to abandonment of the participant’s data. In this study, proposed method manages to effectively control these noises meanwhile without losing valuable signals. Proposed method exceeds standard pipeline in both quantitative and qualitative metrics.Introduction
Denoise has been an unavoidable procedure in almost all kinds of fMRI preprocessing pipelines because head motion and fluctuations in non-neuronal physiological processes is the major cause in contaminating the blood-oxygenation-level-dependent(BOLD) signal, particularly under unconstrained resting-state conditions. The erroneous intensity changes of BOLD change can be related to subtle movements of the head and cannot be easily suppressed by realignment or commonly used linear regression model. Studies[1,2]. has shown that various strategies may performs differently but the complete control of motion-related artefact is difficult to achieve, especially for large motion participants. In this study, we proposed a simple but effective method to restrain the noise of the raw data in spatio-temporal domain. After compared with the standard pipeline, the results outperform in several quantitative and qualitative metrics related to data quality assessment and functional network analysis. The proposed method has shown a better ability in not only suppressing the motion-related artifact or other non-neuronal physiological noises, but also producing reliable functional metrics.Methods and Materials
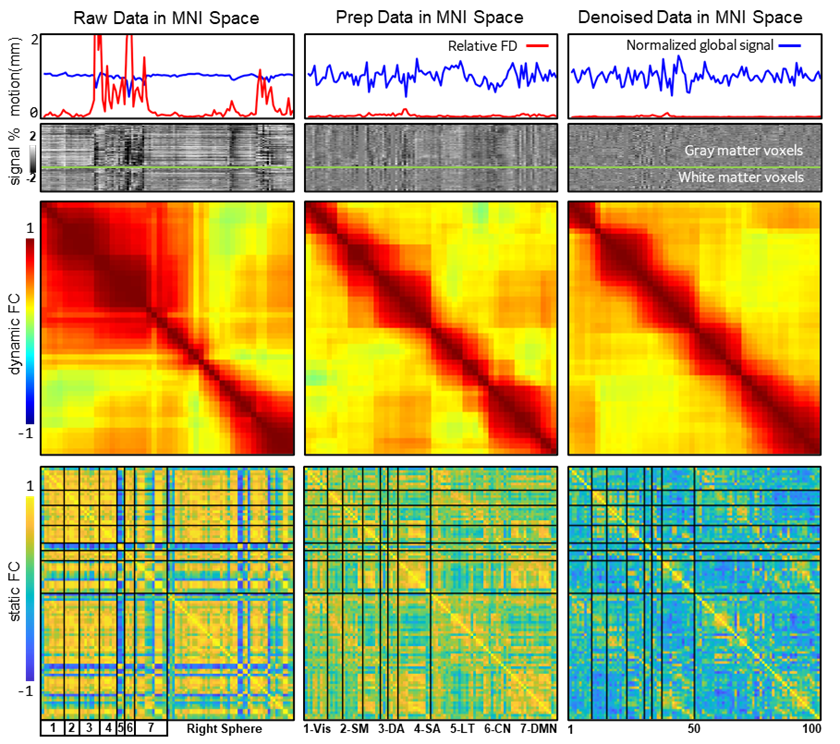
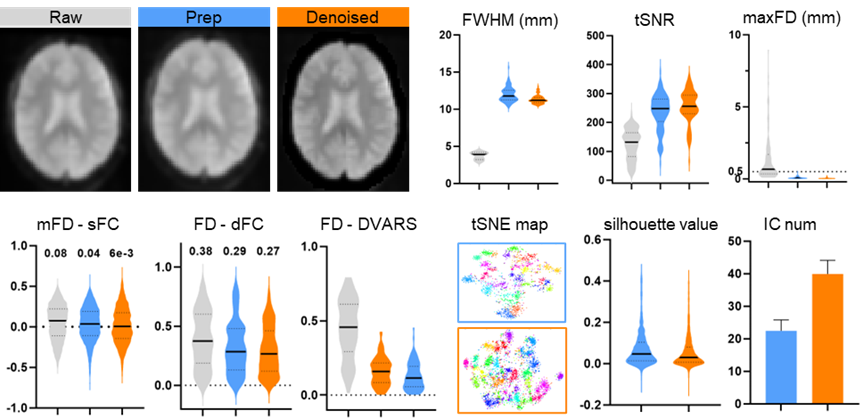
Participants and data: The resting-sate fMRI data used in this study were collected the site UCLA from open datasets ABIDE I (http://fcon_1000.projects.nitrc.org/indi/abide/abide_I.html). The total number of subjects is 98 (86 males and 12 females) and both healthy controls and patients were treated as the same. To avoid the bias, gender, age and group were regressed out as covariables in group-level analysis (e.g. partial correlation). The raw data and preprocessed data (DPABI pipeline, http://preprocessed-connectomes-project.org/abide/dparsf.html) were considered as the controlled condition for assessment the performance of proposed method (three conditions in short, raw (raw data), prep (standard pipeline) and denoised (proposed method)). Proposed method: The basic idea is to transfer the standard preprocessing steps into eigen-space in which the motion and other physiological noise are easier to detect and remove. We first used singular eigenvector decomposition to decompose raw data into a subspace consisting of spatial and temporal eigenvectors. Then, head motion, WM and CSF signals and low fluctuation were identified and rejected with linear regression on the temporal eigenvectors. Meanwhile, spatial eigenvectors were refined with procedures including scatters removing, soft smooth and outlier rejections. Final, the denoised eigenvectors were reconstructed into clean data in the original space. For better comparison, we also normalized data into MNI space and controlled a similar smooth kernel size. Outcome measures: The assessment of effectiveness in controlling noise were based on both quantitative and qualitative metrics for raw, prep, and prop. The global signal and head motion parameters were estimated for three conditions. Hence, combined with the grayplot[3], a clear visual inspection was represented to demonstrate the BOLD signal change in spatio-temporal domain. The static functional connectivity (sFC) was calculated with 100-ROI functional atlas from Schaefer’s cortical parcellation[4] To compute the dynamic functional connectivity (dFC), the windowed FC was first computed with the set of a 60s window and a 6s step (TR=3s) and then measured with the Pearson correlation between the upper triangular parts of the matrices in all the intervals[5]. As for data quality assessment, temporal signal-to-noise ratio (tSNR, mean/std of timeseries) and max frame-wise displacement (maxFD, maximum value of subtle in-scanner movements from volume-to-volume) were used to assess the brain-wide noise level and the motion controlling ability. Then we calculated the mFD-sFC association[6], that defined by subject-specific mean FD and functional connectivity intensity of sFC, to estimate the contamination effect of motion on functional connectivity analysis. The retained motion confound within timeseries were compared by correlation between dFC/DVARS. For further analysis, individual-level independent component analysis (indiv-ICA) were performed to extract the function networks, then k-mean classification and the silhouette values were utilized to quantify the network clusters.Results
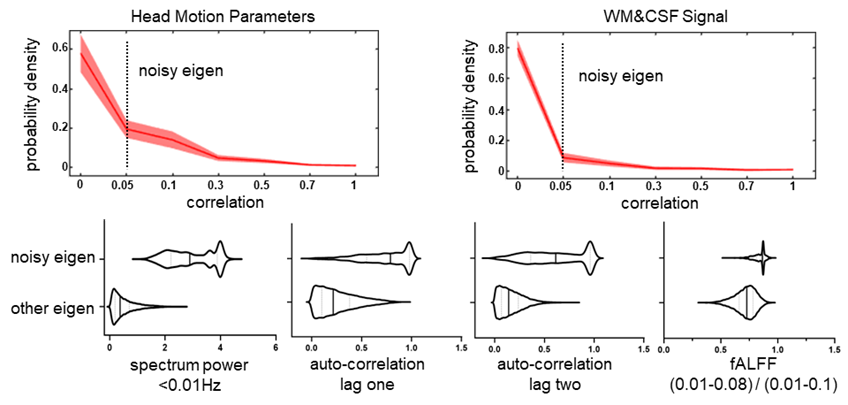
Head motion parameters and WM&CSF signal were treated as the additive noises and any eigenvectors with coefficients over 0.05 will be regarded as mixture of signal and noise. As shown in in Figure 1, the proportion of two major types of noisy eigenvectors were around 0.4 for motion-related and 0.2 physiological noise. Meanwhile, other features like spectrum power, autocorrelation and fALFF were exhibiting a distinguish difference. In Figure 2, the illustration denotes proposed method had a better effect in correcting the abnormal trends of timeseries. Obviously, dFC and sFC had been contaminated by motion with abrupt correlation change in certain period. The prep result did subdue the noise but couldn’t relief dFC and sFC from oddly over-correlated regions. After controlling a similar FWHM size, proposed method outperformed in cleaning the data when comparing to those metrics of evaluating noisy compounds (Figure 3).Conclusion and Discussion
In this study, the proposed method has improved the denoise effect for resting-state fMRI in cleaning motion-related artifact or other non-neuronal physiological noises. Those additive noises can be precisely targeted in the eigen-space than raw data, which is a completed mixture of neuron signal and noise. Furthermore, denoising procedures like linear regression conducted only in noisy eigenvectors, has soften the altering on the timeseries. Those typical functional networks are well kept and the sFC/dFC map represent reasonable regional correlation or state shifting board than standard pipeline method.Acknowledgements
No acknowledgement found.References
[1] Ciric R, Wolf D H, Power J D, et al. Benchmarking of Participant-Level Confound Regression Strategies for the Control of Motion Artifact in Studies of Functional Connectivity[J]. NeuroImage, 2017, 154: 174–187.
[2] Parkes L, Fulcher B, Yücel M, et al. An Evaluation of the Efficacy, Reliability, and Sensitivity of Motion Correction Strategies for Resting-State Functional MRI[J/OL]. NeuroImage, 2018, 171(July 2017): 415–436.
[3] Power J D. A Simple but Useful Way to Assess FMRI Scan Qualities[J/OL]. NeuroImage, 2017, 154: 150–158.
[4] Schaefer A, Kong R, Gordon E M, et al. Local-Global Parcellation of the Human Cerebral Cortex from Intrinsic Functional Connectivity MRI[J/OL]. Cerebral Cortex, 2018, 28(9): 3095–3114[2022–10–18].
[5] Hansen E C A, Battaglia D, Spiegler A, et al. Functional Connectivity Dynamics: Modeling the Switching Behavior of the Resting State[J]. NeuroImage, 2015, 105: 525–535.
[6] Power J D, Schlaggar B L, Petersen S E. Recent Progress and Outstanding Issues in Motion Correction in Resting State FMRI[J]. NeuroImage, 2015, 105: 536–551.
Figures