1986
Hemodynamics in children with partial anomalous pulmonary venous return and atrial septal defect using 4D-flow MRI.
Fraser Maurice Callaghan1,2, Barbara Burkhardt2,3, Emanuela Valsangiacomo Buechel2,3, Christian Kellenberger2,4, and Julia Geiger2,4
1Center for MR Research, University Children's Hospital Zurich, Zurich, Switzerland, 2Children’s Research Center, University Children's Hospital Zurich, Zurich, Switzerland, 3Division of Pediatric Cardiology, University Children's Hospital Zurich, Zurich, Switzerland, 4Department of Diagnostic Imaging, University Children's Hospital Zurich, Zurich, Switzerland
1Center for MR Research, University Children's Hospital Zurich, Zurich, Switzerland, 2Children’s Research Center, University Children's Hospital Zurich, Zurich, Switzerland, 3Division of Pediatric Cardiology, University Children's Hospital Zurich, Zurich, Switzerland, 4Department of Diagnostic Imaging, University Children's Hospital Zurich, Zurich, Switzerland
Synopsis
Keywords: Cardiovascular, Cardiovascular, 4D flow, Congenital heart disease
4D flow MRI is used to assess flow dynamics in the pulmonary veins and left atrium of 10 patients (mean age 3.8 years) with partial anomalous pulmonary venous return and atrial septal defect compared with 13 age matched normal subjects. Anomalous veins do not have a higher proportion of total return flow compared to normal subjects. Flow across the atrial septal defect results in a higher proportion of flow during systole compared to normal subjects and results in lower atrial pressure and thus reduced left ventricle filling velocities. Atrial kick dynamics are not different compared with normal subjects.INTRODUCTION
Partial anomalous pulmonary venous return (PAPVR) combined with atrial septal defect (ASD) is a rare complex congenital heart defect (CHD). 4D-flow MRI is a valuable tool in CHD flow assessment, thanks primarily to its ability for retrospective analysis of flow volumes at multiple and complex locations1,2. Previous work assessing PAPVR with 4D-flow has relied upon streamline assessment, which is an artificial measure with no connection to physiology3.This work uses pathline tracking in 4D flow MRI to quantify hemodynamics in PAPVR+ASD compared with normal flow dynamics.
METHODS
We used 4D-flow MRI to assess the left atrial (LA) flow dynamics in 10 patients (age 3.8±1.9 years) with PAPVR+ASD, in comparison with 13 age-matched normal subjects (age 3.8±1.7 years).MRI examinations were performed on a GE 1.5T Discovery, or SIGNA Artist scanner. Spatial resolution was 1.2±0.2 mm in-plane, slice thickness 1.8±0.2 mm. Mean temporal resolution was 23.5±3.1 ms (24-30 phases per cardiac cycle). A k-t acceleration parallel imaging technique (kat-ARC=8) was employed4.
The 4D-flow dataset was corrected for background phase offsets using a 4th order polynomial fit to semi-automatically defined static tissue5. Regions of interest (ROI) were placed at each pulmonary vein (PV), the ASD and mitral valve (MV) permitting flow measurements and flow particle tracking was used as a validated method to classify flow transfer by source (PV) and destination (ASD or MV)6 (Figure 1).
RESULTS
All patients had a right upper anomalous pulmonary vein and a superior sinus ASD. Patients had a range of pulmonary to systemic flow ratios (Qp:Qs) from 2.2-3.5 (mean±standard deviation: 2.7±0.4). Qp:Qs ratio in patients correlated positively with ASD area (r=0.8). The fraction of total PV return flow per PV was calculated for each subject and no differences were found between normal and PAPVR+ASD subjects (Figure 2).Pathline tracking showed a well structured vortex in the LA, for all normal subjects, driven primarily by the left upper and lower PV. In patients the proximal flow dynamics were similar, but distal dynamics were disturbed by flow passing through the ASD. Pathline tracking from each PV source individually, permitted clear establishment of the location, orientation and size of the ASD in all patients (FIgure 1).
Right lower PV flow was more likely to pass through the ASD (75%) than the MV. Left lower PV flow was more likely to pass through the MV (75%) and left upper PV flow was almost evenly distributed to the ASD (44%) and MV (56%) (Figure 3). The greatest amount of flow through the ASD occurred during systole. All patients’ PVs showed a significantly greater proportion of total flow volume passing during systole compared with normal subjects (all p<0.01) who conversely showed greater proportion of flow volume during early-mid diastole (all p<0.01) (Figure 4). Pulmonary vein flow dynamics during the late diastole (atrial kick) period of the cardiac cycle showed no difference. Left ventricular filling velocities were significantly reduced (p<0.001) in PAPVR+ASD patients compared to normal subjects.
DISCUSSION
4D flow MRI permits clear classification of flow paths and ratios in CHD, highlighted by separation of PV flow passing through the MV and ASD in PAPVR+ASD patients.We used flow volume measurements to show that even though the right upper PV drains to a low resistance system there was no difference in the proportion of total PV return volume draining via the right upper PV between normal subjects and PAPVR+ASD patients.
We have also shown in PAPVR+ASD patients, using 4D flow pathline tracking and classification, that blood flow through all non-anomalous veins contributes to ASD flow with preference for flow from the right lower PV. This can be expected by the close proximity of the right lower PV to the ASD location. Flow from the left pulmonary veins both contribute to forming a strong clockwise vortex in the LA, when viewed from posterior to anterior matching that previously described by Fyrenius et al (Figure 1)7.
Flow through the ASD resulted in a greater proportion of PV return during systole. This occurs due to the ASD offering a low resistance path for flow into the right atrium. In normal subjects, flow through the PV during systole acts to overload the LA prior to MV opening. This permits rapid and efficient LV filling. The flow velocity passing the MV in PAPVR+ASD patients was significantly lower than that observed in normal subjects indicating a lack of LA pressure build up. However, no differences in flow dynamics were observed during the atrial kick period of LV filling.
Acknowledgements
No acknowledgement found.References
Figures
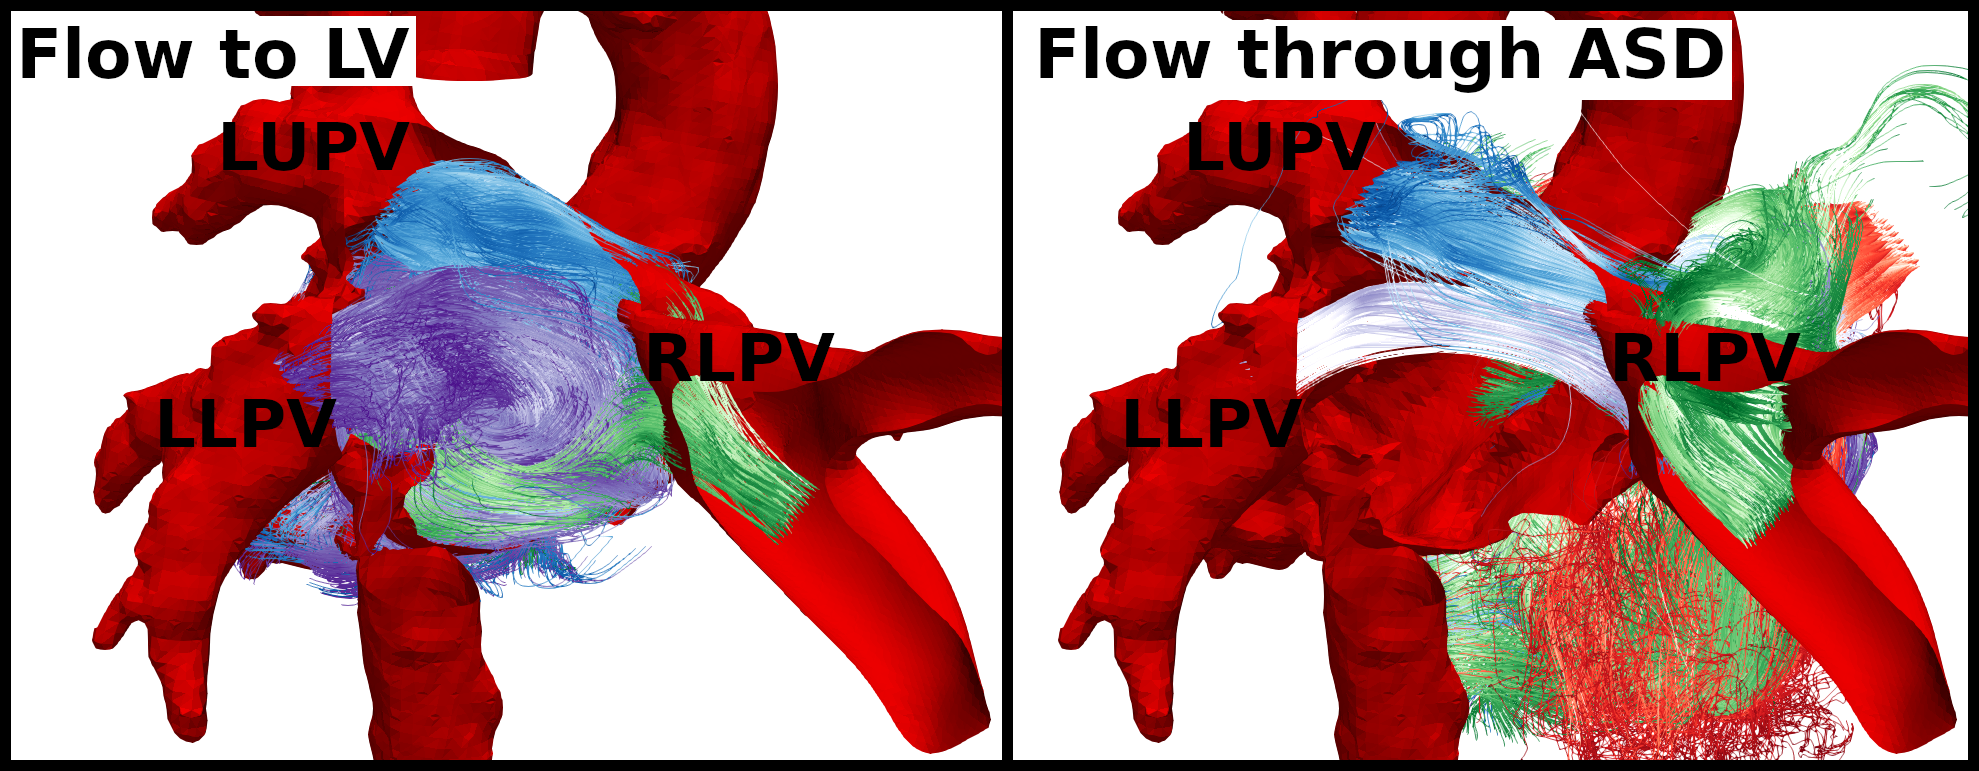
Figure 1. Posterior view of representative PAPVR+ASD patient showing pulmonary paths passing to the left ventricle (left) and passing through the atrial septal defect (right).
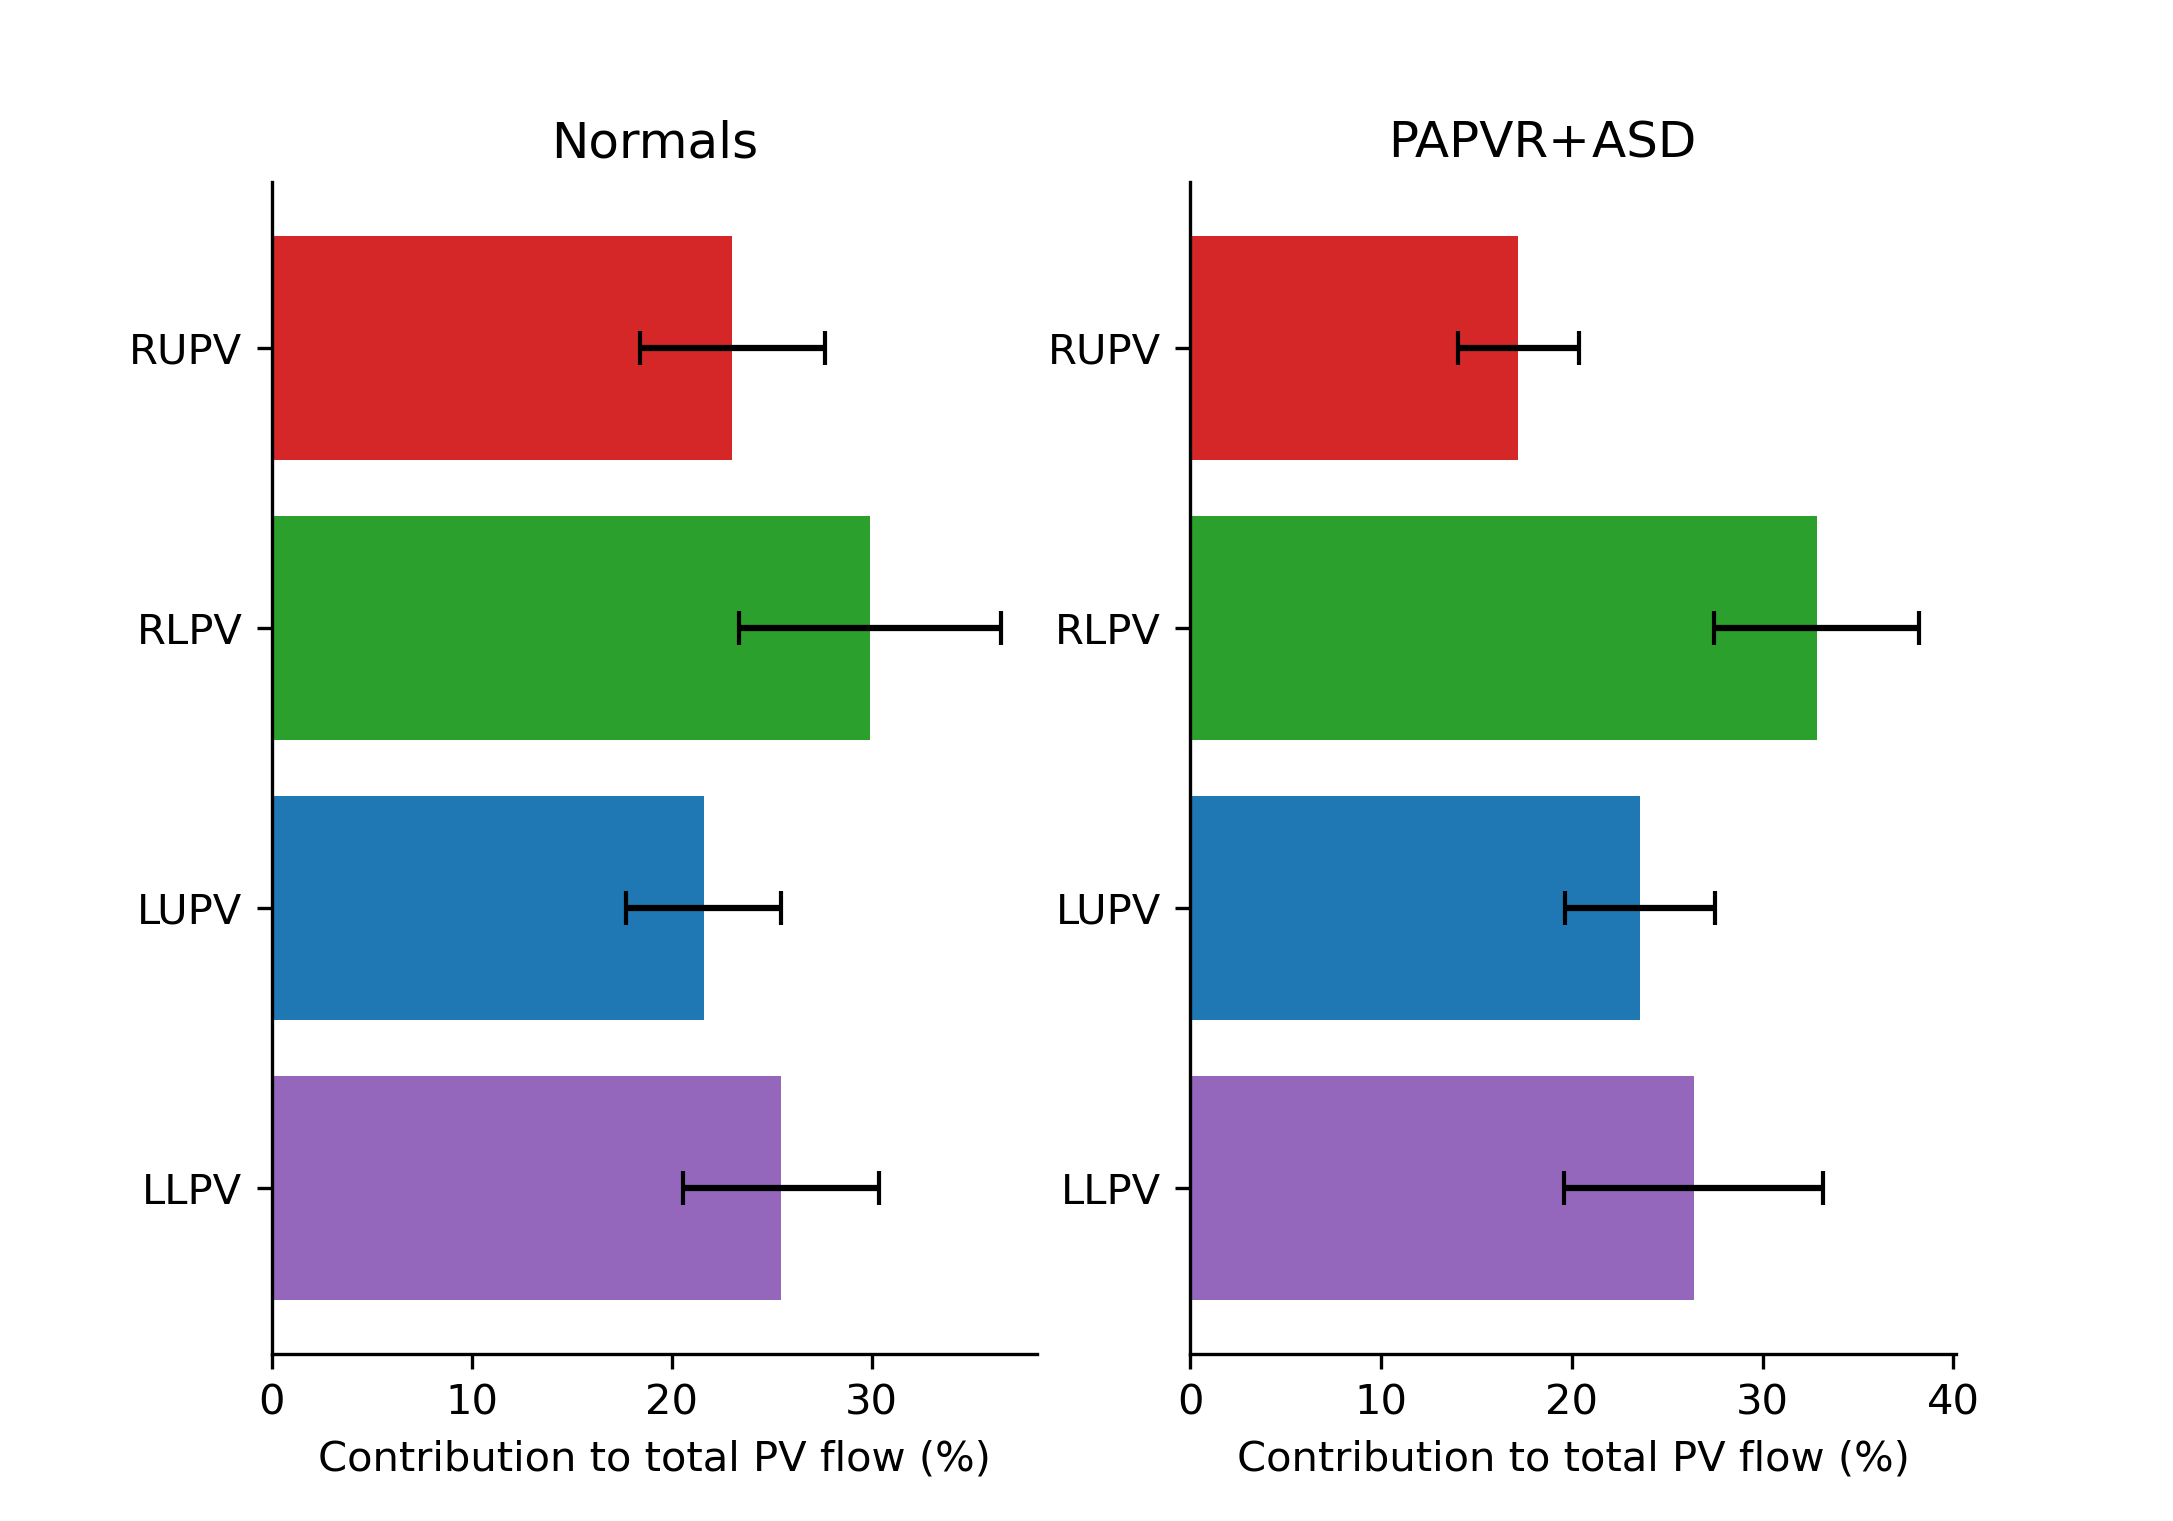
Figure 2. Fractional distribution of total pulmonary return flow per pulmonary vein in normal subjects (left) and PAPVR+ASD patients (right). RUPV, RLPV, LUPV, LUPV: Right upper, right lower, left upper, left lower pulmonary veins respectively.
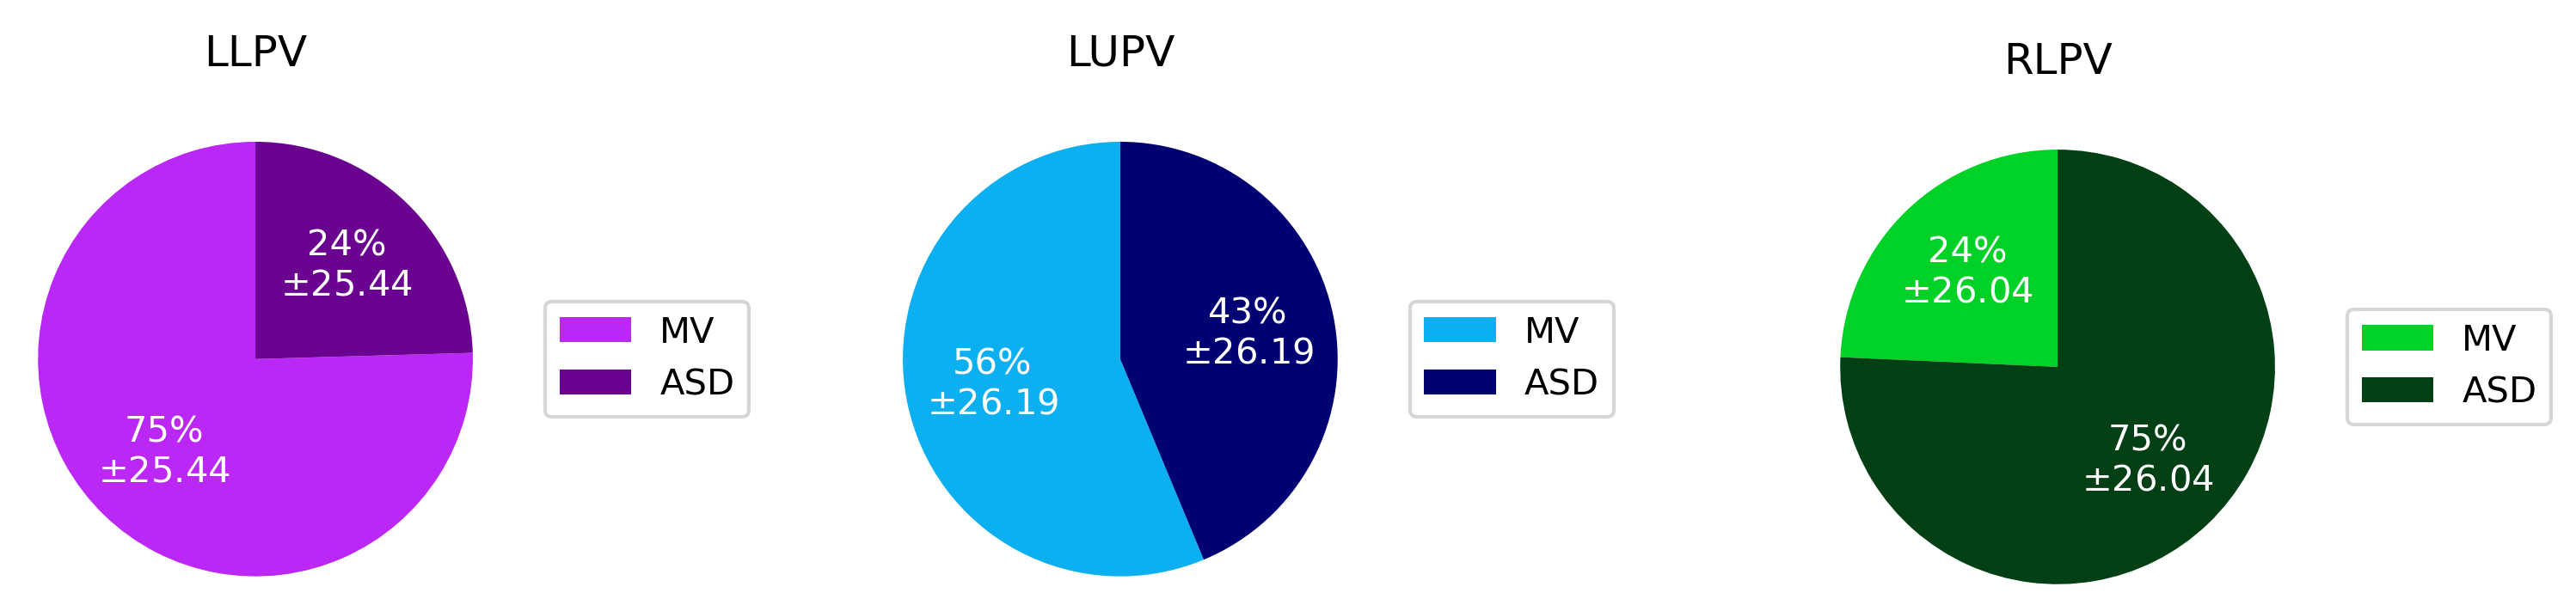
Figure 3. Destination of total pulmonary vein return flow for non-anomalous veins. LLPV, LUPV, RLPV: left lower, left upper, right lower pulmonary veins respectively.
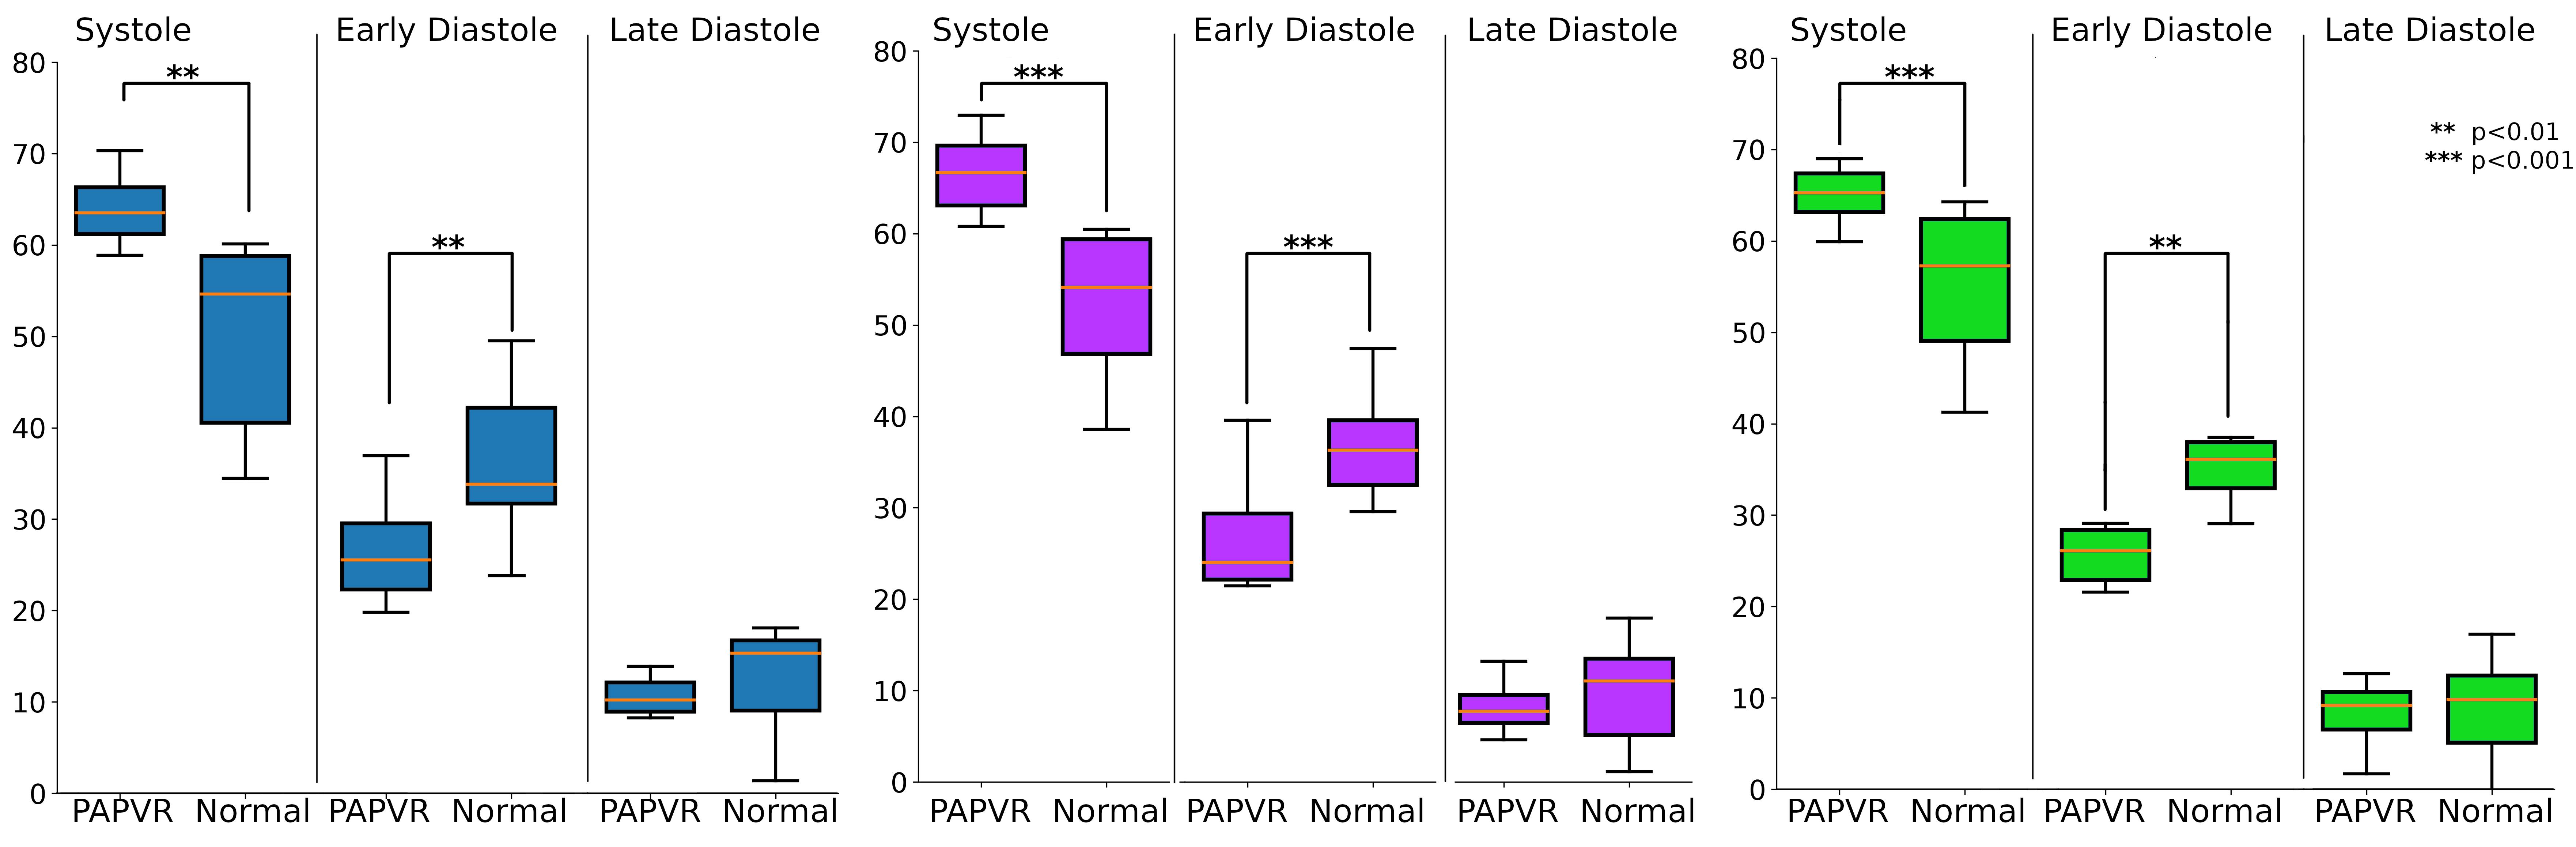
Figure 4. Temporal measure of fraction flow volume passing through non-anomalous veins during a cardiac cycle in normal and PAPVR+ASD patients, classified by systole, early and late (atrial kick) diastole phases. Left: Left upper pulmonary vein, middle: left lower pulmonary vein, right: right lower pulmonary vein.
DOI: https://doi.org/10.58530/2023/1986