1975
Prediction of Astrocytoma Pathological Grade Using Radiomics Extracted from Pre-operative Multiparametric MRI1Institution of Biomedical Engineering, Boğaziçi University, İstanbul, Turkey, 2Department of Medical Pathology, Acıbadem University, İstanbul, Turkey, 3Brain Tumor Research Group, Acıbadem University, İstanbul, Turkey, 4Department of Neurosurgery, Acıbadem University, İstanbul, Turkey, 5Department of Radiology, Acıbadem University, İstanbul, Turkey
Synopsis
Keywords: Tumors, Radiomics, astrocytoma, pathological grade, machine learning
The astrocytomas are currently graded from 2 to 4 according to World Health Organization 2021 central nervous system tumor classification. Increasing grade defines increasing malignancy. This study aims to explore the potential of radiomics features extracted from multiparametric pre-operative MRI to predict the grade of astrocytomas. For differentiation of grade 2 from grades 3&4, the FLAIR radiomics were predominantly determined by the feature selection procedure. The highest accuracy for differentiating grade 2 from grades 3&4 was 88.04±0.03% (92.37±0.04% precision and 86.76±0.04% recall).Introduction
The most recent World Health Organization (WHO) 2021 central nervous system tumor classification defines three types of adult diffuse gliomas: oligodendroglioma, astrocytoma, and glioblastoma, according to their morphologic and molecular-genetic features.1 Astrocytoma is the second most common glioma type and, with increasing malignancy, is graded from grade 2 to grade 4.2 In this work, we sought to predict tumor grade using radiomics features. Radiomics extracts a large number of quantitative and mineable features from standard imaging modalities.3 Radiomics features have been applied to increase the prediction accuracy of brain tumor diagnosis and prognosis and determine the optimal treatment strategy.4 In the present study, we explored if radiomics extracted from the pre-operative multiparametric (pre- (T1w) and post-contrast (T1w+C) T1-weighted, T2-weighted (T2w) and fluid attenuation imaging recovery (FLAIR)) MRI could predict the WHO grade of astrocytomas.Methods
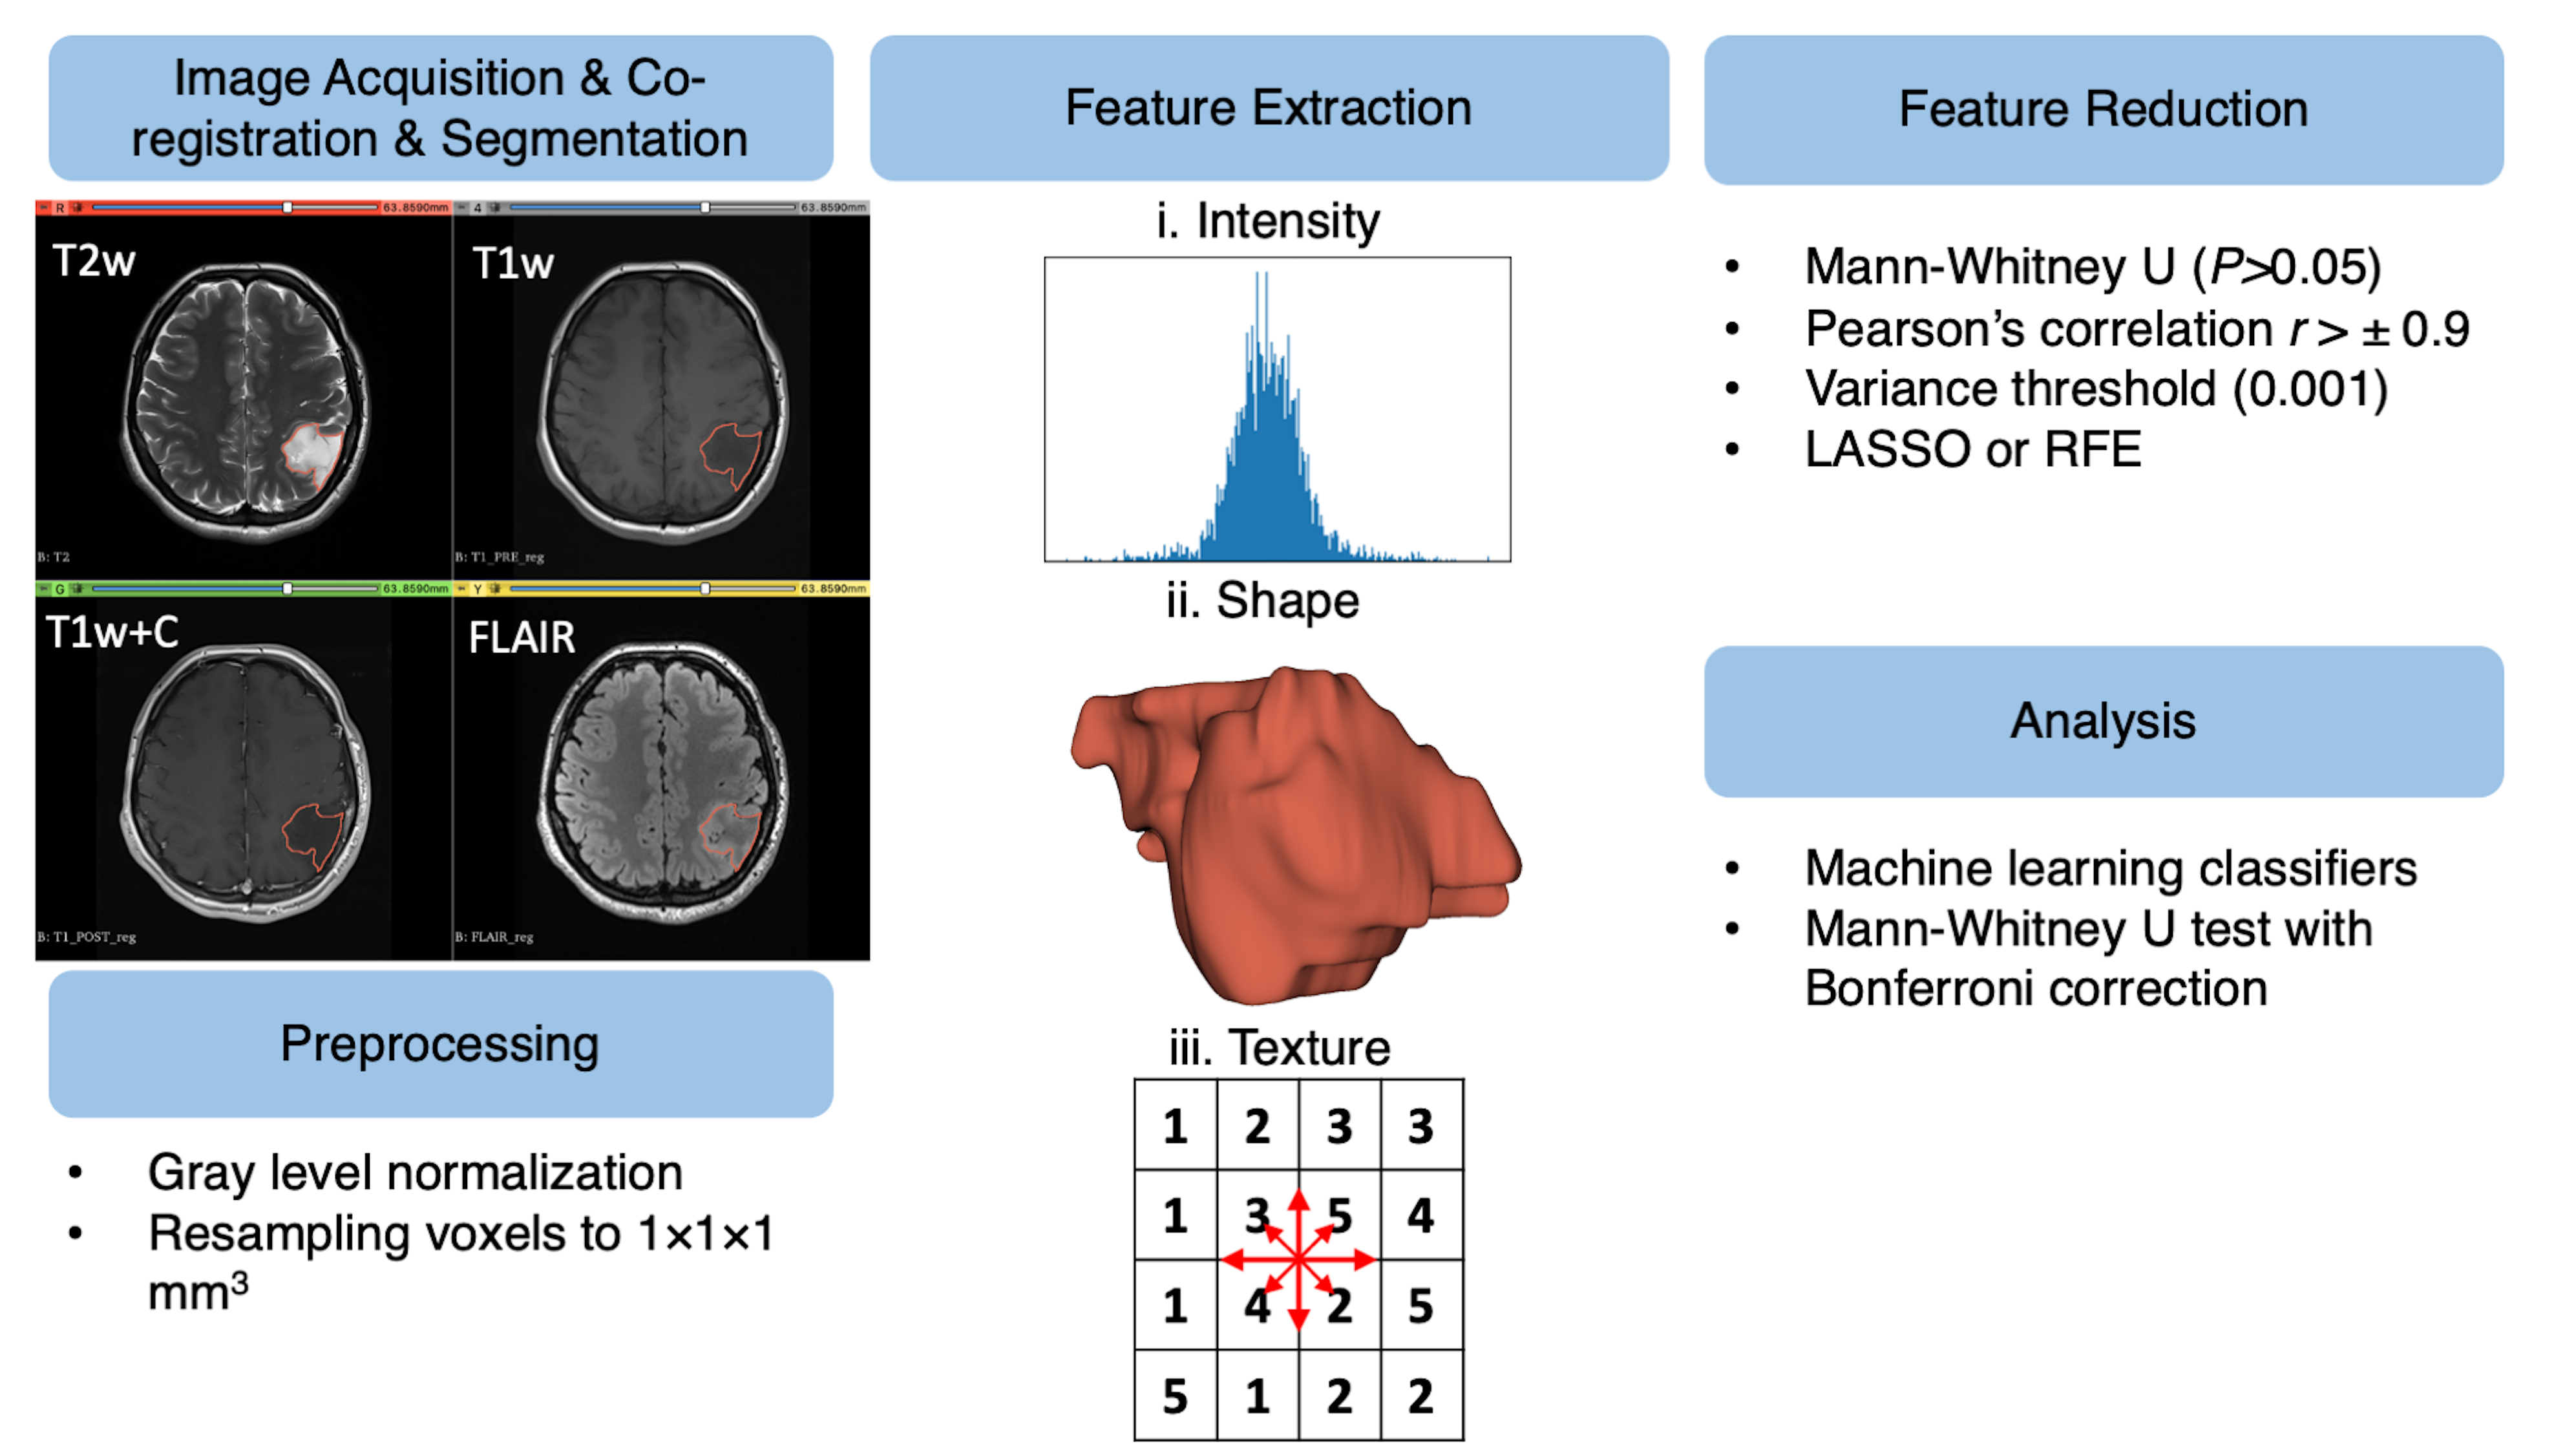
We retrospectively collected data from 44 astrocytomas (f/m:23/21, (mean±std) age: 36.45±13.30 years). Our study population included 18 (40.9%) grade 2, 24 (54.5%) grade 3, and 2 (4.6%) grade 4 astrocytomas. A pre-operative brain protocol, including T1w and T1w+C (TR/TE: 460/9.8 ms), T2w (TR/TE: 3470/107 ms), and FLAIR (TR/TE: 6000/98 ms), was acquired at a 3T clinical MR scanner (Siemens Healthcare, Erlangen, Germany). The radiomics workflow of this study is given in Fig. 1. A combined radiomics model (T1w, T1w+C, T2w, and FLAIR) was constructed to predict the grade of astrocytomas. First, the tumor region was delineated manually on T2w MRI using 3D Slicer software.5 T1w, T1w+C, and FLAIR MRI were co-registered to T2w MRI using Elastix module on 3D Slicer software.5,6 Then, the segmentations were overlaid onto the co-registered images. For preprocessing step, a 100-gray-level normalization scale was applied to the images. To minimize the effect of inhomogeneity between acquisitions, images were z-score normalized and resampled to the same resolution (1×1×1 mm3). 1820 radiomics features were extracted for each modality, including intensity, shape, and texture features, using PyRadiomics (Fig. 1).7 In total, we had 7280 combined radiomic features for each patient. The features with P values of >0.05 in the Mann-Whitney U test were eliminated. Afterward, the features that had low variance (0.001) were removed. Subsequently, collinear features with higher pairwise Spearman’s correlation (r>±0.9) and column-wise average absolute correlation were removed from the feature set. For the final step of the feature selection process, recursive feature elimination (RFE) or least absolute shrinkage and selection operator (LASSO) were applied to the training set to search for the optimal predictive features. This process was repeated 100 times with different seed values, and the final feature subset was determined with four top features to avoid overfitting.8 The differences between grade 2 and grade 3&4 astrocytomas in selected radiomics were assessed by the Mann-Whitney U test with Bonferroni correction (P<0.0125). The grades of astrocytomas were classified using classical machine learning classifiers with 10-fold cross-validation and 50 repetitions with different seed values.Results
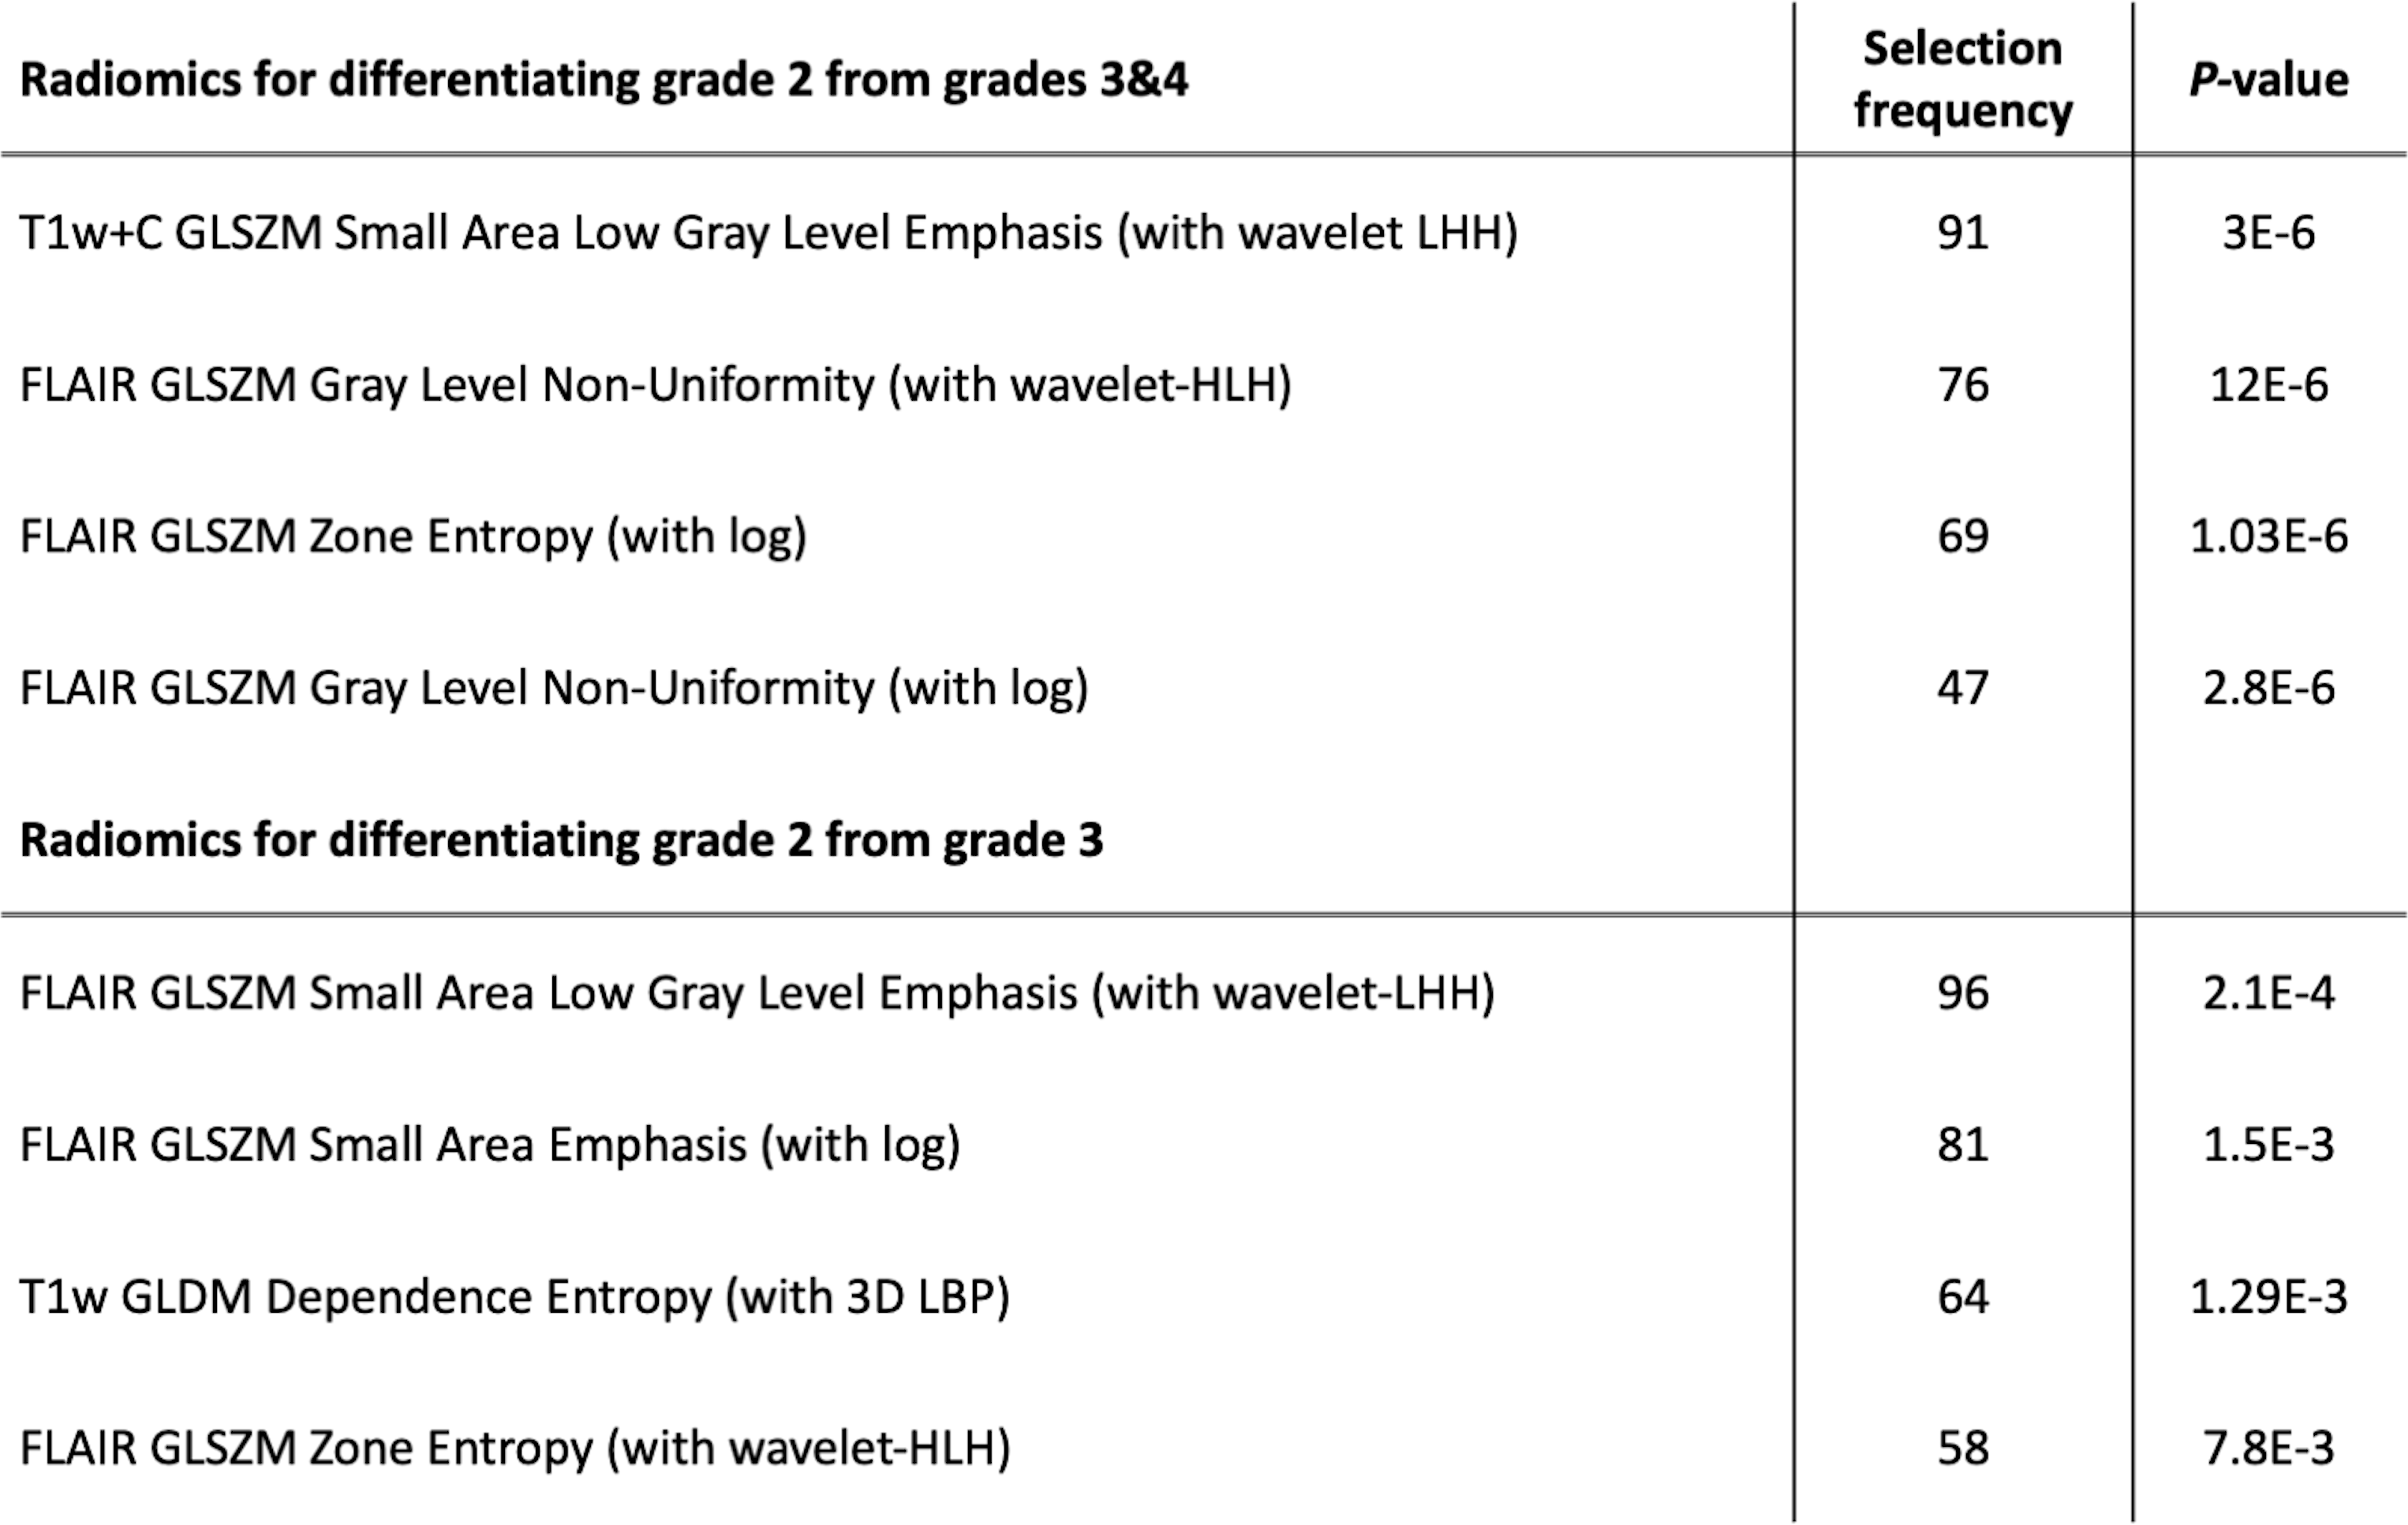
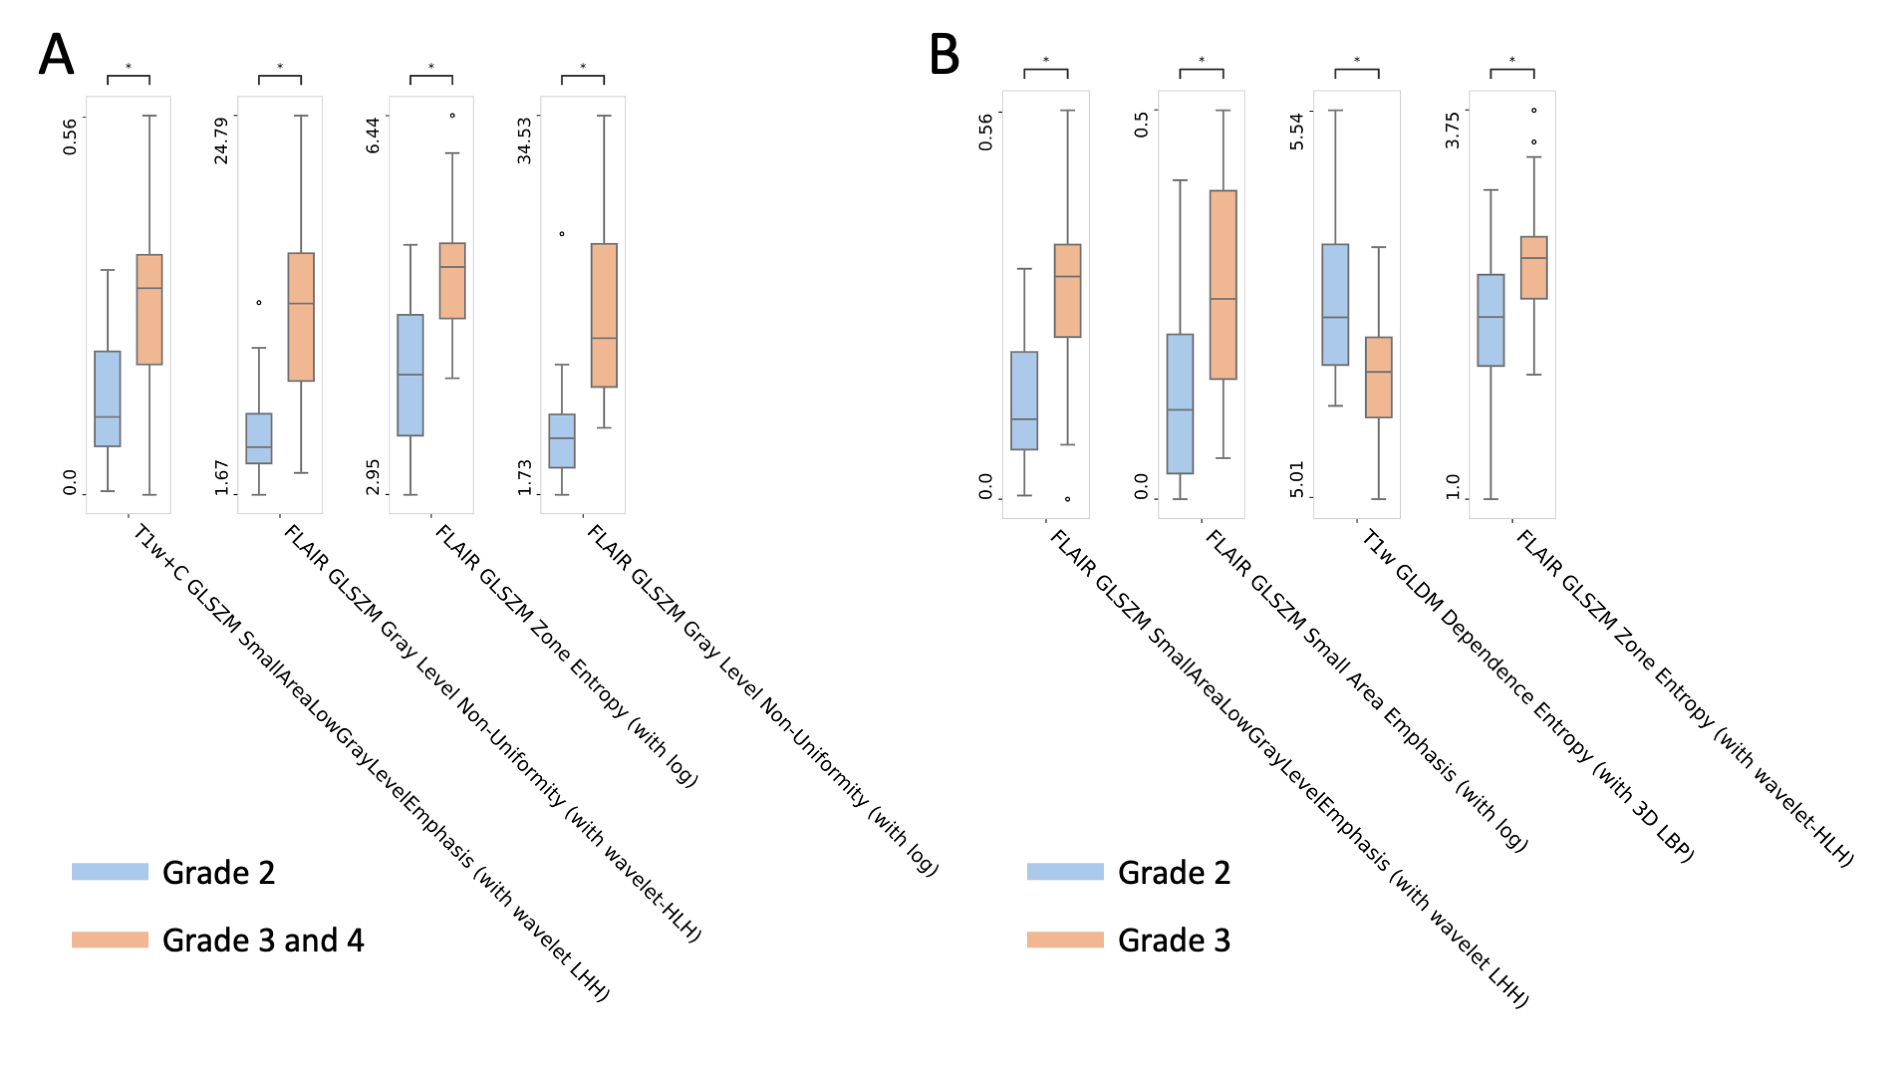
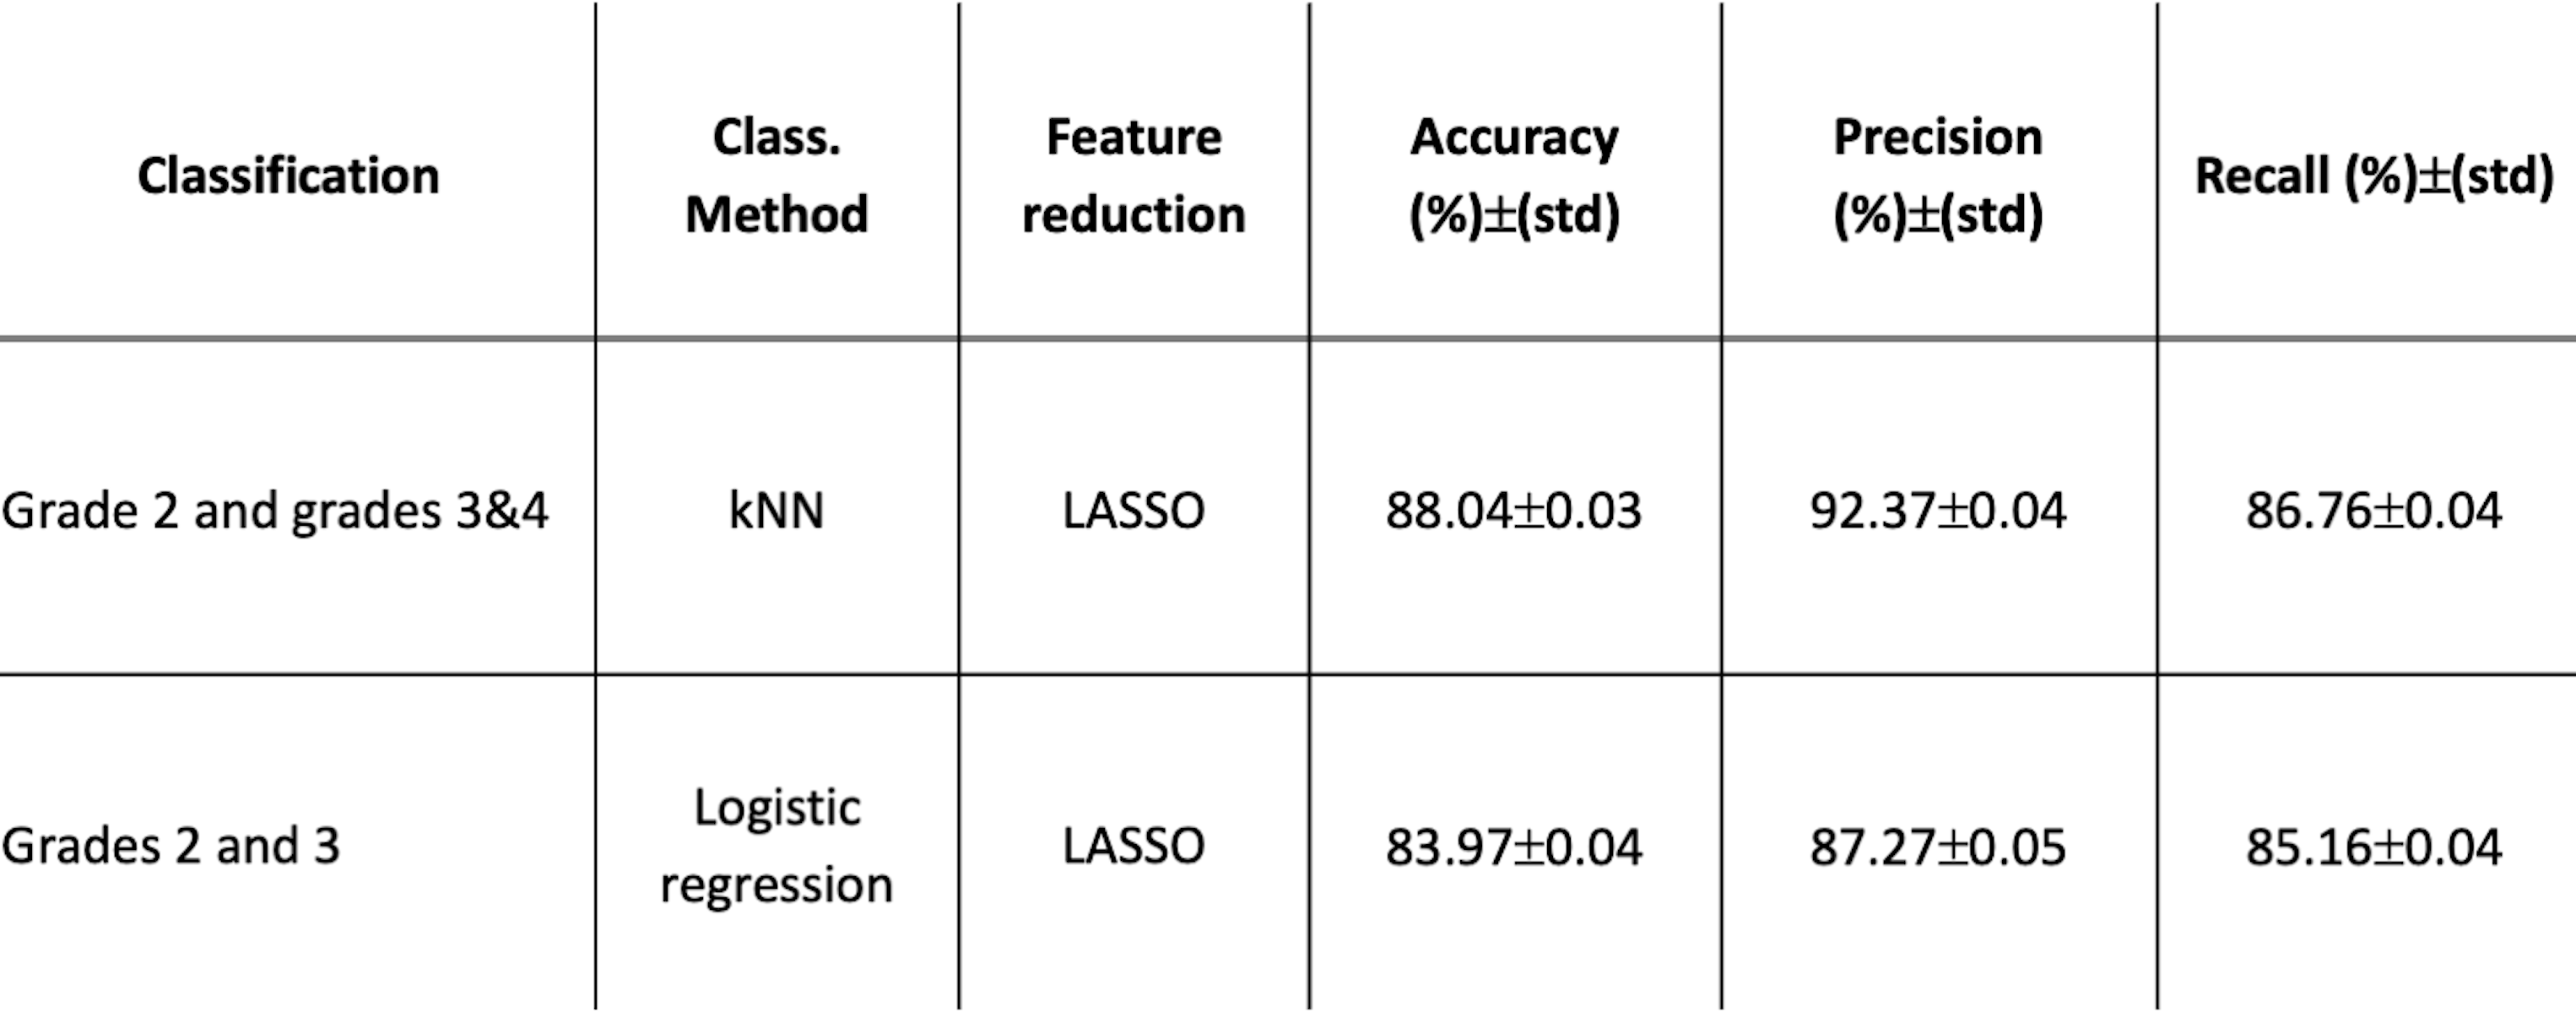
The four most selected features for predicting astrocytoma grades are presented in Table 1. Grade 3&4 astrocytomas had significantly higher T1w+C GLSZM small area low gray level emphasis (with wavelet low-high-high (LHH) filtering), FLAIR GLSZM gray level non-uniformity normalized (with wavelet high-low-high (HLH) filtering), FLAIR GLSZM zone entropy (with logarithm (log) filtering), and FLAIR GLSZM gray level non-uniformity (with log filtering) than grade 2 astrocytomas. While grade 3 patients had higher FLAIR GLSZM small area low gray level emphasis (with wavelet low-high-high (LHH) filtering), FLAIR GLSZM small area emphasis (with log filtering), and FLAIR GLSZM zone entropy (with wavelet-HLH), they showed significantly lower FLAIR GLDM dependence entropy (with 3D LBP) compared to grade 2 tumors (Fig. 2, P<0.005 for all). The best performance for differentiating grade 2 from grades 3&4 was obtained with a k-nearest neighbor (kNN) classifier that resulted in an accuracy of 88.04±0.03% (92.37±0.04% precision and 86.76±0.04% recall) (Table 2). On the other hand, grade 2 and grade 3 astrocytomas were differentiated best with a logistic regression classifier, and the accuracy, precision, and recall were 83.97±0.04%, 87.27±0.05, and 85.16±0.04%, respectively.Discussion
According to the results, a multimodal radiomics model might be helpful for the prediction of the WHO grade of astrocytomas. Higher-grade (grade 3&4) gliomas often have more pronounced intra-tumoral heterogeneity than low-grade tumors. Although conventional anatomical MRI plays an essential role in diagnosing and managing brain tumors, it has limited ability to resolve tumor intra-heterogeneity and needs more advanced sequences.9 Texture features have the potential to quantify intra-tumoral heterogeneity that is invisible to the human eye.10 In our study, the features that significantly differed between astrocytoma grades were mostly from FLAIR and were related to intra-tumoral heterogeneity. Higher GLSZM gray level non-uniformity, GLSZM zone entropy, and dependence entropy are indicators of the region of interest (ROI) heterogeneity. WHO grade 3 & 4 astrocytomas had more heterogeneous tumor regions than grade 2 patients, who are expected to have more favorable outcomes.Conclusion
The current findings indicate that the WHO grades of astrocytomas could be differentiated by radiomics features extracted from anatomical pre-operative MRI.Acknowledgements
This study was supported by the Scientific and Technological Research Council of Turkey (TUBITAK) 1003 grant 216S432.References
1. Louis DN, Perry A, Wesseling P, et al. The 2021 WHO classification of tumors of the central nervous system: A summary. Neuro-Oncol. 2021;23(8):1231-1251. doi:10.1093/neuonc/noab106
2. Astrocytoma Tumors. https://www.aans.org/en/Patients/Neurosurgical-Conditions-and-Treatments/Astrocytoma-Tumors#:~:text=A Neurosurgeon Explains%3A Astrocytoma Tumors&text=Astrocytomas are tumors which originates,astrocytomas are diagnosed every year.
3. Lambin P, Leijenaar RTH, Deist TM, et al. Radiomics: the bridge between medical imaging and personalized medicine. Nat Rev Clin Oncol. 2017;14(12):749-762. doi:10.1038/nrclinonc.2017.141
4. Gillies RJ, Kinahan PE, Hricak H. Radiomics: Images Are More than Pictures, They Are Data. Radiology. 2016;278(2):563-577. doi:10.1148/radiol.2015151169
5. 3D Slicer image computing platform. https://www.slicer.org/
6. Klein S, Staring M, Murphy K, Viergever MA, Pluim J. elastix: A Toolbox for Intensity-Based Medical Image Registration. IEEE Trans Med Imaging. 2010;29(1):196-205. doi:10.1109/TMI.2009.2035616
7. van Griethuysen JJMM, Fedorov A, Parmar C, et al. Computational radiomics system to decode the radiographic phenotype. Cancer Res. 2017;77(21):e104-e107. doi:10.1158/0008-5472.CAN-17-0339
8. Jain AK, Duin PW, Jianchang Mao. Statistical pattern recognition: a review. IEEE Trans Pattern Anal Mach Intell. 2000;22(1):4-37. doi:10.1109/34.824819
9. Hu LS, Hawkins-Daarud A, Wang L, Li J, Swanson KR. Imaging of intratumoral heterogeneity in high-grade glioma. Cancer Lett. 2020;477:97-106. doi:10.1016/j.canlet.2020.02.025
10. Molina D, Pérez-Beteta J, Luque B, et al. Tumour heterogeneity in glioblastoma assessed by MRI texture analysis: a potential marker of survival. Br J Radiol. 2016;89(1064):20160242. doi:10.1259/bjr.20160242
Figures