1970
Glioma grading using multiparametric MRI: head-to-head comparison among four different advanced techniques1Radiology, Seoul St. Mary's Hospital, Seoul, Korea, Republic of, 2Hospital Pathology, Seoul St. Mary's Hospital, Seoul, Korea, Republic of, 3Neurosurgery, Seoul St. Mary's Hospital, Seoul, Korea, Republic of
Synopsis
Keywords: Tumors, Tumor, Glioma
Diagnostic performances differentiating low-grade (LGGs) from high-grade gliomas (HGGs) were compared between the four advanced techniques of multiparametric MRI—DSC, DCE, MRS and DWI. Sixty-four patients with pathologically confirmed glioma underwent preoperative multiparametric MRI with the four techniques, followed by histogram analysis of the tumors. HGGs showed significantly higher Ktrans, rCBV, and Cho/Cr than LGGs. The AUROC of the 95th percentile Ktrans was 0.83, being the most helpful parameter, followed by 95th percentile rCBV (0.72). Significant correlations were observed between the 95th percentile rCBV and Ktrans. Our findings demonstrate higher diagnostic utility of DCE and DSC MRI in glioma grading.Introduction
Gliomas are the most common primary malignant tumors of the central nervous system (CNS), which are classified into four grades based on the World Health Organization (WHO) grading scale.1,2 In neuro-oncology, accurate grading of gliomas at initial presentation is crucial for surgical and treatment planning and individual prognosis.The grading of gliomas based on conventional MRI is not adequate for distinguishing high-grade gliomas (HGGs) from low-grade gliomas (LGGs) because it does not provide information regarding the microvascularity, angiogenesis, or cellularity of tumors.3 Several prior studies reported the diagnostic values of advanced MR imaging protocols, including dynamic contrast-enhancement MRI (DCE),4,5 dynamic susceptibility contrast MRI (DSC),6,7 MR spectroscopy (MRS),8 and diffusion-weighted imaging (DWI)9,10 for grading gliomas.
This study aimed to evaluate intra-individually the diagnostic performance of various advanced MR techniques, including DSC, DCE, DWI, and MRS, in distinguishing LGGs from HGGs.
Methods
This single-center retrospective study included 64 patients with pathologically confirmed gliomas (16 LGGs, 48 HGGs). The grading of gliomas was not based on the recently updated fifth edition of the WHO Classification of Tumors of the CNS11 because our retrospective analysis utilized pathology reports based on the previous fourth edition.2MR images of all patients were acquired using one of three 3T MR scanners (Siemens Magnetom Verio, Vida; Philips Ingenia). DWI was acquired using the single-shot or multi-shot echo-planar imaging (SS-EPI or MS-EPI) technique, and b=0, b=1,000, and b=3,000 images were used to generate the apparent diffusion coefficient (ADC) maps. The point-resolved spectroscopy (PRESS) method was used for MRS acquisition with short (30–34 ms) and intermediate echo time (TE) settings (135 ms). During the 3 mL/sec intravenous injection of 0.1 mmol/kg contrast material, the DCE scan by spoiled gradient echo acquisition was performed first, followed by the DSC scan utilizing SS-EPI (Verio, Vida) or coherent gradient echo (Ingenia). Perfusion parametric maps of DSC were generated with leakage correction, model-independent deconvolution, and normalization, whereas the extended Toft’s model was used for the DCE analysis.
From the semiautomatically segmented entire tumor on the single representative axial image, histogram analyses of relative cerebral blood volume (rCBV), volume transfer constant (Ktrans), and ADC were separately performed. The choline-to-creatinine ratio (Cho/Cr) was calculated using MRS. Univariate and multivariate logistic regression analyses were performed to differentiate LGGs (grade I and II) from HGGs (grade III and IV). The areas under the receiver operating characteristics curves (AUROC) were plotted and compared using DeLong’s test. Pairwise Spearman’s correlation coefficients (ρ) were computed among the parameters. K-means clustering was performed between the 95th percentiles of rCBV and Ktrans.
Results
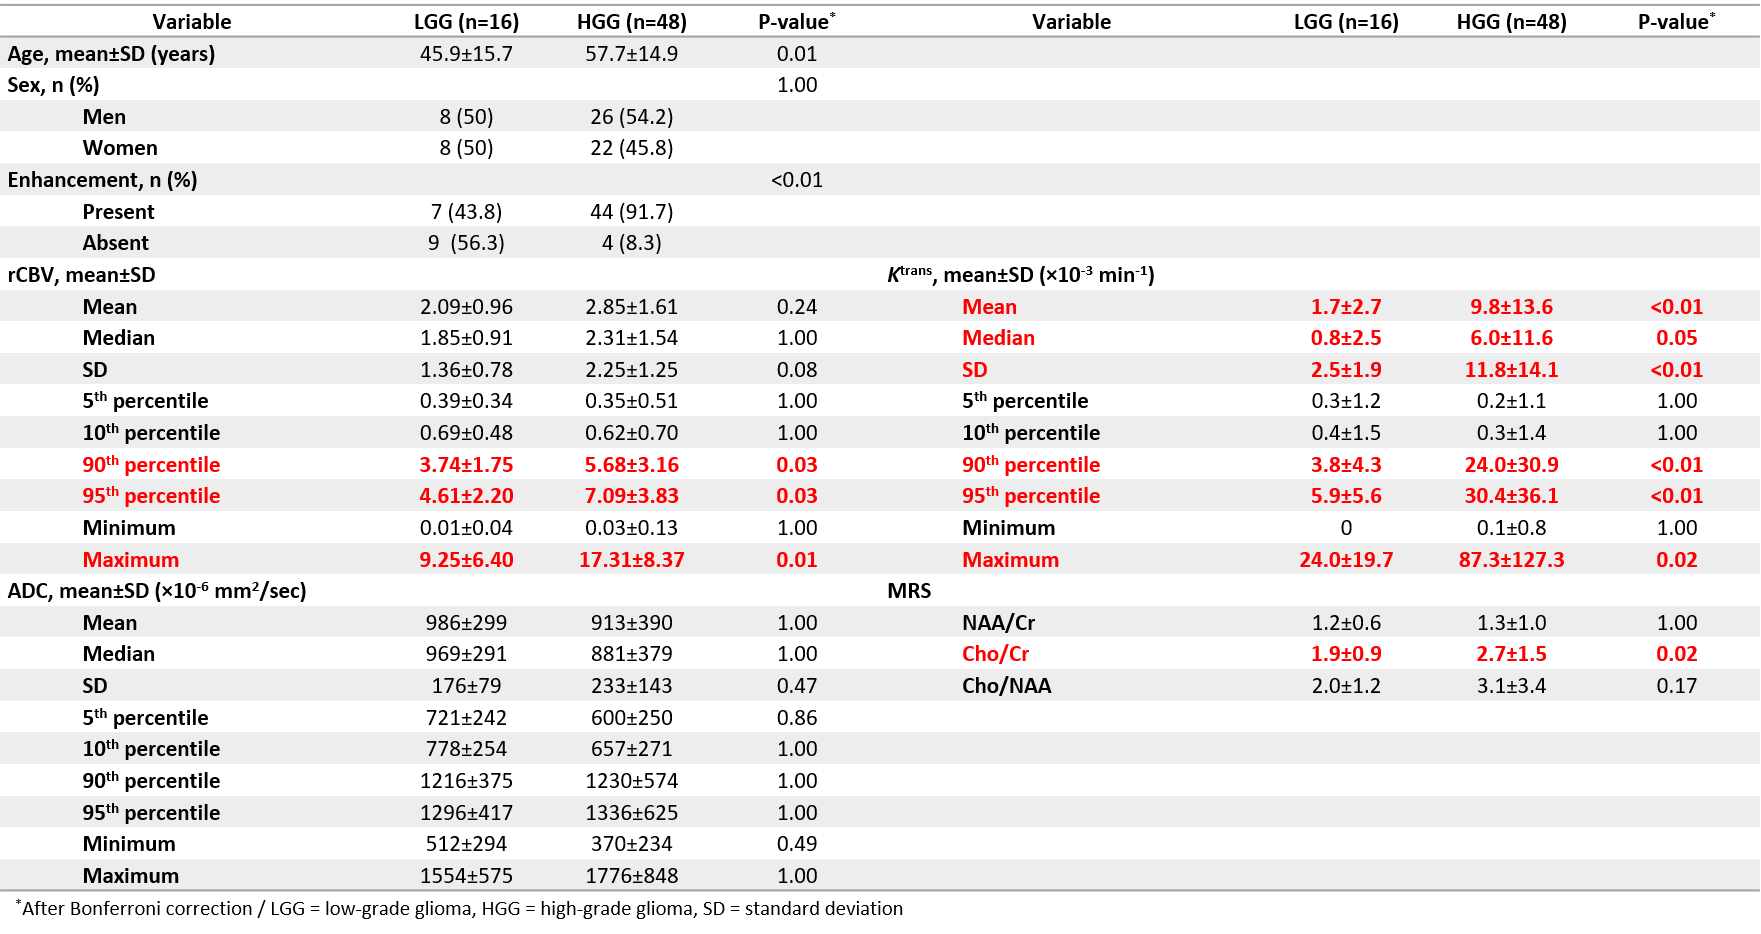
HGGs had significantly higher 95th percentile rCBV, Ktrans (P<0.01) and Cho/Cr (P=0.02) than LGGs (Figure 1). The process of multiparametric histogram analysis of three illustrative cases are demonstrated in Figure 2 and 3.To assess the diagnostic performance of each MR parameter, we calculated AUROC, sensitivity, specificity, PPV, and NPV (Figure 4). Among these parameters, the 95th percentile Ktrans showed the highest AUROC value (0.83), followed by the 95th percentile rCBV (0.72), the Cho/Cr (0.67), and the 5th percentile ADC (0.64), with no significant difference in DeLong’s test. All parameters showed higher NPVs than PPVs.
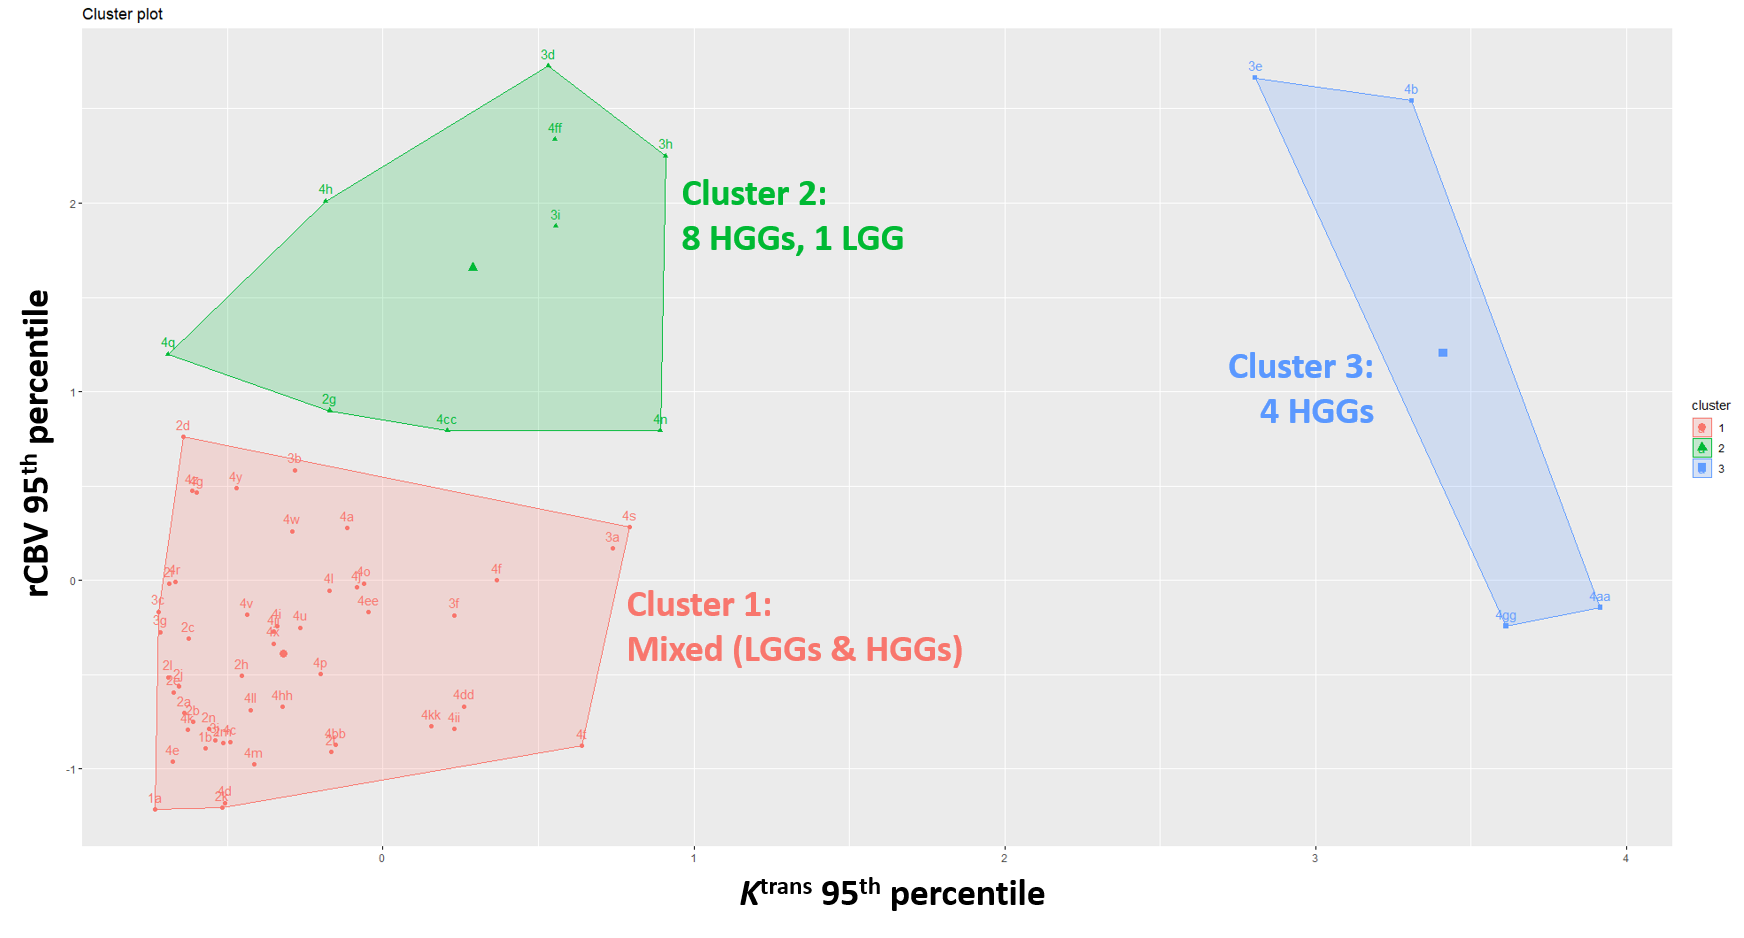
Significant correlations were observed between the 95th percentile rCBV and Ktrans (ρ=0.44), Cho/Cr (ρ=0.36), and 5th percentile ADC (ρ=-0.35) (all P<0.01). The K-means cluster plot shows two HGG-predominant clusters with high Ktrans or high rCBV, and one cluster with low Ktrans and rCBV consisting of mixed HGGs and LGGs (Figure 5).
Discussion
Among the parameters from various advanced MR techniques, Ktrans 95th percentile showed the highest AUROC, followed by rCBV 95th percentile, Cho/Cr, and ADC 5th percentile. In the correlation analysis, rCBV showed significant correlations with the other three parameters. One recent meta-analysis demonstrated pooled AUROC values of 0.93 and 0.90 for rCBV and Ktrans in glioma grading, respectively.6 While some studies also reported that rCBV is more useful than Ktrans,12 some other studies showed the opposite result, same as our study.13 Elevated choline levels were also helpful for glioma grading, consistent to prior studies,14,15 but ADC did not significantly differ between LGGs and HGGs.Some studies have reported a correlation between rCBV and Ktrans or the permeability-surface area product, which may suggest an abundance of leakage-prone vasculature in gliomas with prominent angiogenesis.16,17 Consistent with these results, we observed a significant correlation between rCBV and Ktrans in our study. As shown in Figure 5, HGGs with high Ktrans or rCBV were well clustered, whereas LGGs and HGGs in the mixed cluster with low Ktrans and rCBV were difficult to differentiate. Two components (tumor enhancement and molecular subtype) may partly explain this cluster distribution. Non-enhancing HGGs showed lower Ktrans and rCBV than the entire HGG group. Similarly, IDH-mutant glioblastomas and H3K27M-mutant diffuse midline gliomas were not present in the cluster 2 and 3 of Figure 5 and showed lower Ktrans and rCBV than IDH-wildtype GBMs. Similar tendency was also reported by previous studies.18–20
Conclusions
Ktrans may be the most helpful parameter for discriminating LGGs from HGGs with a high NPV. Relative CBV significantly correlated with Ktrans, Cho/Cr, and ADC. Our findings demonstrate higher diagnostic utility of DCE and DSC in glioma grading.Acknowledgements
No acknowledgement found.References
1. Goodenberger ML, Jenkins RB. Genetics of adult glioma. Cancer Genet 2012;205:613–21.
2. Louis DN, Perry A, Reifenberger G, et al. The 2016 World Health Organization Classification of Tumors of the Central Nervous System: a summary. Acta Neuropathol 2016;131:803–20.
3. Tonn JC, Westphal M, Rutka JT. Oncology of CNS Tumors. (Tonn J-C, Westphal M, Rutka JT, eds.). Berlin, Heidelberg: Springer Berlin Heidelberg; 2010.
4. You SH, Choi SH, Kim TM, et al. Differentiation of high-grade from low-grade astrocytoma: improvement in diagnostic accuracy and reliability of pharmacokinetic parameters from DCE MR imaging by using arterial input functions obtained from DSC MR imaging. Radiology 2018;286:981–91.
5. Jung SC, Yeom JA, Kim J-H, et al. Glioma: Application of Histogram Analysis of Pharmacokinetic Parameters from T1-Weighted Dynamic Contrast-Enhanced MR Imaging to Tumor Grading. Am J Neuroradiol 2014;35:1103–10.
6. Liang J, Liu D, Gao P, et al. Diagnostic Values of DCE-MRI and DSC-MRI for Differentiation Between High-grade and Low-grade Gliomas: A Comprehensive Meta-analysis. Acad Radiol 2018;25:338–48.
7. Toyooka M, Kimura H, Uematsu H, et al. Tissue characterization of glioma by proton magnetic resonance spectroscopy and perfusion-weighted magnetic resonance imaging: glioma grading and histological correlation. Clin Imaging 2008;32:251–8.
8. Bulik M, Jancalek R, Vanicek J, et al. Potential of MR spectroscopy for assessment of glioma grading. Clin Neurol Neurosurg 2013;115:146–53.
9. Kang Y, Choi SH, Kim Y-J, et al. Gliomas: Histogram Analysis of Apparent Diffusion Coefficient Maps with Standard- or High- b -Value Diffusion-weighted MR Imaging—Correlation with Tumor Grade. Radiology 2011;261:882–90.
10. Lee HY, Na DG, Song I-C, et al. Diffusion-Tensor Imaging for Glioma Grading at 3-T Magnetic Resonance Imaging. J Comput Assist Tomogr 2008;32:298–303.
11. Louis DN, Perry A, Wesseling P, et al. The 2021 WHO classification of tumors of the central nervous system: A summary. Neuro Oncol 2021;23:1231–51.
12. Falk A, Fahlström M, Rostrup E, et al. Discrimination between glioma grades II and III in suspected low-grade gliomas using dynamic contrast-enhanced and dynamic susceptibility contrast perfusion MR imaging: a histogram analysis approach. Neuroradiology 2014;56:1031–8.
13. Santarosa C, Castellano A, Conte GM, et al. Dynamic contrast-enhanced and dynamic susceptibility contrast perfusion MR imaging for glioma grading: Preliminary comparison of vessel compartment and permeability parameters using hotspot and histogram analysis. Eur J Radiol 2016;85:1147–56.
14. Howe FA, Barton SJ, Cudlip SA, et al. Metabolic profiles of human brain tumors using quantitative in vivo1H magnetic resonance spectroscopy. Magn Reson Med 2003;49:223–32.
15. Shimizu H, Kumabe T, Shirane R, et al. Correlation between choline level measured by proton MR spectroscopy and Ki-67 labeling index in gliomas. AJNR Am J Neuroradiol 2000;21:659–65.
16. Patankar TF, Haroon HA, Mills SJ, et al. Is volume transfer coefficient (Ktrans) related to histologic grade in human gliomas? Am J Neuroradiol 2005;26:2455–65.
17. Jain R, Griffith B, Alotaibi F, et al. Glioma angiogenesis and perfusion imaging: Understanding the relationship between tumor blood volume and leakiness with increasing glioma grade. Am J Neuroradiol 2015;36:2030–5.
18. Suh CH, Kim HS, Jung SC, et al. Imaging prediction of isocitrate dehydrogenase (IDH) mutation in patients with glioma: a systemic review and meta-analysis. Eur Radiol 2019;29:745–58.
19. Calmon R, Dangouloff-Ros V, Varlet P, et al. Radiogenomics of diffuse intrinsic pontine gliomas (DIPGs): correlation of histological and biological characteristics with multimodal MRI features. Eur Radiol 2021;31:8913–24.
20. Kurokawa R, Kurokawa M, Baba A, et al. Dynamic susceptibility contrast-MRI parameters, ADC values, and the T2-FLAIR mismatch sign are useful to differentiate between H3-mutant and H3-wild-type high-grade midline glioma. Eur Radiol 2022;32:3672–82.
Figures
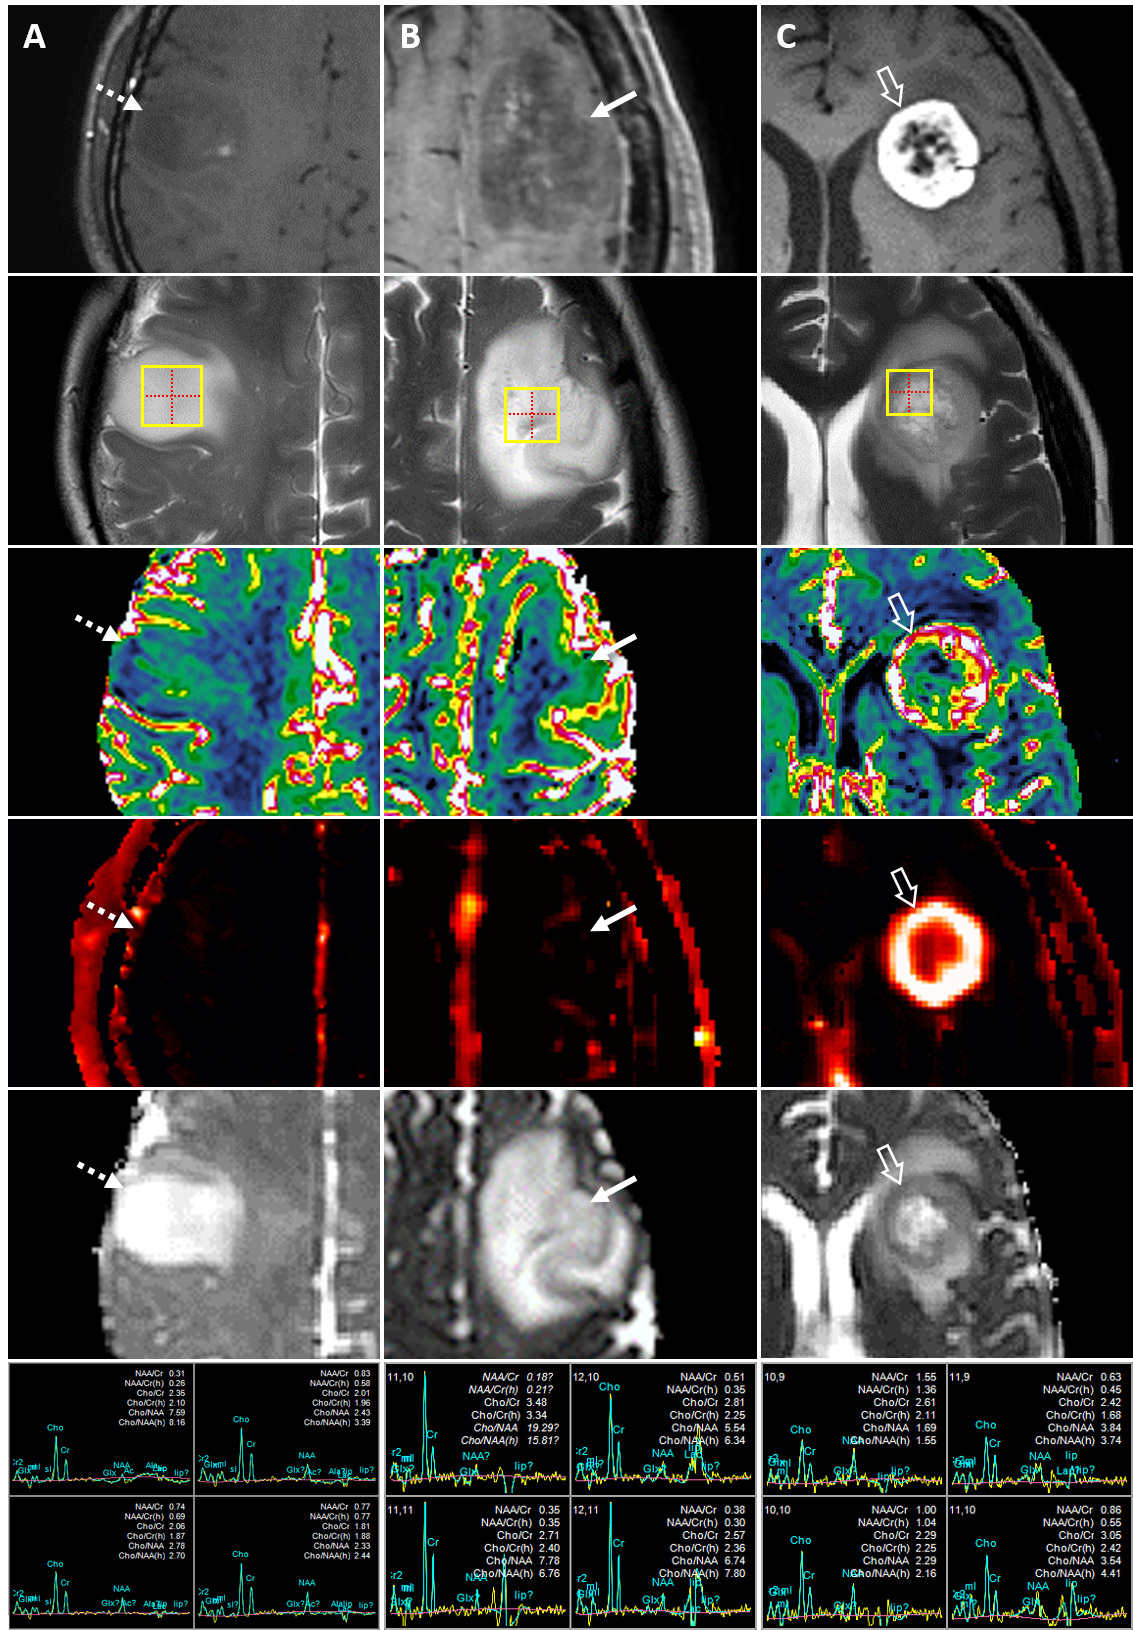
Example MRI of grade II and IV gliomas.
(A) Grade II, F/41
(diffuse astrocytoma, IDH-mutant, dashed arrow):
contrast-enhanced T1WI, T2WI, DSC (rCBV), DCE (Ktrans), ADC, MRS;
(B) Grade IV, F/55
(glioblastoma, IDH-mutant, solid arrow):
contrast-enhanced T1WI, T2WI, DSC (rCBV), DCE (Ktrans), ADC, MRS;
(C) Grade IV, F/48
(glioblastoma, IDH-wildtype, hollow arrow):
contrast-enhanced T1WI, T2WI, DSC (rCBV), DCE (Ktrans), ADC, MRS
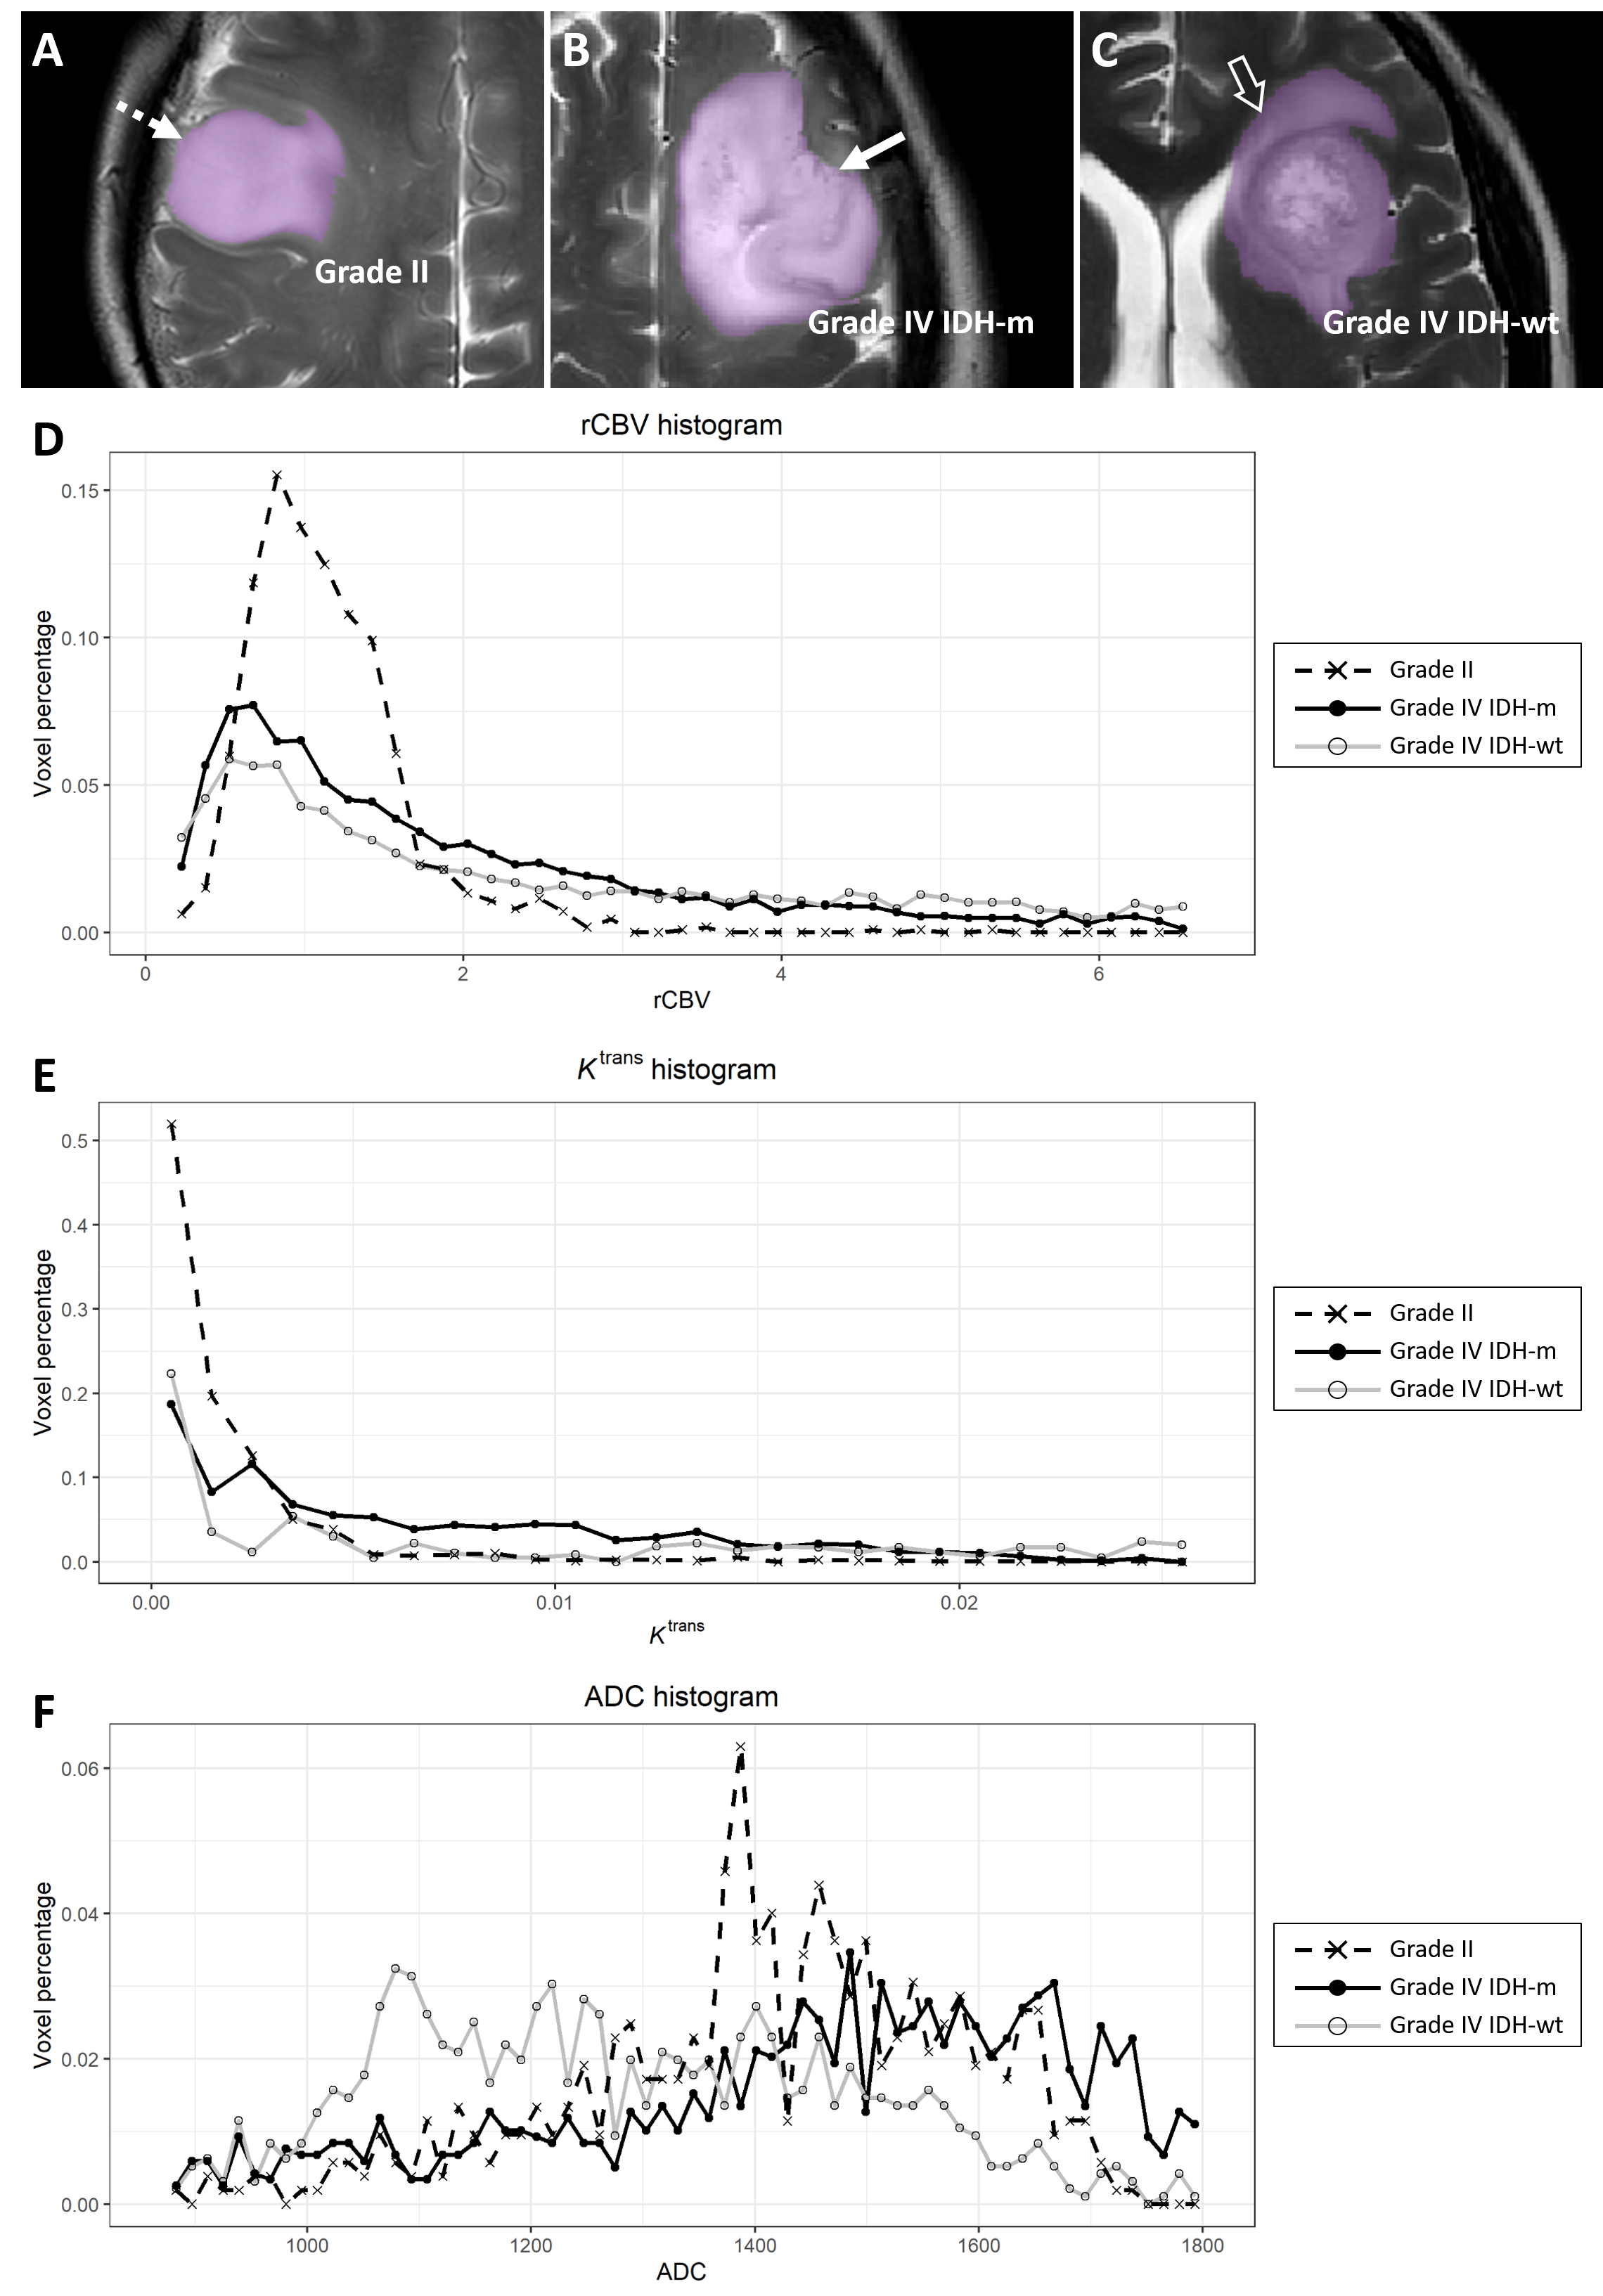
(A, B, C) Segmentation masks (purple) of the three representative cases of low-grade and high-grade gliomas (same patients as in Figure 2).
(D, E, F) Histograms of rCBV, Ktrans (min-1), and 5th percentile
ADC (×10-6 mm2/sec) for each tumor.
(D) 95th
percentile rCBV: IDH-wildtype GBM 9.36, IDH-mutant GBM 4.65, grade II lesion 2.08;
(E) 95th
percentile Ktrans: IDH-wildtype GBM 0.054, IDH-mutant GBM 0.018, grade II lesion 0.0072;
(F) 5th
percentile ADC: IDH-wildtype GBM 829, IDH-mutant GBM 913, grade II lesion 1,082
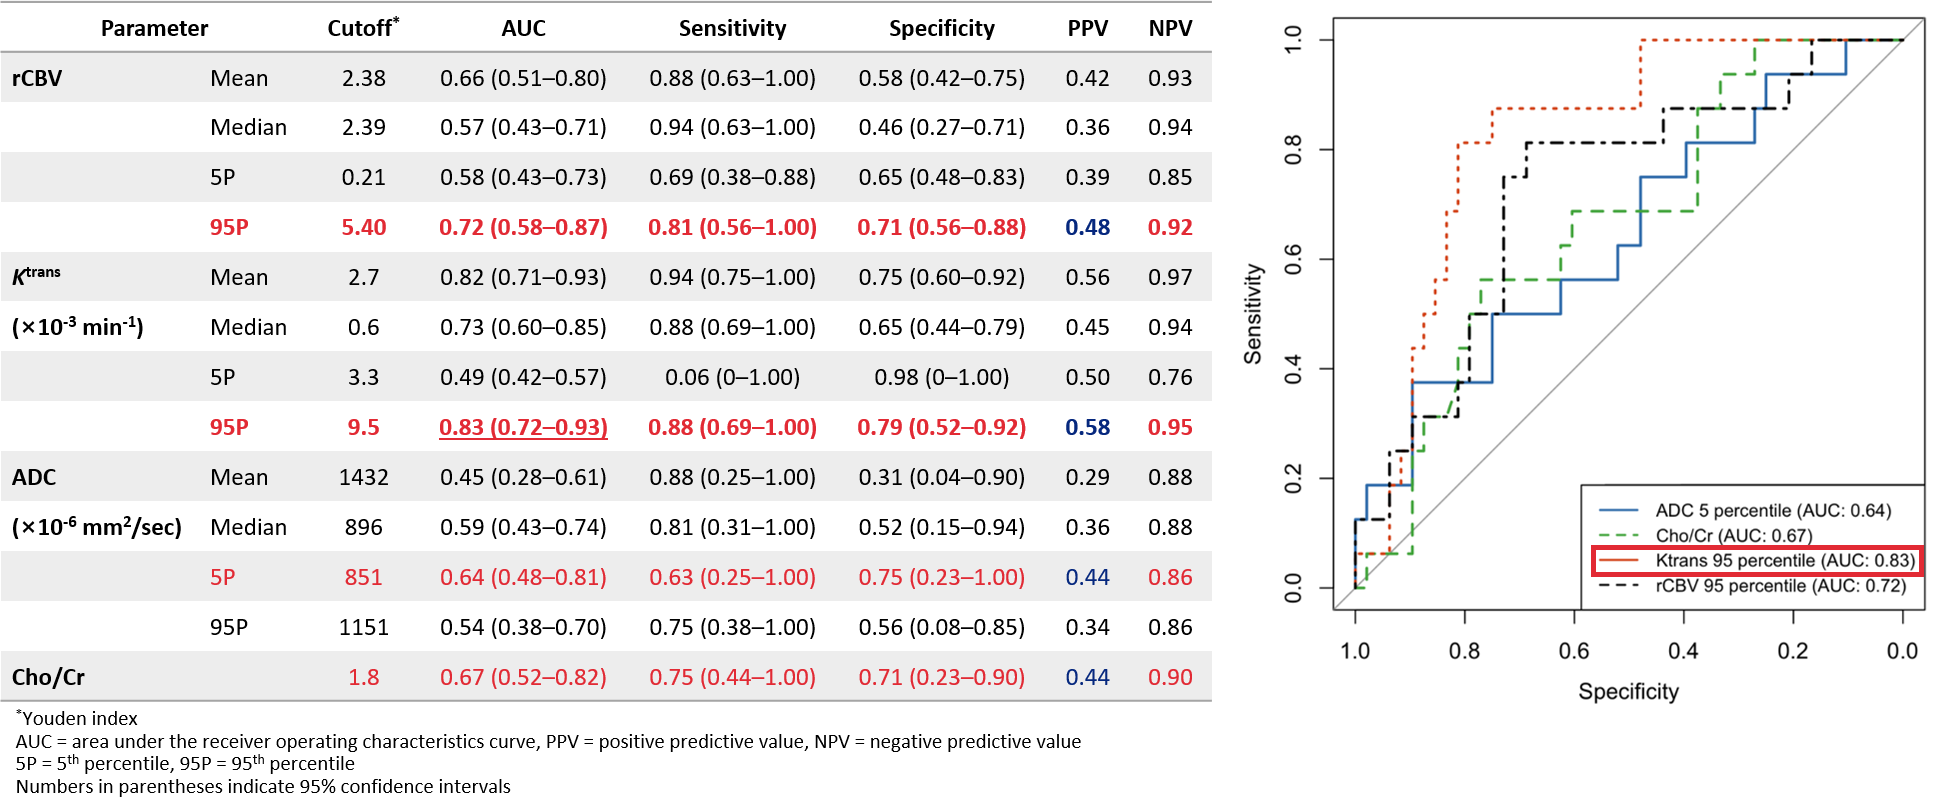
(Left) A table showing diagnostic performance of multiparametric MR sequences.
(Right) Receiver operating characteristics curves of multiparametric MR sequences in differentiating high-grade from low-grade gliomas.