1965
Histogram analysis based on T2 mapping can predict the molecular markers in meningiomas1Department of Magnetic Resonance Imaging, the First Affiliated Hospital of Zhengzhou University, Zhengzhou, China, 2Department of Electronic Science, Xiamen University, Xiamen, China, 3Department of Imaging Sciences, University of Rochester, Rochester, NY, United States
Synopsis
Keywords: Tumors, Relaxometry
There is an immediate need for neurosurgeons to be able to identify certain molecular markers’ status of meningioma preoperatively, such as progesterone receptors and S100. In this study, we explored the use of histogram analysis of T2 maps and ADC maps in predicting such molecular markers. T2 maps and ADC maps could serve as useful tools for predicting PR and S100 status of meningiomas. Similar studies may be extended to investigate other pathological markers.
Introduction
Some molecular markers may play an important role in the diagnosis and treatment of meningiomas. Progesterone receptors (PR) are widely expressed in meningiomas, with the positive rate as high as to be 75%1. A possible association between PR and malignancy, cell proliferation, recurrence and progression of meningioma has been reported2,3. In addition, the S100 protein profile, which is one of the popular immunohistochemistry markers, is related to tumor progression and can be distinctive regarding diagnosis, prognosis and drug response4. The status of PR and S100 currently can only be determined by postoperative pathology, so there is an unmet clinical need for a reliable preoperative predictor. Recently, a whole new deep learning-based single-shot quantitative T2 technology has been proposed and demonstrated satisfactory consistency previously5, which can generate whole brain T2 mapping within 12 seconds. In addition, the apparent diffusion coefficient (ADC) map generated from diffusion weighted imaging (DWI) could also serve as a useful indicator in meningioma studies6.Method
A total of 65 patients (19 male/46 female, mean age=57.60±9.55, PR: 52 positive/13 negative, S100: 20 positive/31 negative) with surgically and pathologically confirmed meningiomas have been enrolled into our study. All patients underwent preoperative MRI examination at a 3.0 T scanner (MAGNETOM Prisma, Siemens Healthcare, Erlangen, Germany) with an integrated 64-channel head and neck coil. The sequences used in this study include axial T2 fluid attenuated inversion recovery imaging (TR=6500 ms, TE=85 ms, acquisition time=1 minutes 18 seconds), diffusion-weighted imaging (TR=4600 ms, TE=80 ms, acquisition time=41 seconds), contrast-enhanced (Magnevist, gadopentetate dimeglumine) T1-weighted imaging (TR=220 ms, TE=2.46 ms, acquisition time=28 seconds), and axial single-shot T2 mapping (TR=8000/3000/3000/3000 ms, TE=66/400/600/800 ms, acquisition time=32 seconds). MRI pulse sequence diagram of the single-shot T2 mapping was shown in Figure 1. Immunohistochemistry analysis using anti-S100 antibody and anti-PR body were performed on all surgically resected specimens for histological grading and PR, S100 status, which were finally divided into positive or negative by an experienced pathologist. Two independent neuroradiologists (with 5 years’ and 10 years’ experience of neurological imaging, respectively) manually delineated polygonal region of interest (ROI) on each slice to acquire the whole lesion measurements using 3D Slicer (version 4.10.2, www.slicer.org), with the final results relied on their consensus7. ROI was defined by solid tumor components that were significantly enhanced on CE-T1WI, while large vessels, cysts and necrosis were excluded. Finally, the histogram parameters within each ROI were extracted with FeAture Explorer (FAE; https://github.com/salan668/ FAE). All the metrics are listed as follows: mean, median, maximum, minimum, 10 percentiles (P10), 90 percentiles (P90), interquartile range (IQR), range; entropy, skewness, kurtosis, uniformity and variance. We verified the data distribution using the Shapiro-Wilk test. Then the independent t-test or Mann-Whitney U test was used to compare the histogram parameters based on the data distribution. We then performed the receiver operating characteristic (ROC) analysis for all statistically significant histogram parameters. Moreover, parameters with the best predictive performance were screened to construct a binary logistic regression model to get a combined index, which also underwent ROC analysis. The corresponding area under the ROC curves (AUCs) with 95% confidence interval (CI) and the optimal cut-off values were subsequently calculated. Delong test was used for the comparison of AUCs. A value of p<0.05 was considered to be the significance level. Representative patients are shown in Figure 2.Result
Although ADC appeared to have low predictive power in identifying PR status, we found significantly higher IQR, mean, median, maximum, P90, range and variance based on T2 maps in PR positive group (PR+) than those in PR negative group (PR-) (p=0.008-0.046). In particular, T2 IQR was the parameter with the most significant difference (p=0.008), as shown in Figure 3A. Meanwhile, diagnostic performance of all statistically significant parameters and the combined index were listed in Table 1. The combination of T2 IQR and ADC range received an AUC of 0.760, which was higher than any single parameter.Maximum, range and variance based on T2 maps were significantly higher in S100 negative group (S100-) than S100 positive (S100+) (p=0.011-0.033). Moreover, higher IQR, maximum, entropy and lower uniformity based on ADC maps were found in S100- (p=0.019-0.032). As shown in Figure 3B and 3C, T2 range and ADC entropy were the most statistically different parameters (p=0.011 and 0.019, respectively). In addition, diagnostic performance of all statistically significant parameters and the combined index were listed in Table 2. Not surprisingly, we find that T2 maps have better diagnostic performance compared to ADC maps. And the combination of T2 range and ADC IQR received an AUC of 0.788, which was higher than other parameters.
Discussion and Conclusion
Results from this study indicated that T2 mapping could effectively differentiate PR and S100 status. PR+ and S100- meningiomas tend to have higher T2 relaxation time and more heterogeneity. Additionally, ADC plays an important role in differentiating S100 status as well. The highest distinctive power for PR status was obtained with the combination of T2 IQR and ADC range. And the highest distinctive power for S100 status was obtained with the combination of T2 range and ADC IQR.Acknowledgements
No acknowledgement found.References
1. Verheijen F M, Sprong M, Jacobs H M, et al. Progesterone receptor isoform expression in human meningiomas. European Journal of Cancer, 2001, 37(12): 1488–1495.
2. Maiuri F, Mariniello G, Guadagno E, et al. WHO grade, proliferation index, and progesterone receptor expression are different according to the location of meningioma. Acta neurochirurgica, 2019, 161(12): 2553–2561.
3. Telugu R B, Chowhan A K, Rukmangadha N, et al. Estrogen and progesterone receptor in meningiomas: An immunohistochemical analysis. Journal of cancer research and therapeutics, 2020, 16(6): 1482–1487.
4. Bresnick A R, Weber D J, Zimmer D B. S100 proteins in cancer. Nat Rev Cancer, 2015, 15(2): 96-109.
5. Zhang J, Wu J, Chen S, et al. Robust Single-Shot T2 Mapping via Multiple Overlapping-Echo Acquisition and Deep Neural Network. IEEE transactions on medical imaging, 2019, 38(8): 1801–1811.
6. Lu Y, Liu L, Luan S, et al. The diagnostic value of texture analysis in predicting WHO grades of meningiomas based on ADC maps: an attempt using decision tree and decision forest. European radiology, 2019, 29(3): 1318–1328.
7. Cao T, Jiang R, Zheng L, et al. T1 and ADC histogram parameters may be an in vivo biomarker for predicting the grade, subtype, and proliferative activity of meningioma. European Radiology, 2022.
Figures
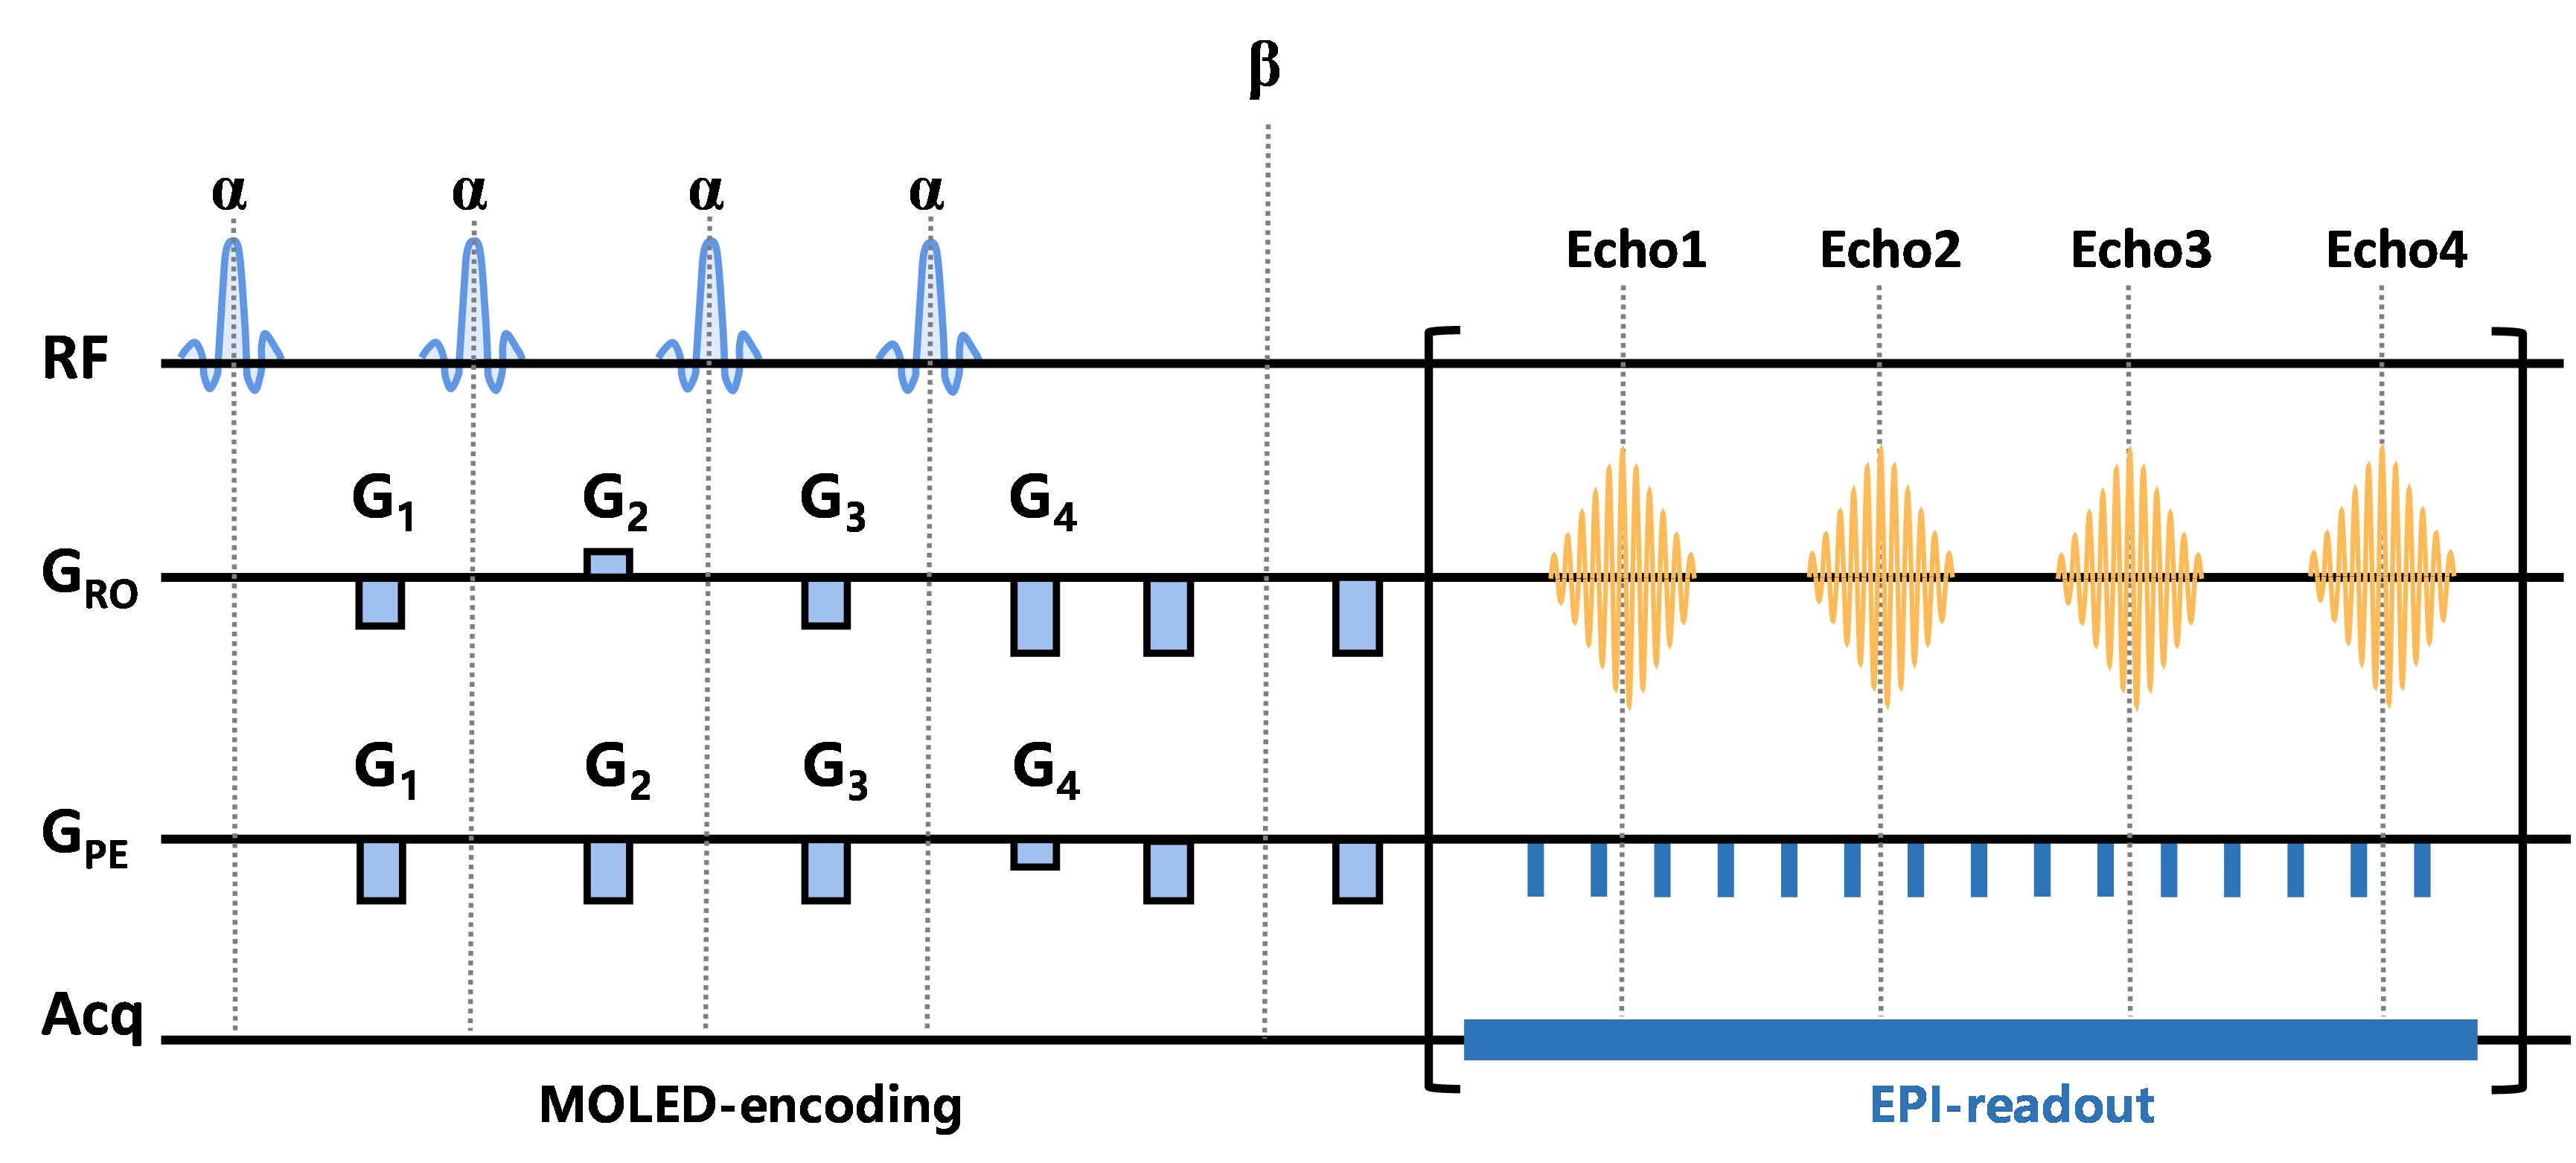
Figure 1 MRI pulse sequence diagram of the single-shot T2 mapping.
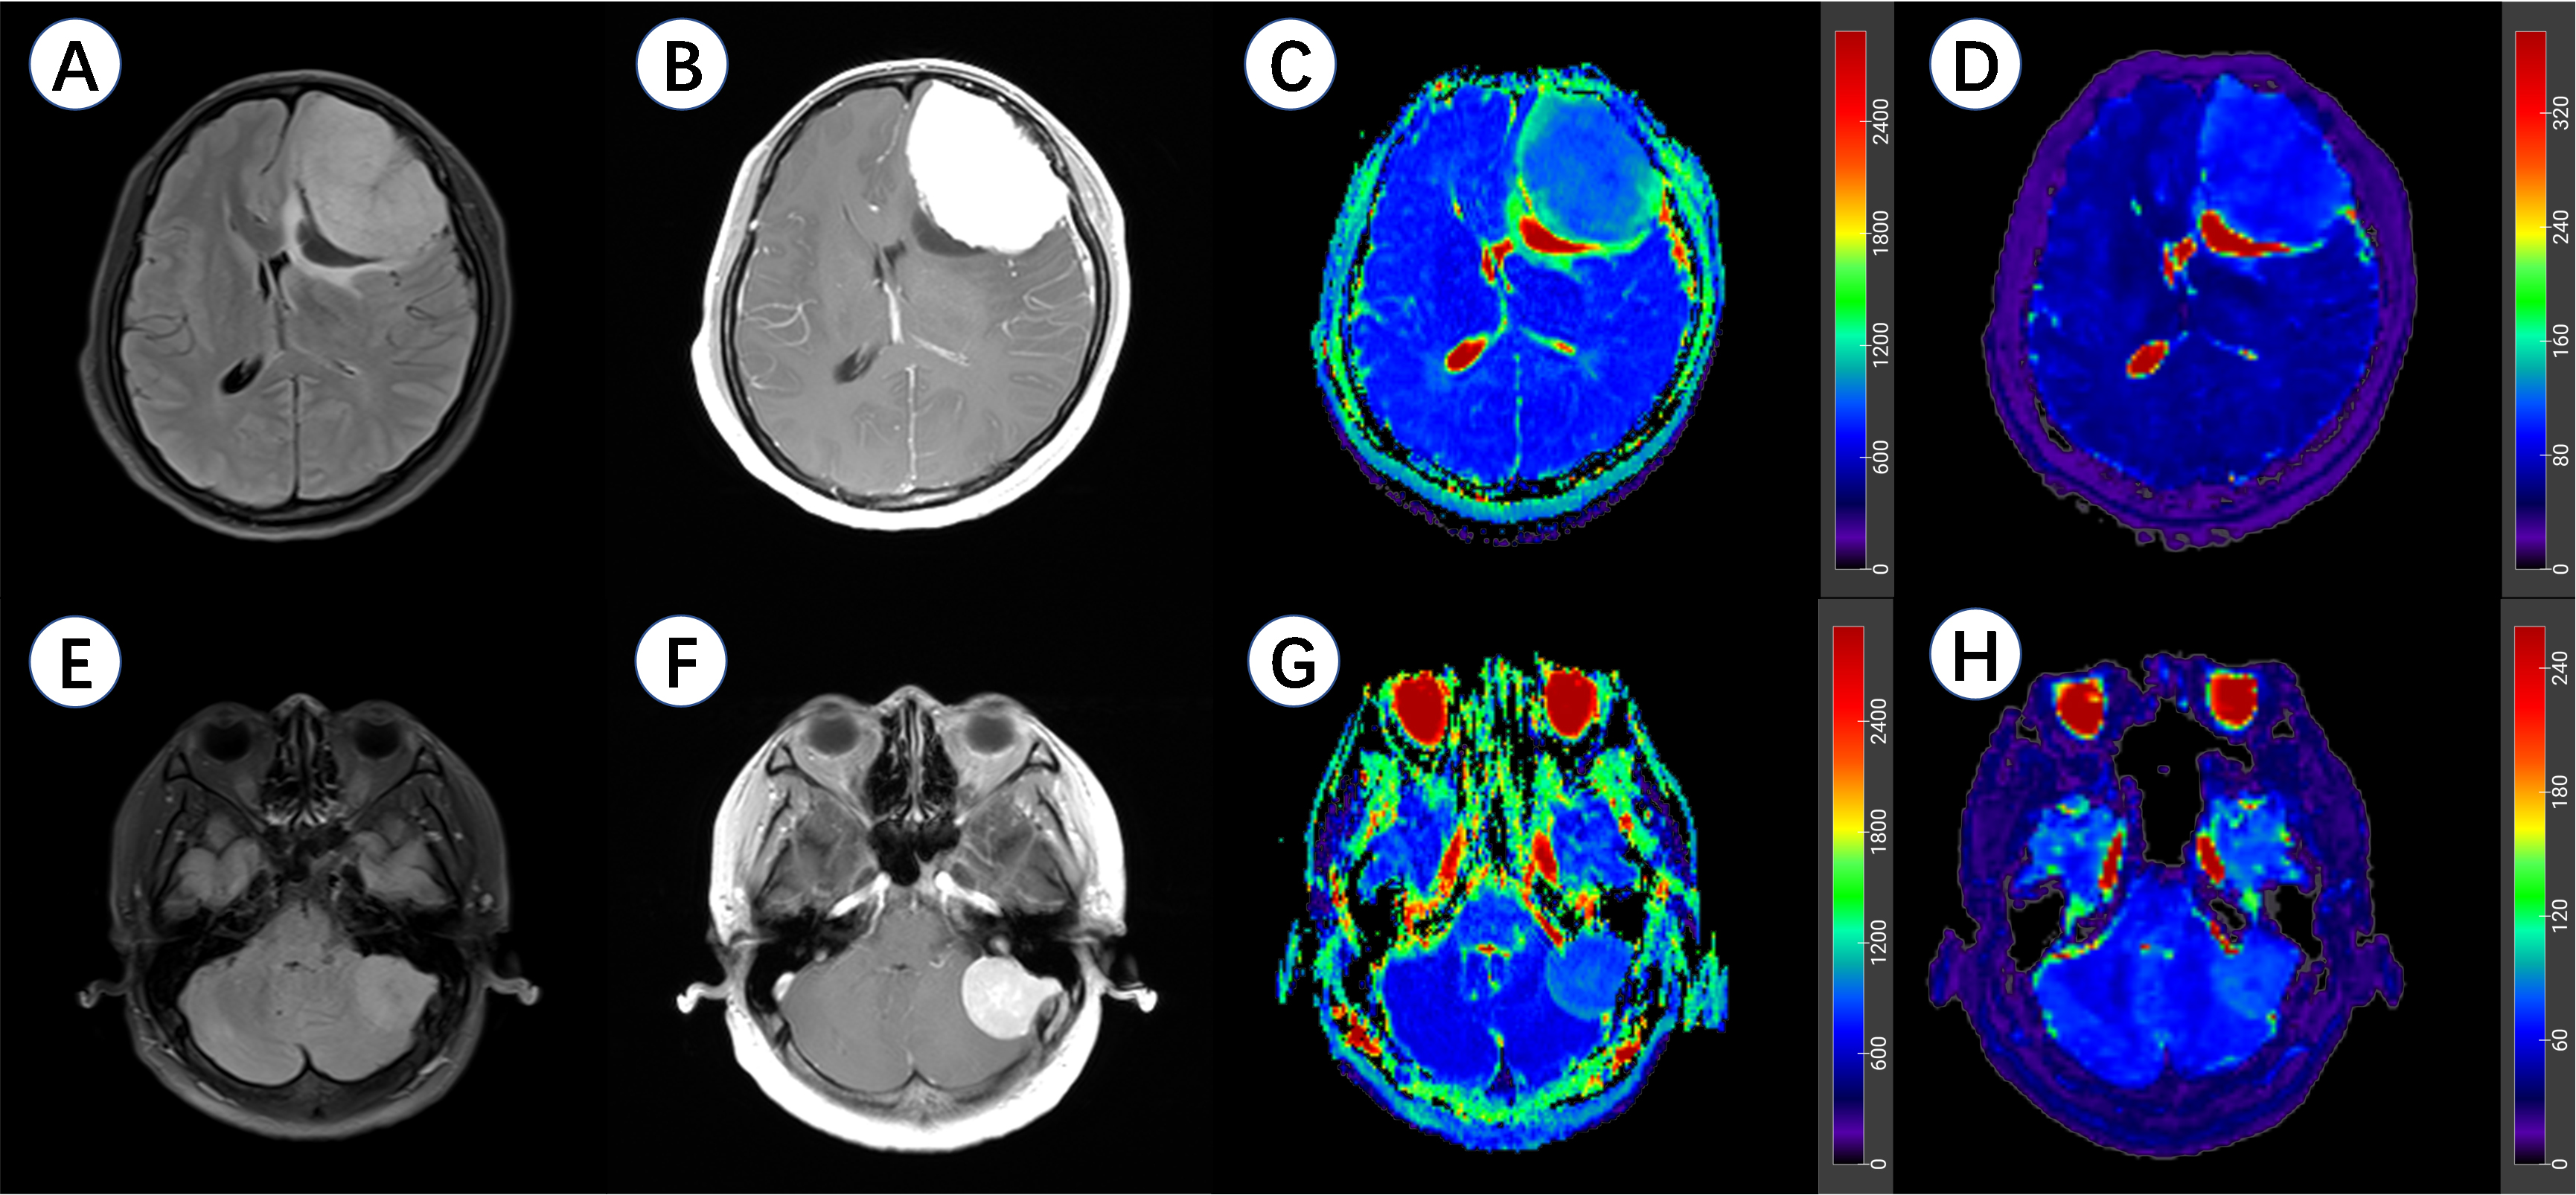
Figure 2 Representative meningioma patients in this study.
A-D, a 37-year-old female patient with a left frontal lobe PR (+) and S100 (-) meningioma. A, axial T2 fluid attenuated inversion recovery imaging (T2 FLAIR); B, contrast-enhanced T1-weighted imaging (CE-T1WI); C, apparent diffusion coefficient (ADC) maps; D, T2 maps.
E-H, a 54-year-old female patient with a left cerebellopontine angle area PR (-) and S100 (+) meningioma. E, axial T2 FLAIR; F, CE-T1WI; G, ADC maps; H, T2 maps.
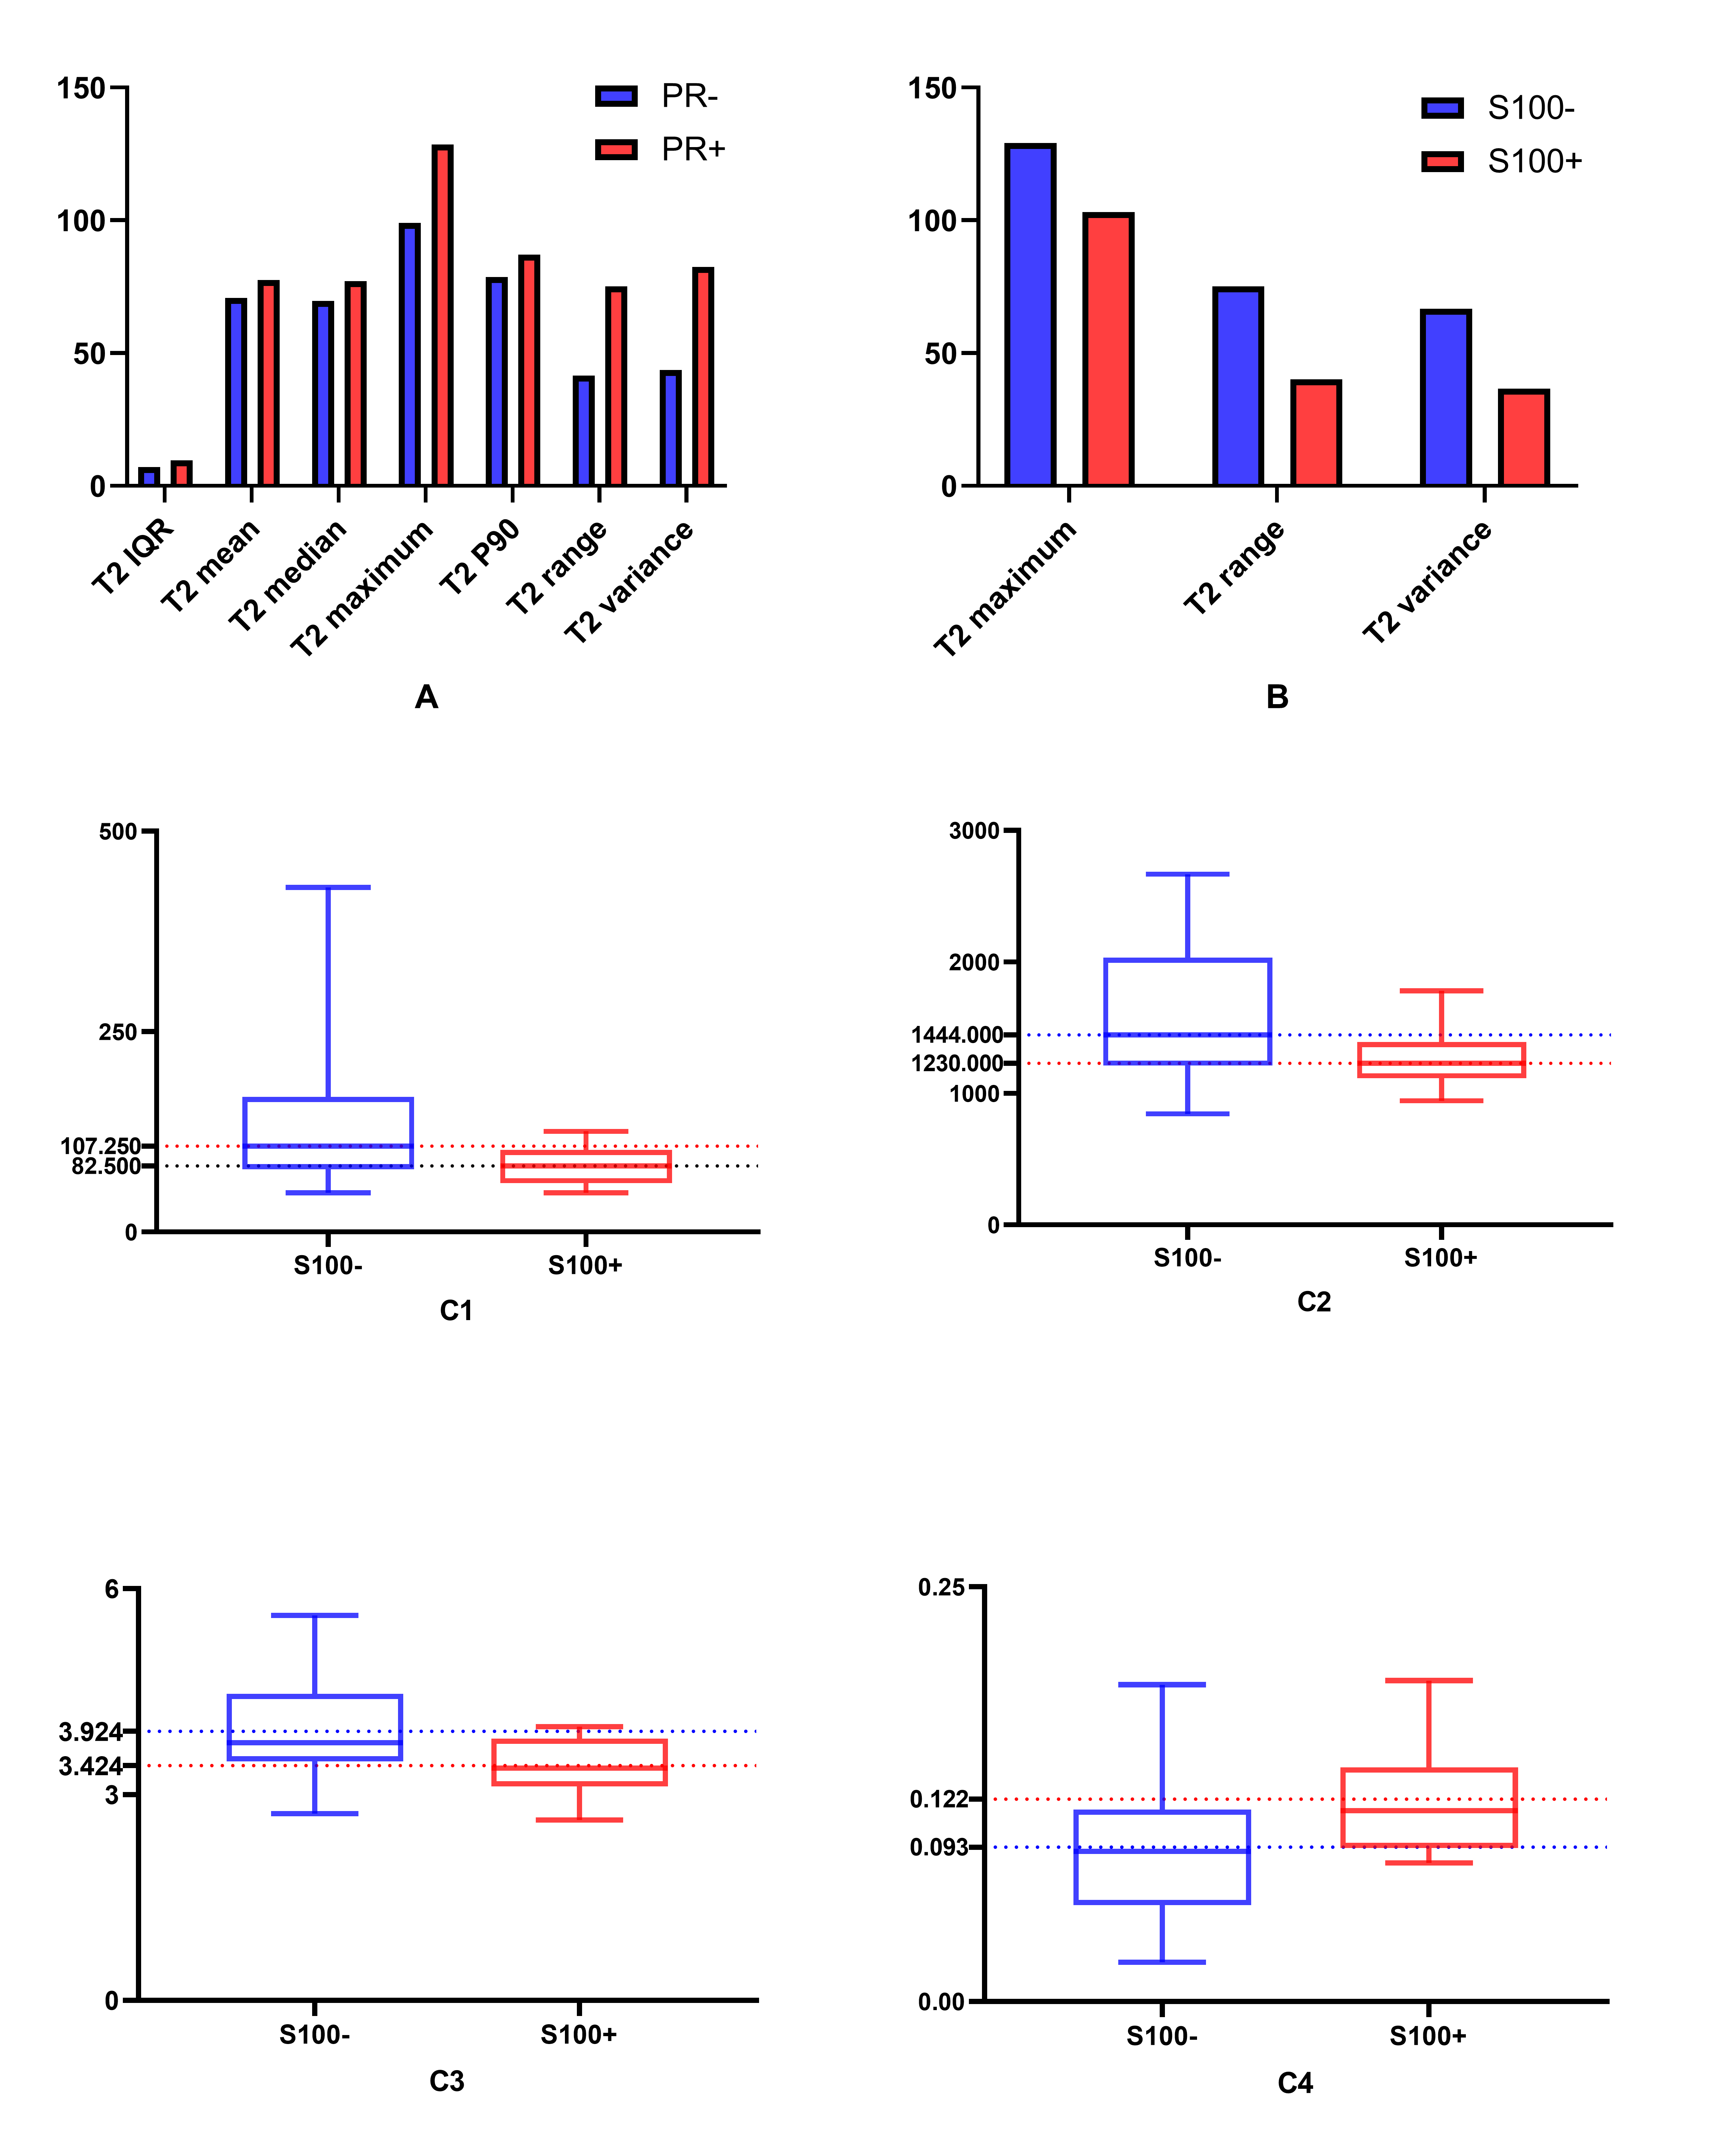
Figure 3 The histogram maps of parameters based on apparent diffusion coefficient (ADC) maps and T2 maps for the differentiation of progesterone receptor (PR) and S100 status.
A, differences of histogram parameters based on T2 maps between PR- and PR+; B, differences of histogram parameters based on T2 maps between S100- and S100+; C, differences of histogram parameters based on ADC maps between S100- and S100+: C1, ADC Interquartile range (IQR); C2, ADC maximum; C3, ADC entropy; C4, ADC uniformity.
P10, 10 percentiles.
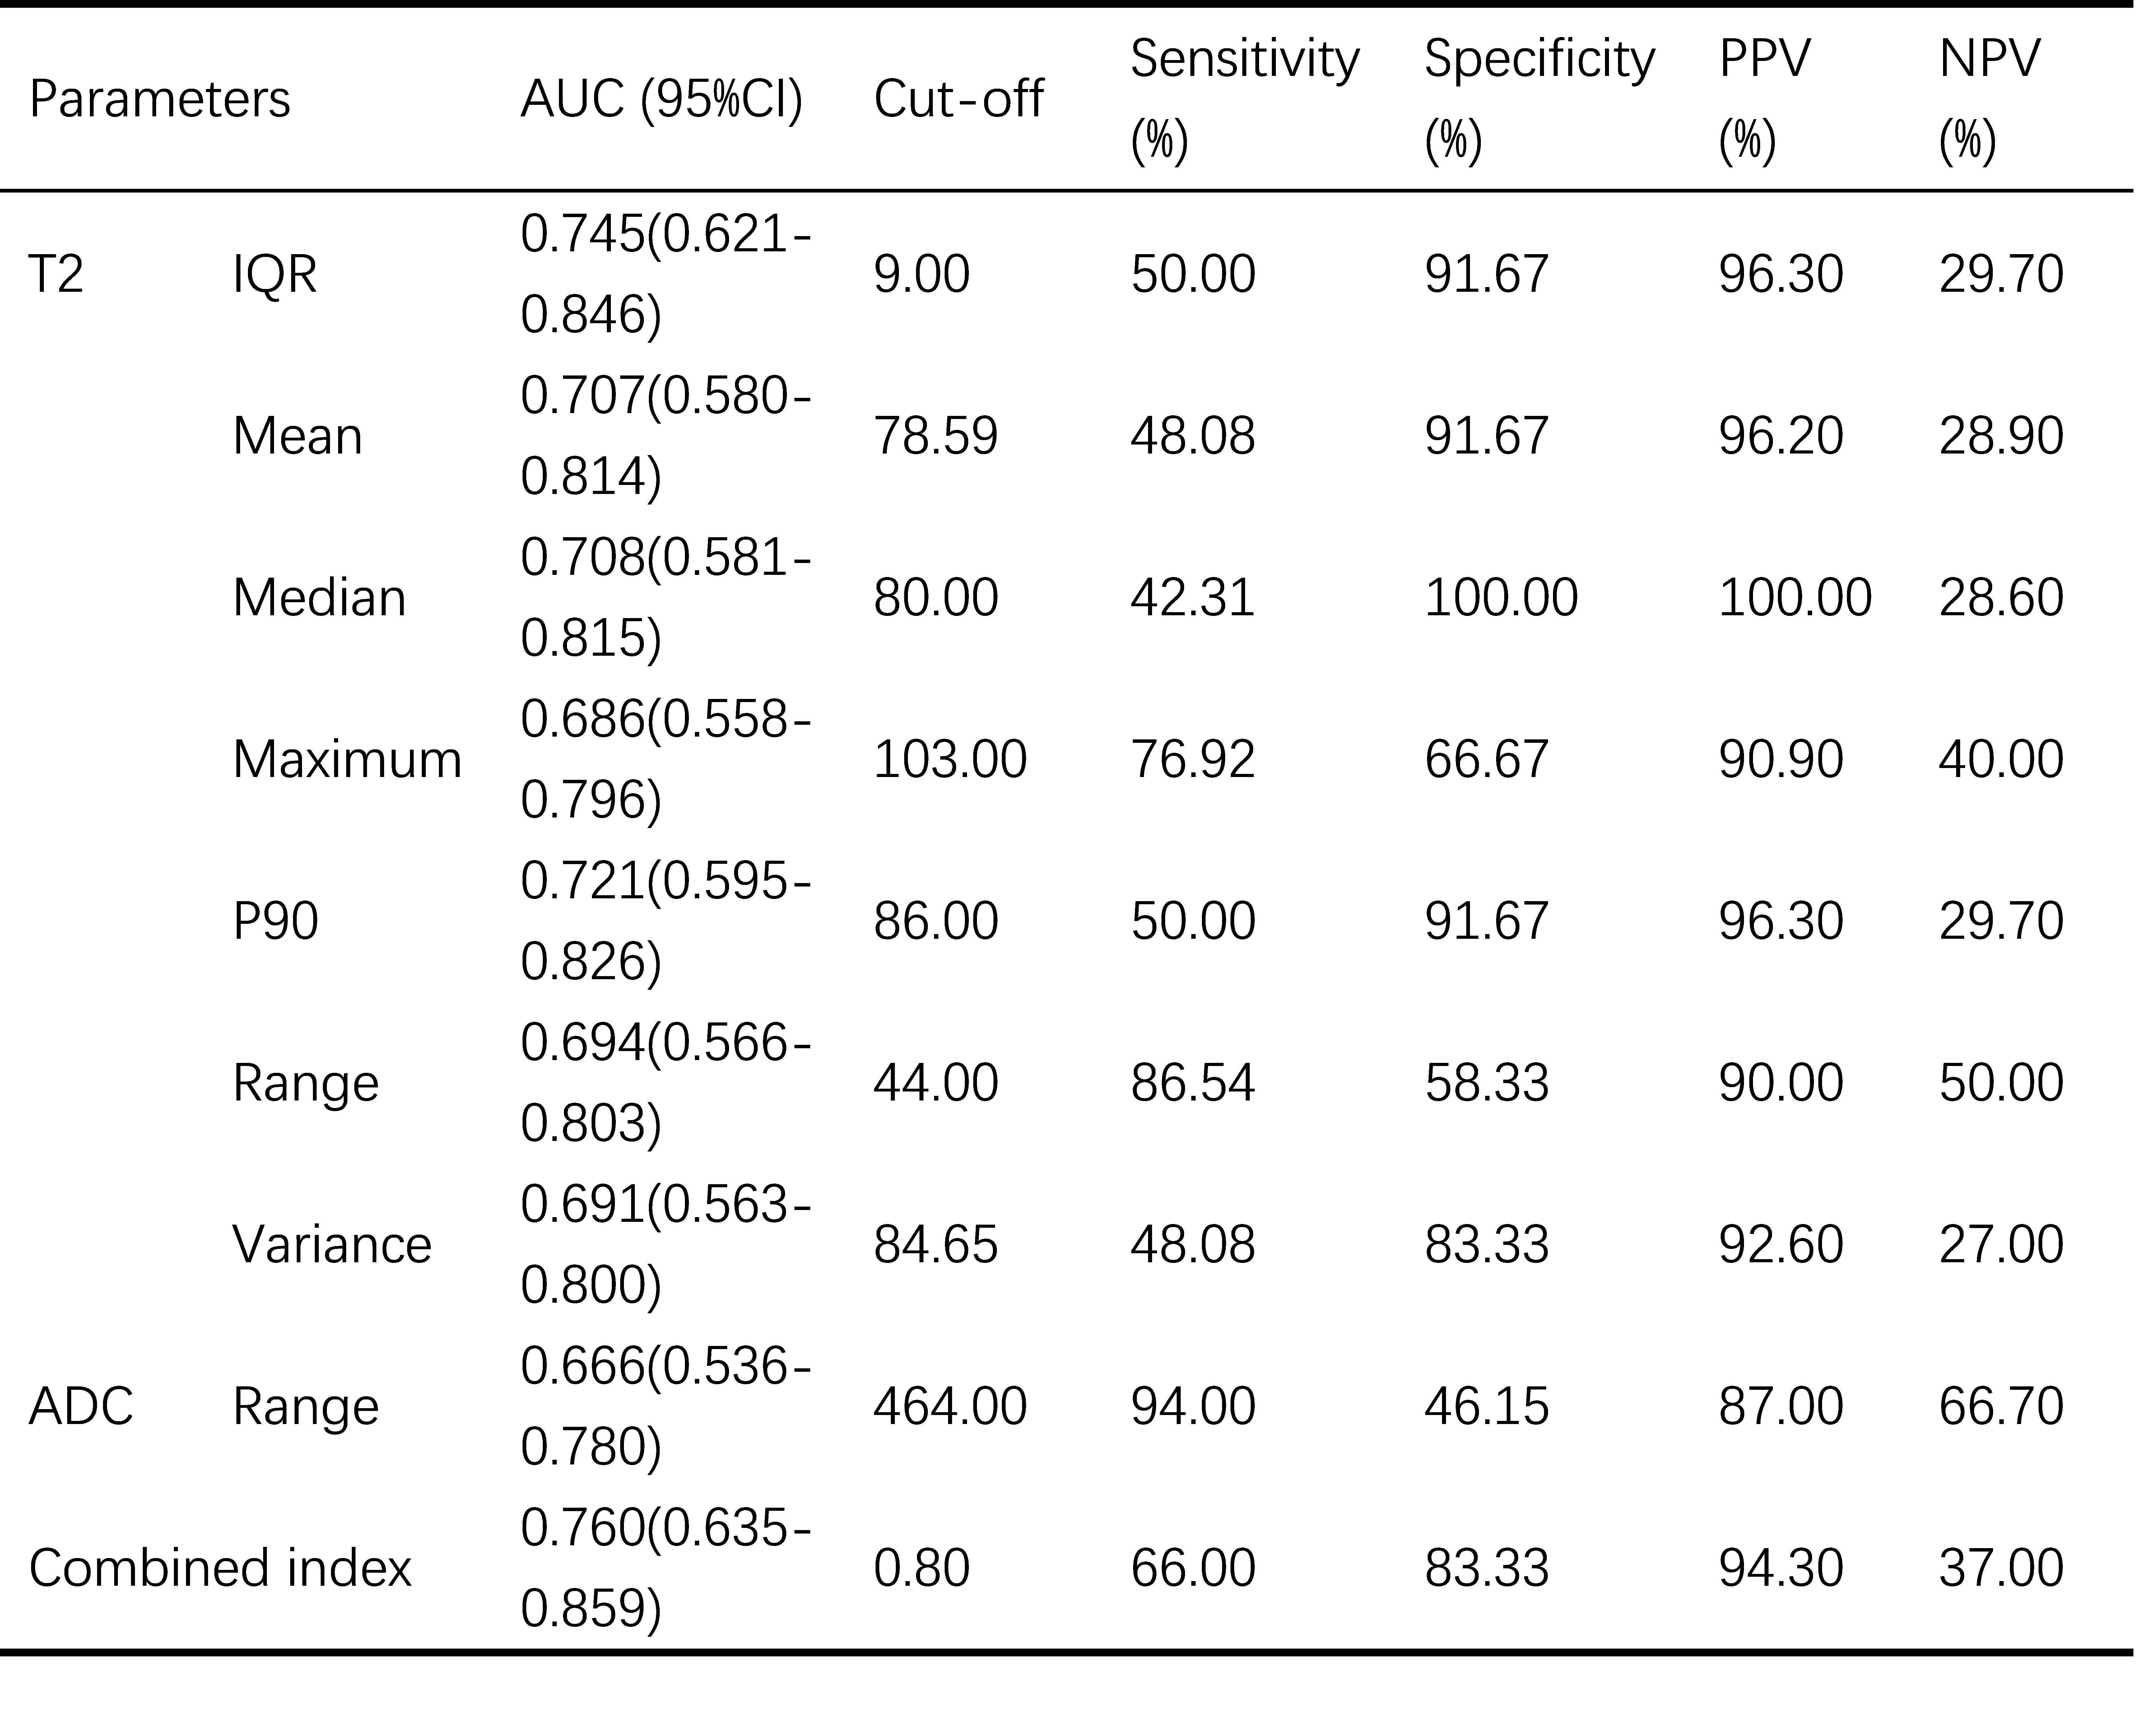
Table 1 Diagnostic performance of histogram parameters for the differentiation of PR status.
PR, progesterone receptor; AUC, area under the curve; CI, confidence interval; PPV, positive predictive value; NPV, negative predictive value; IQR, Interquartile range; P90, 90 percentiles. Combined index, combination of T2 IQR and ADC range.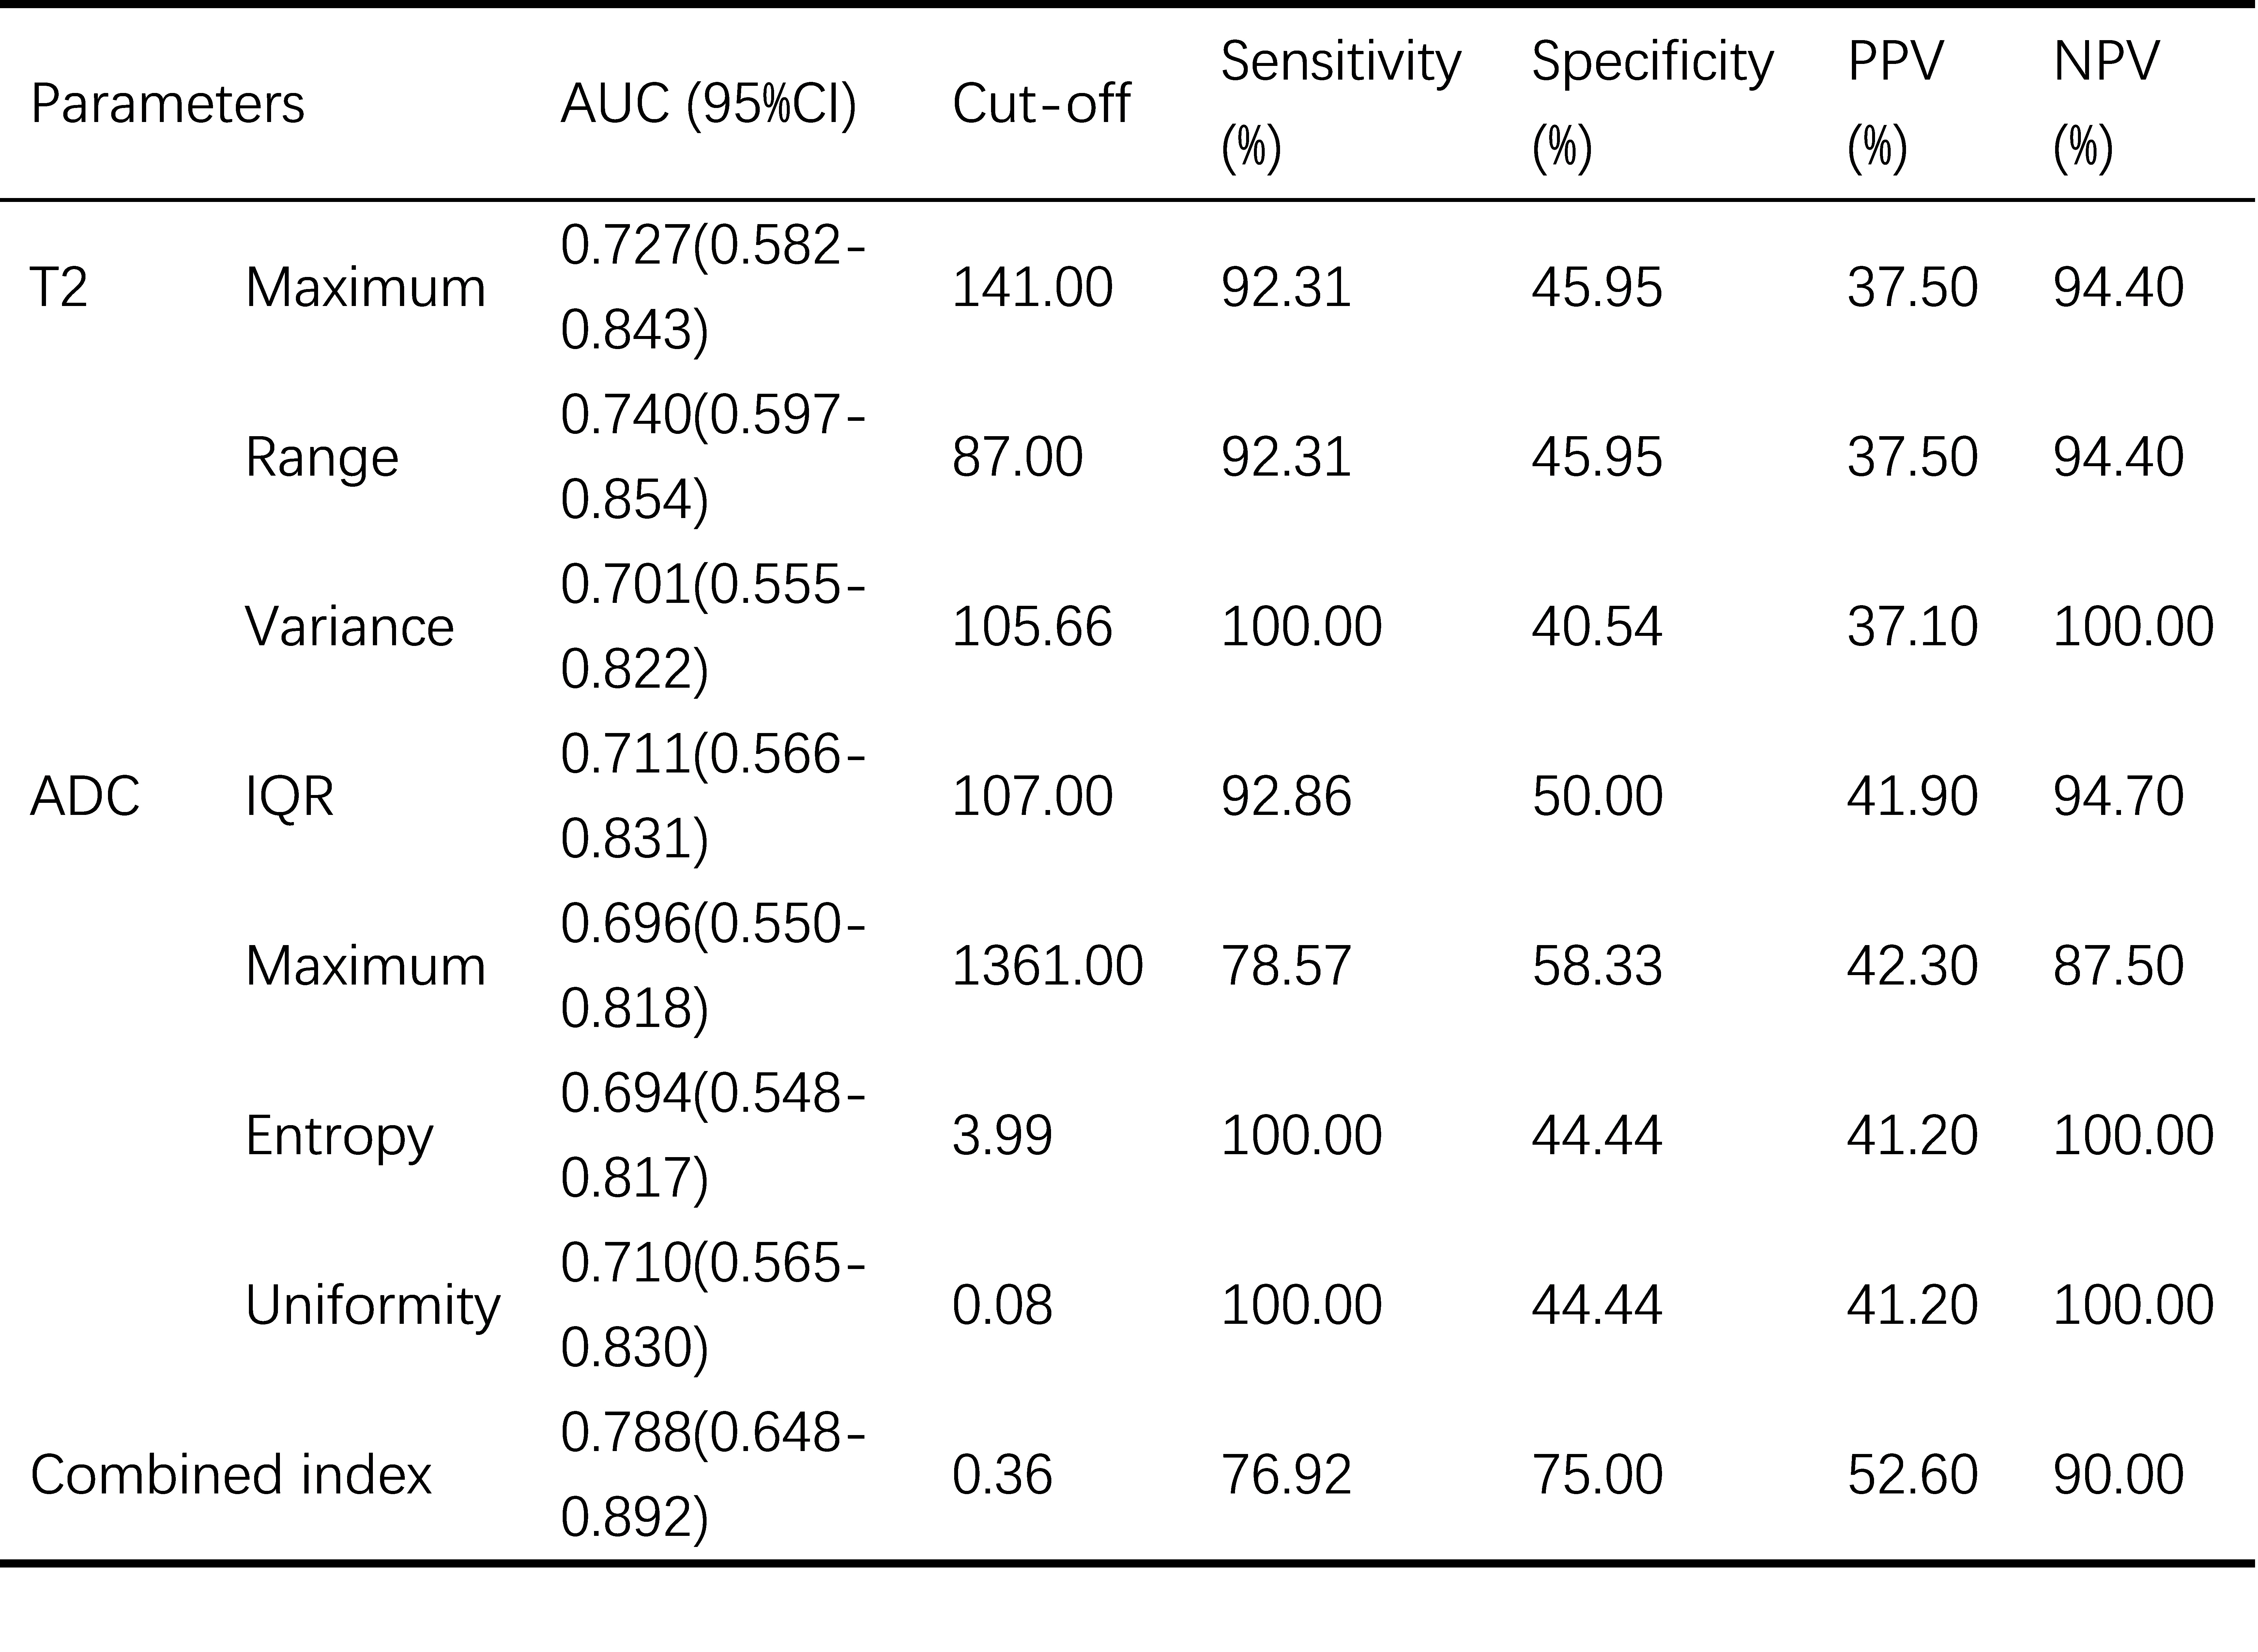
Table 2 Diagnostic performance of histogram parameters for the differentiation of S100 status.
AUC, area under the curve; CI, confidence interval; PPV, positive predictive value; NPV, negative predictive value; IQR, Interquartile range; combined index, combination of T2 range and ADC IQR.