1964
Deep Learning-based noise reduction for advanced brain MR imaging: Application to quantitative biomarkers in brain tumors1Radiology department, GHU Paris Psychiatrie et Neurosciences, Site Sainte-Anne, Paris, France, 2IMA-BRAIN, Université Paris Cité, Institute of Psychiatry and Neuroscience of Paris (IPNP), INSERM U1266, Paris, France, 3Canon Medical Systems Corporation, Tochigi, Japan, 4Canon Medical Systems Europe, Zoetermeer, Netherlands, 5Neuro-surgery department, GHU Paris Psychiatrie et Neurosciences, Site Sainte-Anne, Paris, France
Synopsis
Keywords: Tumors, Tumor
Our work is the clinical validation of a deep-learning algorithm (DLR) used to denoise MR images on quantitative MR biomarkers. Since it has been trained on including T1- and T2-weighted conventional images, in healthy volunteers, its effects on multiparametric quantitative MRI in patients, are uncertain. It could potentially improve brain tumors characterization by providing quantitative biomarkers under clinical time-constraints.INTRODUCTION
Brain neoplasm remains a diagnostic challenge (1). Quantitative information can be extracted from relaxometry and Diffusion Tensor Imaging (DTI). Despite their clinical potential, their long duration prevents their wide integration in clinical settings. Denoising using deep learning, deep learning-based reconstruction (DLR), has been used to improve image quality or to compensate for the degradation induced by acquisition time reduction (2). Since it has been trained on T1 and T2-weighted conventional images, in healthy volunteers, its effects on multiparametric quantitative MRI are uncertain.METHODS
Subjects22 patients (11 women; mean age, 56.0 ± 14.2 years) patients with a known or suspected supratentorial brain tumor were prospectively enrolled before surgery from April to June 2021 and scanned on a 3T whole-body MRI scanner (Vantage Galan 3T / XGO; Canon Medical Systems Corporation, Tochigi, Japan) with a 32-channel head coil.
Imaging protocol
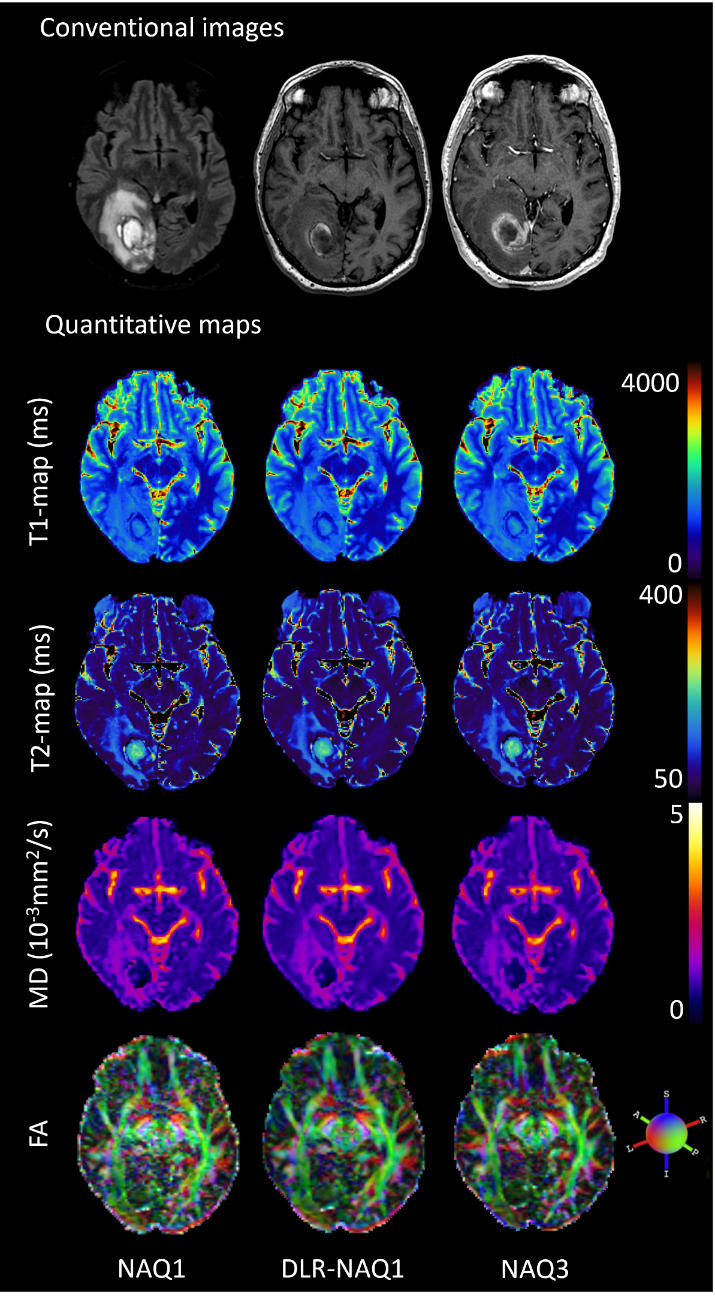
A 3D T1 MPRAGE was performed for intra-subject registration. DTI was performed using a 2D single-shot spin-echo EPI imaging sequence with whole brain coverage: in-plane resolution=2 mm2; STH=2mm; 30 directions; b-values=0-1000 s/mm²; TR/TE=5.2 s/85 ms; NEX=1; TA=2min58s. A 3D T1 MP2RAGE sequence was performed to generate T1-map: in-plane resolution=0.7x0.5 mm²; STH=2.5 mm; TR/TE=7.5 ms/3.3 ms; TI=664/3300 ms; inter-shot TR=7 s; NEX=1; TA=3min09s. A 2D T2 FSE sequence was performed at 4 echo times values to generate T2-maps: in-plane resolution=0.7x0.5 mm²; STH=2 mm; TR=6 s; TE=20/60/100/140 ms; NEX=1; TA=2min44s. To evaluate the denoising effect of DLR, quantitative sequences were acquired with one number of acquisitions (NAQ1) and 3 number of acquisitions (NAQ3) as ground truth data. The vendor-supplied DLR algorithm was applied to NAQ1 (DLR-NAQ1).
Data processing
T1 and T2 maps have been generated using Olea Sphere software. Data were pre-processed using FSL (3). For DTI data the processing steps were: susceptibility-induced off-resonance field estimated using top-up (4), then correction for eddy current and motion-distortions using eddy (5) and finally fractional anisotropy (FA) and mean diffusivity (MD) computed using the dtifit command. The parametric maps were co-registered onto the 3D-anatomical scan of each patient using a 3D rigid-registration via FLIRT (6). Deep Learning reconstructions have been performed with the application of a deep Convolutional Neuronal Network combined with a low-pass filtered component, in order to maintain original contrasts (2). For healthy tissues, six region-of-interest (ROIs) were placed in three normal brain areas (cortex, white matter, deep gray matter). For lesions, four ROIs were placed in the lesion center and in the lesion periphery.
RESULTS
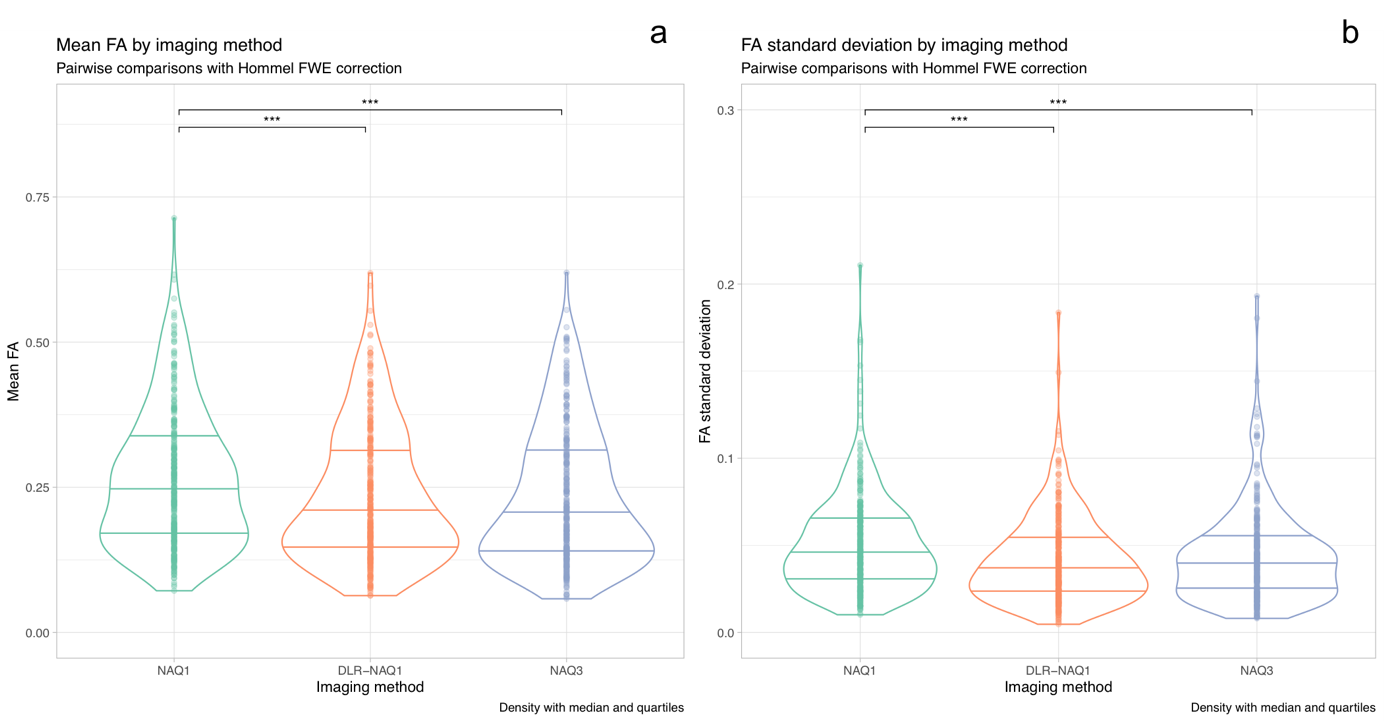
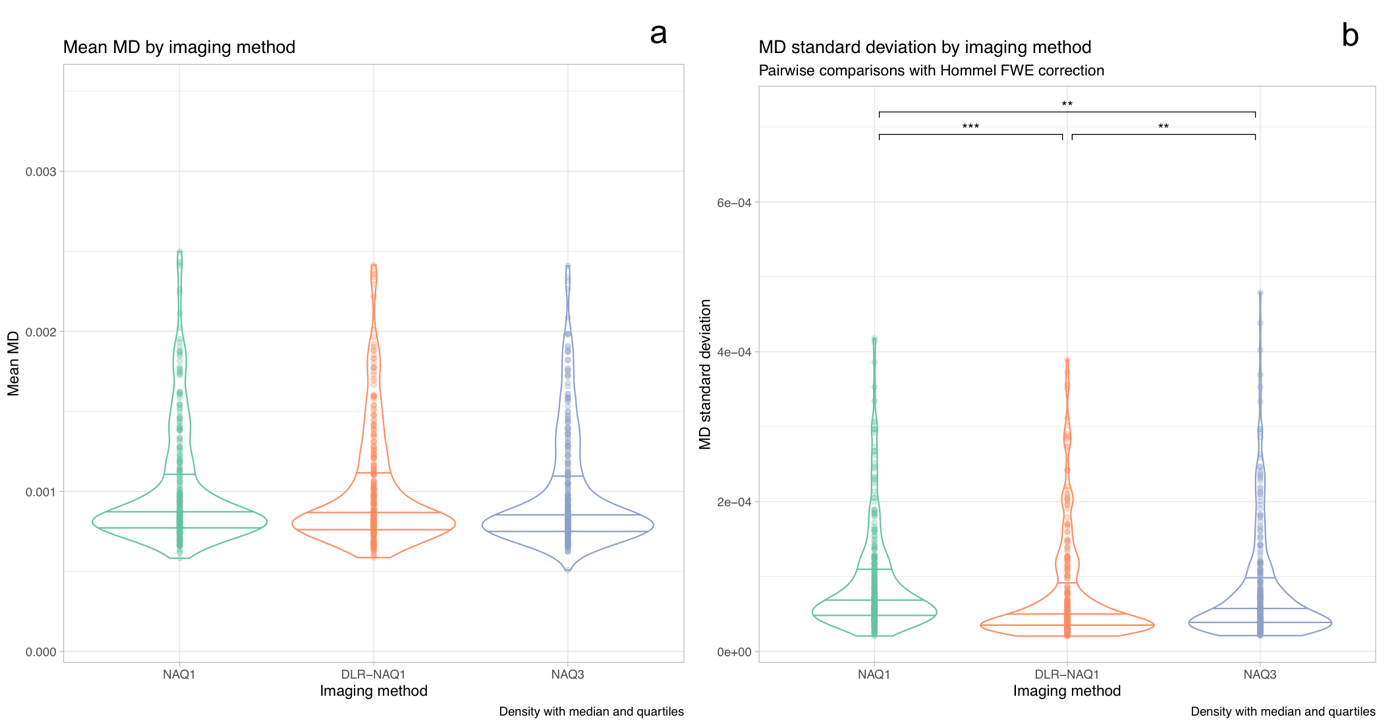
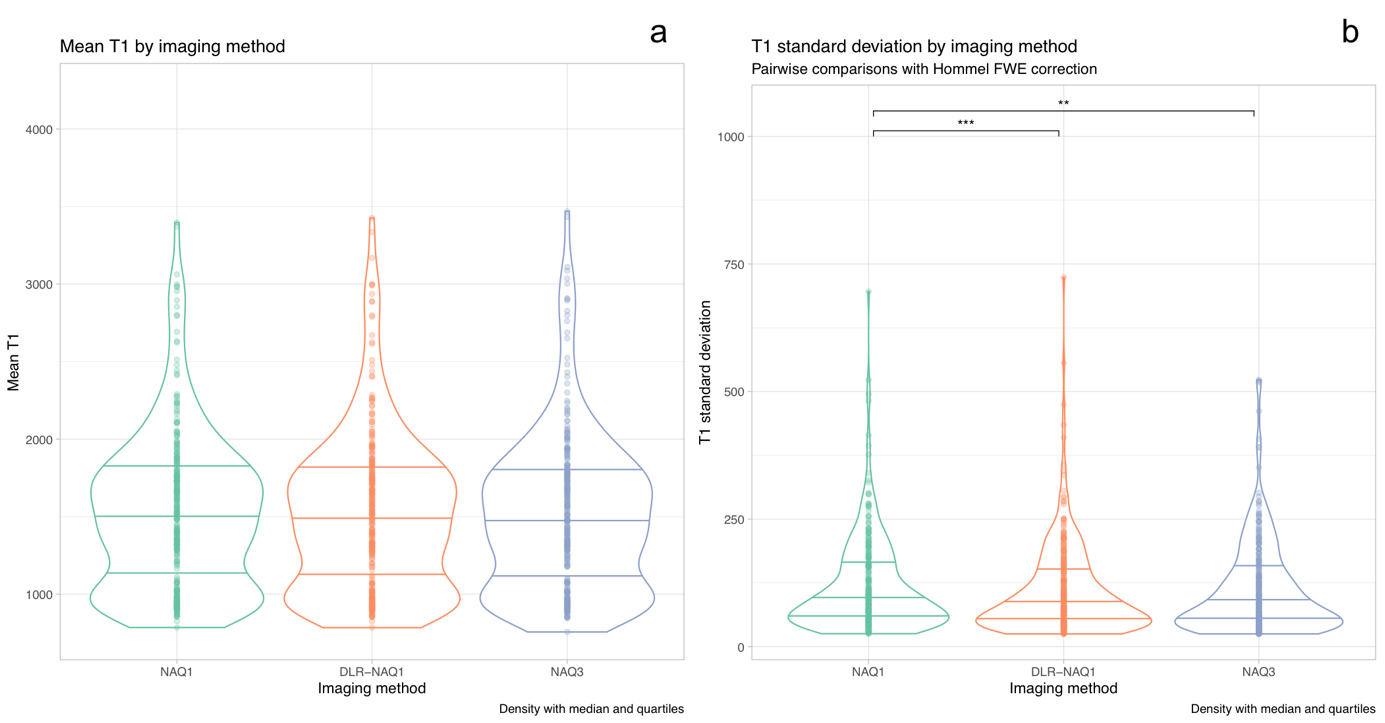
Figure 1 shows representative images for FA, MD, T1 and T2-maps calculated from NAQ1, DLR-NAQ1 and NAQ3 images. For all studied parameters, except for FA, the main effect of ROIs location was always significant with expected variations depending on ROIs location, thus all ROIs were pooled for further analysis. Note that the putamen ROI has been removed in the analysis of the FA-parameter considering the significant interaction effect between the ROI location and acquisition-reconstruction methods.As shown in Figure 2, there was no significant difference in mean FA values between DLR-NAQ1 and NAQ3. Interestingly, mean FA significantly differed (P < 0.001) between NAQ1 and the other two acquisition-reconstructions, with values being higher in NAQ1. Similar findings were observed for SDs. In particular, SDs were smaller (P < 0.001) in DLR-NAQ1 and NAQ3 than NAQ1. As shown in Figure 3, there was no significant difference in mean MD values between the three groups. SDs significantly differed between the three groups. As shown in Figure 3, there was no significant difference in mean T1 values between the three groups. SDs of T1 values significantly differed between NAQ1 and the other two acquisition-reconstructions, with values being lower in DLR-NAQ1 (P < 0.01). The results for the T2 values are similar to those of T1 values (data not shown).
DISCUSSION
Overall, in a series of 22 consecutive patients with brain tumors, we found that DLR applied to fast and noisy MR sequences improved the reliability of quantitative parameters (FA, MD, T1- T2-relaxation times). Indeed, values were similar to those obtained from longer sequences, with less variability compared to fast ones without DLR. This was observed irrespective of the brain region. Interestingly regarding FA values, a significant difference was identified in NAQ1 compared to that of DLR-NAQ1 and NAQ3, with higher values in NAQ1. In contrast, there were no significant differences regarding mean MD values between the three groups. It has been reported that an upward bias of FA and no significant bias in MD are observed as signal-to-noise ratio decreased (7). By reducing image noise using DLR, the FA values of DLR-NAQ1 became much closer to that of NAQ3 to the point that there was not any significant difference between DLR-NAQ1 and NAQ3.CONCLUSION
To our knowledge, this is the first study that assessed the effect of DLR on quantitative MR biomarkers, including T1 and T2-relaxation time maps and DTI-derived metrics, in patients with a supratentorial brain tumor. Showing that reliable quantitative biomarkers can be derived from short sequences (≈3 minutes each), will promote their use in a clinical setting. The parametric maps could help characterize brain tumor subtypes or to differentiate a unique metastasis from a high-grade glioma owing to quantitative biomarkers and improve diagnosis.Acknowledgements
No acknowledgement found.References
1. Kern M, Auer TA, Picht T, Misch M, Wiener E. T2 mapping of molecular subtypes of WHO grade II/III gliomas. BMC Neurol 2020;20:1–9 doi: 10.1186/s12883-019-1590-1.
2. Kidoh M, Shinoda K, Kitajima M, et al. Deep Learning Based Noise Reduction for Brain MR Imaging: Tests on Phantoms and Healthy Volunteers. Magn Reson Med Sci 2019;advpub doi: 10.2463/mrms.mp.2019-0018.
3. Jenkinson M, Beckmann CF, Behrens TEJ, Woolrich MW, Smith SM. FSL. NeuroImage 2012;62:782–790 doi: 10.1016/j.neuroimage.2011.09.015.
4. Andersson JLR, Skare S, Ashburner J. How to correct susceptibility distortions in spin-echo echo-planar images: application to diffusion tensor imaging. NeuroImage 2003;20:870–888 doi: 10.1016/S1053-8119(03)00336-7.
5. Andersson JLR, Sotiropoulos SN. An integrated approach to correction for off-resonance effects and subject movement in diffusion MR imaging. NeuroImage 2016;125:1063–1078 doi: 10.1016/j.neuroimage.2015.10.019.
6. Jenkinson M, Smith S. A global optimisation method for robust affine registration of brain images. Med Image Anal 2001;5:143–156 doi: 10.1016/S1361-8415(01)00036-6.
7. Landman BA, Farrell JAD, Jones CK, Smith SA, Prince JL, Mori S. Effects of diffusion weighting schemes on the reproducibility of DTI-derived fractional anisotropy, mean diffusivity, and principal eigenvector measurements at 1.5T. NeuroImage 2007;36:1123–1138 doi: 10.1016/j.neuroimage.2007.02.056.
Figures