1963
Histogram model of DCE-MRI in predicting progression of enhancing non-measurable disease after chemoradiotherapy in high-grade glioma1Department of Medical Imaging, Nanfang Hospital, Southern Medical University, Guangzhou, China, 2Department of Neurosurgery, Nanfang Hospital, Southern Medical University, Guangzhou, China, 3Philips Healthcare, Guangzhou, China, 4Division of Neuroradiology, Russell H. Morgan Department of Radiology and Radiological Science, Johns Hopkins University School of Medicine, Baltimore, MD, United States, 5Neurosection, Division of MRI Research, Department of Radiology, Johns Hopkins University School of Medicine, Baltimore, MD, United States, 6F.M. Kirby Research Center for Functional Brain Imaging, Kennedy Krieger Institute, Baltimore, MD, United States
Synopsis
Keywords: Tumors, Perfusion, enhancing non-measurable disease (NMD)
Early prediction of disease progression is of potential clinical significance for the management of high-grade glioma (HGG) patients. We investigated the value of histogram models based on volume transfer constant (Ktrans) between the plasma and extravascular extracellular space and extravascular volume (Ve) in predicting the progression of enhancing non-measurable diseases (NMD) of HGG after chemoradiotherapy. Our results showed that histogram models based on Ktrans and Ve can accurately predict the progression of enhancing NMD of HGG following chemoradiotherapy, and combining Ktrans and Ve helps improve the prediction performance.Introduction
Early prediction of disease progression is of potential clinical significance for the management of high-grade glioma (HGG) patients 1. Follow-up is usually recommended for enhancing non-measurable disease (NMD), i.e, with a diameter of less than 10 mm. Dynamic contrast-enhanced (DCE) MRI can provide information on the dynamic characteristics of tumor angiogenesis and microcirculation, which may be useful in the evaluation of disease progression 2-4. Histogram analysis is a robust method that can provide quantitative information on tissue characteristics 5, 6. However, the use of histogram features of DCE-MRI perfusion parameters to assess the disease progression of enhancing NMD in HGG has not yet been reported. Here, we aimed to investigate the value of histogram models based on volume transfer constant (Ktrans) between the plasma and extravascular extracellular space and extravascular volume (Ve) in predicting the progression of enhancing NMD in HGG after completion of chemoradiotherapy.Materials and Methods
The DCE images of patients who underwent temozolomide-based chemoradiation after surgery from January 2016 to May 2022 were analyzed retrospectively. MRI data were acquired on a 3.0T scanner (Ingenia, Philips Healthcare, Best, The Netherlands) with a 16-channel head coil. Post-processing of DCE-MRI was performed using dedicated post-processing software (IntelliSpace Portal V9.0, Philips). We calculated Ktrans and Ve based on the dual compartment extended Tofts pharmacokinetic model 7, 8. Then, histogram features including 10th percentile, 90th percentile, Energy, Entropy, InterquartileRange (IR), Kurtosis, Maximum, Mean, MeanAbsoluteDeviation (MAD), Median, Minimum, Range, RobustMeanAbsoluteDeviation (RMAD), RootMeanSquared (RMS), Skewness, TotalEnergy, Uniformity and Variance of Ktrans and Ve of enhancing NMD were extracted and compared between the progression and non-progression groups using the Mann-Whitney U test. Histogram features with significant differences (at P < 0.05) were included in binary logistic regression to construct histogram models of perfusion parameters individually or combined to predict progression in 2-3 months. Receiver operating characteristic curves were used to evaluate the prediction performance of different models (Ktrans, Ve and Ktrans + Ve).Results
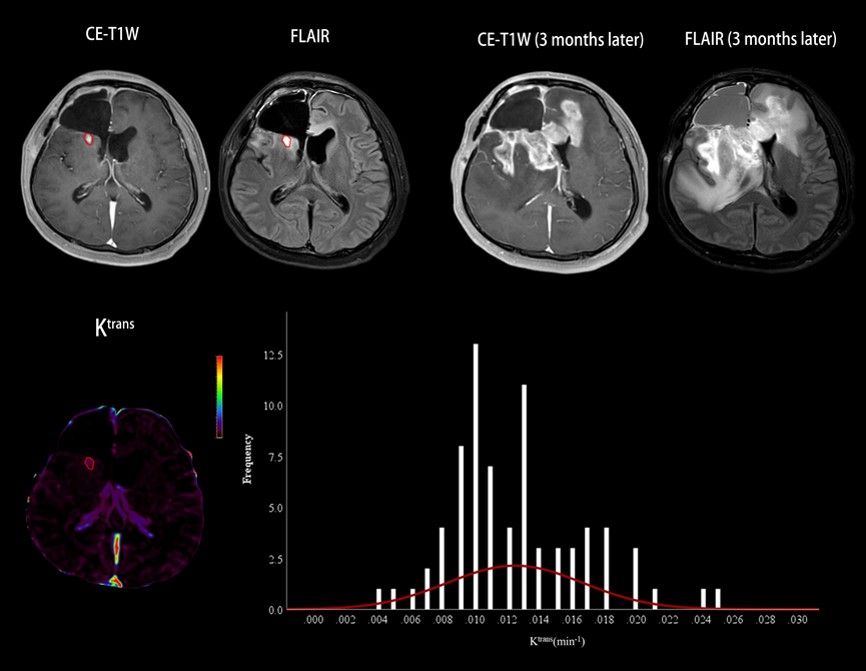
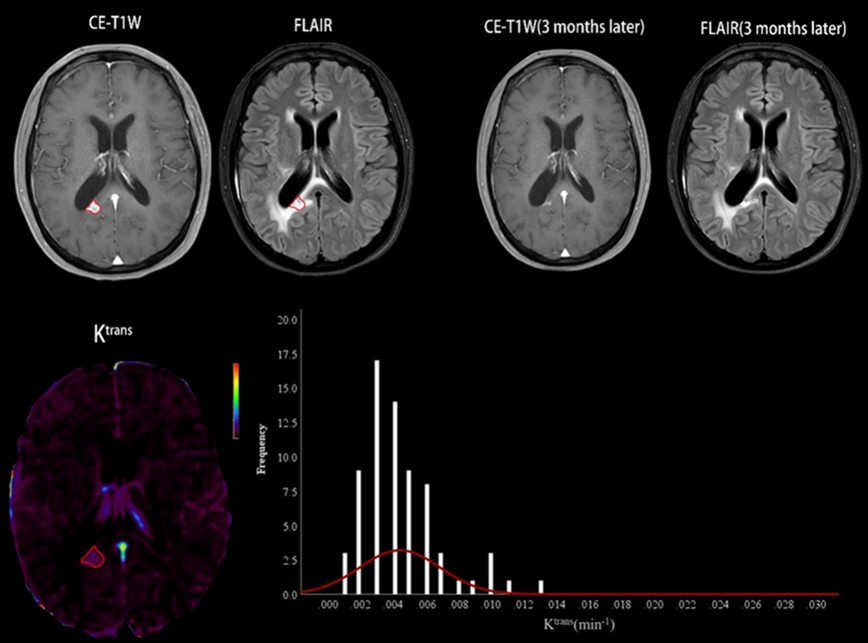
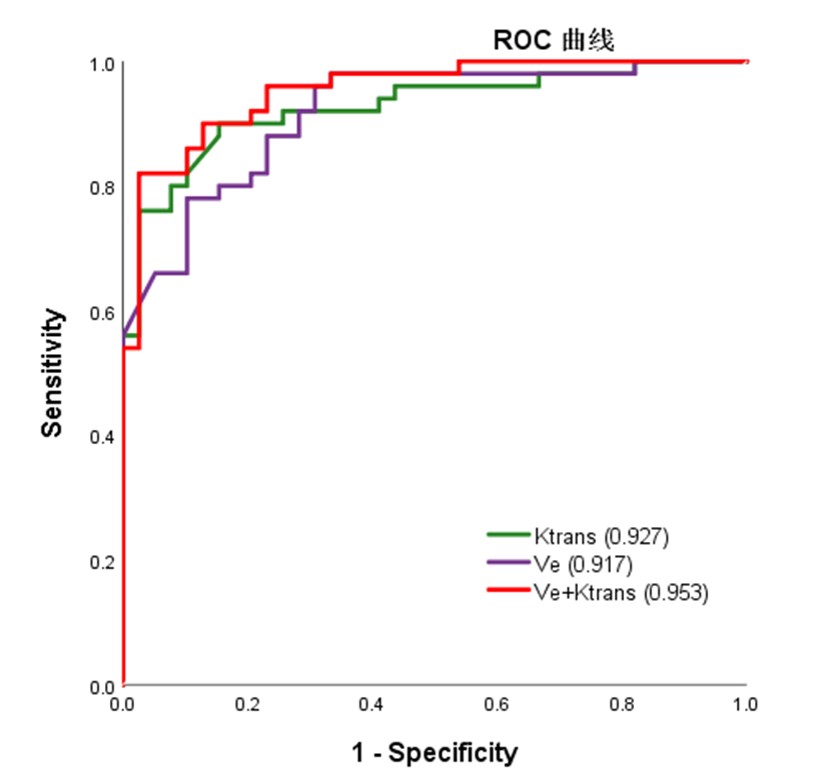
A total of 89 HGG patients (mean age ± standard deviation, 47 years ± 12; 67 men) were enrolled, including 50 in the progression group and 39 in the non-progression group. The numbers of histogram feature with significant differences between the two groups were 10 and 13 for Ktrans and Ve, respectively. For Ktrans, Mean, Median, Minimum, 10th percentile, 90th percentile, RMS and Uniformity were significantly higher in the progression group, while Entropy, Kurtosis and Skewness were significantly lower in the progression group. For Ve, Mean, Median, Minimum, 10th percentile, 90th percentile, Entropy, IR, MAD, RMAD and RMS were significantly higher in the progression group, while Kurtosis, Skewness and Uniformity were significantly lower in the progression group. The histogram model of Ktrans (10th percentile + 90th percentile + Skewness) showed an area under the curve (AUC) of 0.927 in predicting progression. The models of Ve (10th percentile + Minimum + Skewness) had an AUC of 0.917. Combining Ktrans and Ve, the model (Ve_10th percentile + Ve_Skewness + Ktrans_ RootMeanSquared) had an AUC of 0.953. Table 1 summarizes the predictive performance of different models. Two representative cases of the progressive and non-progressive diseases are shown in Figures 1 and 2.ROC curves of the models of Ktrans, Ve and Ktrans + Ve in predicting progression are plotted in Figure 3.Discussion
Our results demonstrated that the histogram model based on Ktrans and Ve individually or combined could accurately predict the progression of enhancing NMD.Previous studies have used DCE perfusion parameters to predict glioma progression. Yoo et al 9 found that the Mean of Ktrans and Ve and the 5th percentile of Ktrans could predict the progression of measurable disease (MD) in glioblastoma patients after chemoradiotherapy. However, their research did not analyze NMD. Of note, enhancing lesions smaller than 10 mm in diameter might be an early stage of glioma progression 10. Therefore, accurate identification of progression at the stage of NMD would provide earlier evidence for individualized clinical decision-making as compared with at the stage of MD.
Yun et al 4 investigated the diagnostic performance of DCE in differentiating true progression from pseudoprogression and found that Mean and 10th percentile of Ktrans, Mean and 5th percentile of Ve were higher in true progression. The present study showed that histogram features of Ktrans and Ve of enhancing NMD, such as 10th percentile, 90th percentile, Mean, Median RMS and Minimum, were higher in the progression group, which was basically consistent with the study by Yun et al 4. Of note, the progression group showed lower Skewness in this study, which was consistent with the study by Baek et al 11. Generally, the decrease in Skewness represents an increase in perfusion parameters.
Conclusion
The histogram models based on Ktrans and Ve can predict the progression of enhancing nonmeasurable disease in high-grade glioma following chemoradiotherapy 2-3 months in advance, and combining Ktrans and Ve helps improve the prediction performance.Acknowledgements
References
1. Khalifa J, Tensaouti F, Chaltiel L, et al. Identification of a candidate biomarker from perfusion MRI to anticipate glioblastoma progression after chemoradiation. Eur Radiol, 2016;26(11):4194-4203.
2. Kim H S, Goh M J, Kim N, et al. Which combination of MR imaging modalities is best for predicting recurrent glioblastoma? Study of diagnostic accuracy and reproducibility. Radiology, 2014;273(3):831-843.
3. Shin K E, Ahn K J, Choi H S, et al. DCE and DSC MR perfusion imaging in the differentiation of recurrent tumour from treatment-related changes in patients with glioma. Clinical Radiology, 2014;69(6):e264-e272.
4. Yun T J, Park C K, Kim T M, et al. Glioblastoma treated with concurrent radiation therapy and temozolomide chemotherapy: differentiation of true progression from pseudoprogression with quantitative dynamic contrast-enhanced MR imaging. Radiology, 2015;274(3):830-840.
5. Davnall F, Yip C S, Ljungqvist G, et al. Assessment of tumor heterogeneity: an emerging imaging tool for clinical practice?. Insights Imaging, 2012;3(6):573-589.
6. He W, Li X, Hua J, et al. Noninvasive Assessment of O(6)-Methylguanine-DNA methyltransferase ppromoter methylation status in world health organization grade II-IV glioma using histogram analysis of inflow-based vascular-space-occupancy combined with structural magnetic resonance imaging. J Magn Reson Imaging, 2021;54(1):227-236.
7. Hu L S, Baxter L C, Pinnaduwage D S, et al. Optimized preload leakage-correction methods to improve the diagnostic accuracy of dynamic susceptibility-weighted contrast-enhanced perfusion MR imaging in posttreatment gliomas. AJNR Am J Neuroradiol, 2010;31(1):40-48.
8. Tofts P S, Kermode A G. Measurement of the blood-brain barrier permeability and leakage space using dynamic MR imaging. 1. Fundamental concepts. Magn Reson Med, 1991;17(2):357-367.
9. Yoo R, Choi S H, Kim T M, et al. Dynamic contrast-enhanced MR imaging in predicting progression of enhancing lesions persisting after standard treatment in glioblastoma patients: a prospective study. European Radiology, 2017;27(8):3156-3166.
10. Young R J, Gupta A, Shah A D, et al. Potential utility of conventional MRI signs in diagnosing pseudoprogression in glioblastoma. Neurology, 2011;76(22):1918-1924.
11. Baek H J, Kim H S, Kim N, et al. Percent change of perfusion skewness and kurtosis: a potential imaging biomarker for early treatment response in patients with newly diagnosed glioblastomas. Radiology, 2012;264(3):834-843.
Figures
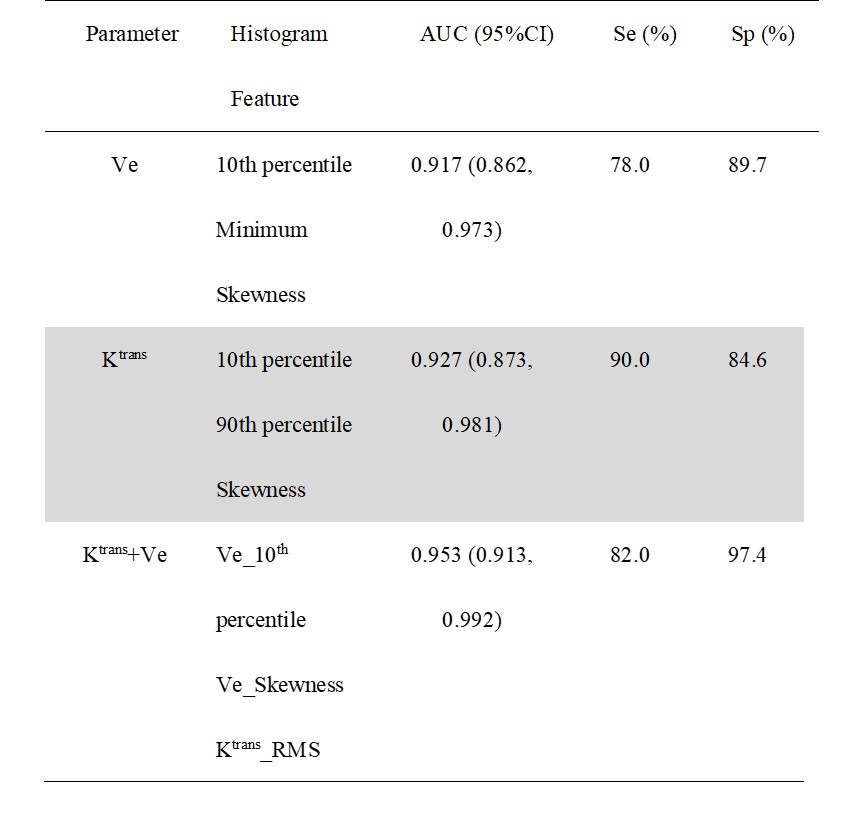
Table 1. Predictive Performance of Different Models in Predicting Progression
Note. — CI, confidence interval; Se, sensitivity; Sp, specificity; ROC, receiver operating characteristic; AUC, area under the ROC curve; RMS = RootMeanSquared.