1962
Radiomics Based on Diffusion and Perfusion MRI Image: New Prognostic Biomarkers in PCNSL patients1Department of Radiology, The First Medical Center, Chinese PLA General Hospital, Beijing, China
Synopsis
Keywords: Tumors, Nervous system, Lymphoma
Prognostic prediction based on clinical data and laboratory tests are facing reliability challenges for immunocompetent primary central nervous system lymphoma (PCNSL) . In this study, we attempted to explore new prognostic biomarkers based on MRI-radiomics features to predict the outcomes in PCNSL. Our results showed that radio-score based on the ADC map and ASL was independent risk factors in OS and PFS predictions. Meanwhile adding radiomics features improved the model performance compared with traditional ones among which model based on ASL had better performance than ADC. So radiomics features can effectively classify different prognosis and improve the model performance in PCNSL.Introduction
Primary central nervous system lymphoma (PCNSL) is a rare form of non-Hodgkin lymphoma (NHL) involving the brain, spinal cord, meninges, or vitreoretinal space, with no evidence of systemic involvement1. With an incidence of 0.47 per 100 000 per year, increasing incidence of PCNSL has been recognized in recent years, particularly in older patients (median age:67 years) with poor outcome2.Almost all reported prognostic scoring considered age and performance status to be prognostic factors for PCNSL, and even Memorial Sloan-Kettering Cancer Center (MSKCC) scores included only these two factors3. Nottingham/Barcelona (NB)4 added multiple lesions as a risk factor to the former. Another commonly used model was the International Extranodal Lymphoma Study Group (IELSG) which incorporated lactate dehydrogenase (LDH), cerebrospinal fluid (CSF) protein, and deep brain lesions involvement in addition to age and performance status5.
Magnetic resonance imaging (MRI) contains a wealth of information that can be used for disease diagnosis, molecular prediction, and clinical outcomes, which also has been recommended by the International Primary CNS Lymphoma Collaborative Group (IPCG) in 20206. As the most commonly used functional sequence, apparent diffusion coefficient (ADC) values can be used to predict sensitivity to chemotherapy 7,8, overall survival (OS) as well as progression-free survival (PFS) in PCNSL9. Perfusion-weighted imaging (PWI) depending on cerebral hemodynamics could also be the surrogate noninvasive biomarkers for PCNSL clinical outcomes. Research based on dynamic susceptibility contrast (DSC)9 and dynamic contrast-enhancement (DCE)10,11 have been published, but related research on arterial spin labeling (ASL) has been seldomly reported. In addition, compared to conventional measurements, radiomics can extract numerous features in high throughput for quantitative analysis of the tumor region of interest, which can provide more valuable diagnostic, prognostic, or predictive information12,13. However, to date, there have been rare reports of integrating radiomics techniques with PCNSL survival analysis.
Therefore, our study aimed to identify whether radiomics features based on ADC and ASL imaging could be used to predict survival situations in a treated immunocompetent PCNSL population.
Method
Thirty-five immunocompetent PCNSL patients and 56 lesions were enrolled in the study. A total of 2234 radiomics characteristics were extracted from the tumor segments on ADC maps and ASL respectively, and the rad-score was calculated by the coefficients of least absolute shrinkage and selection operator (Lasso) regression. Kaplan-Meier (KM) analysis and Cox proportional-hazards (COX) model were used in overall survival (OS) and progression-free survival (PFS) analysis. The model performance was evaluated by concordance index (c-index), Akaike information criterion (AIC), and decision curve analysis (DCA). Nomogram and calibration curve presented the optimal models’ result.Results
In the clinical data, KPS and MSKCC grades were associated with PCNSLs death (pKPS=0.013, pMSKCC=0.006) and progression (pKPS=0.034, pMSKCC=0.034) ( Table 1), but there was no significant correlation between the endpoint events and MRI features of lesions.Univariate analysis showed rad-score based on the ADC map and ASL, Karnofsky performance score (KPS) and the number of lesions (NL) were statistically significant parameters in OS and PFS predictions (Figure 1). Multifactor analysis showed that the rad-score could be an independent risk factor in prognosis analysis and the model combined with the rad-score had better performance than the traditional ones. Model-based on ASL rad-score had the best performance in both OS (C-index [95%] =0.83[0.71,0.88], AIC=151.25) (Table 2) and PFS (C-index [95%] =0.80[0.71,0.89], AIC=189.69) (Table 3). DCA was used for further analysis to compare models at different time nodes, nomogram showed optimal prediction models, and calibration curves at different time nodes showed good agreement between the estimations and the clinical outcomes in OS and PFS prediction respectively (Figure 2).
Discussion
In this study, we enrolled immunocompetent treated PCNSL patients and created new prognostic models including radiomics features. Meanwhile, our results also suggest that both ADC and ASL as non-invasive imaging biomarkers have the potential to predict the outcomes, and ASL could better help to further stratify the prognosis for PCNSL patients.Radiomics combines artificial intelligence with medical imaging and uses machine learning to convert image data into high-resolution feature space data to achieve deeper data mining. Chong et al. extracted histogram features (also called first-order features) on ADC maps to predict the OS of patients. However, their study only focused on the univariate survival analysis between histogram features and OS without multifactor analysis14. Ali et al. added texture features from T1CE and T2FLAIR images and combined them with the SVM model to predict PCNSL patients' prognostic (n=61), but no survival analysis such as K-M or COX analysis was tested15.
In the future, we would like to enroll more PCNSL patients to test our model and add multi-parametric MRI for survival analysis to further improve our model performance.
Conclusion
In this study, MRI-based radiomics integrated with clinical data could better distinguish PCNSL patients from different risk groups, which indicated that as a non-invasive and repeatable approach, MRI played an increasingly significant role in personalized treatment planning.Acknowledgements
The authors would like to thank all the participants.References
1. Löw S, Han CH, Batchelor TT. Primary central nervous system lymphoma. Ther Adv Neurol Disord. 2018;11:1756286418793562. doi:10.1177/1756286418793562
2. Ostrom QT, Patil N, Cioffi G, Waite K, Kruchko C, Barnholtz-Sloan JS. CBTRUS statistical report: Primary brain and other central nervous system tumors diagnosed in the United States in 2013-2017. Neuro-Oncology. 2020;22(Supplement_1):IV1-IV96. doi:10.1093/neuonc/noaa200
3. Abrey LE, Ben-Porat L, Panageas KS, et al. Primary central nervous system lymphoma: The memorial sloan-kettering cancer center prognostic model. Journal of Clinical Oncology. 2006;24(36):5711-5715. doi:10.1200/JCO.2006.08.2941
4. Bessell EM, Graus F, Lopez-Guillermo A, et al. Primary non-Hodgkin’s lymphoma of the CNS treated with CHOD/BVAM or BVAM chemotherapy before radiotherapy: long-term survival and prognostic factors. Int J Radiat Oncol Biol Phys. 2004;59(2):501-508. doi:10.1016/j.ijrobp.2003.11.001
5. Ferreri AJM, Blay JY, Reni M, et al. Prognostic scoring system for primary CNS lymphomas: the International Extranodal Lymphoma Study Group experience. Journal of clinical oncology : official journal of the American Society of Clinical Oncology. 2003;21(2):266-272. doi:10.1200/JCO.2003.09.139
6. Barajas RF, Politi LS, Anzalone N, et al. Consensus recommendations for MRI and PET imaging of primary central nervous system lymphoma: Guideline statement from the International Primary CNS Lymphoma Collaborative Group (IPCG). Neuro-Oncology. 2021;23(7):1056-1071. doi:10.1093/neuonc/noab020
7. Zhang Y, Zhang Q, Wang XX, Deng XF, Zhu YZ. Value of pretherapeutic DWI in evaluating prognosis and therapeutic effect in immunocompetent patients with primary central nervous system lymphoma given high-dose methotrexate-based chemotherapy: ADC-based assessment. Clin Radiol. 2016;71(10):1018-1029. doi:10.1016/j.crad.2016.05.017
8. Jeong SY, Park JE, Kim N, Kim HS. Hypovascular Cellular Tumor in Primary Central Nervous System Lymphoma is Associated with Treatment Resistance: Tumor Habitat Analysis Using Physiologic MRI. AJNR Am J Neuroradiol. 2022;43(1):40-47. doi:10.3174/ajnr.A7351
9. Valles FE, Perez-Valles CL, Regalado S, Barajas RF, Rubenstein JL, Cha S. Combined diffusion and perfusion MR imaging as biomarkers of prognosis in immunocompetent patients with primary central nervous system lymphoma. American Journal of Neuroradiology. 2013;34(1):35-40. doi:10.3174/ajnr.A3165
10. Hatzoglou V, Oh JH, Buck O, et al. Pretreatment dynamic contrast-enhanced MRI biomarkers correlate with progression-free survival in primary central nervous system lymphoma. J Neurooncol. 2018;140(2):351-358. doi:10.1007/s11060-018-2960-z
11. Fu F, Sun X, Li Y, et al. Dynamic contrast-enhanced magnetic resonance imaging biomarkers predict chemotherapeutic responses and survival in primary central-nervous-system lymphoma. Eur Radiol. 2021;31(4):1863-1871. doi:10.1007/s00330-020-07296-5
12. Kumar V, Gu Y, Basu S, et al. Radiomics: the process and the challenges. Magnetic resonance imaging. 2012;30(9):1234-1248. doi:10.1016/J.MRI.2012.06.010
13. Gillies RJ, Kinahan PE, Hricak H. Radiomics: Images Are More than Pictures, They Are Data. Radiology. 2016;278(2):563-577. doi:10.1148/radiol.2015151169
14. Chong I, Ostrom Q, Khan B, et al. Whole tumor histogram analysis using DW MRI in primary central nervous system lymphoma correlates with tumor biomarkers and outcome. Cancers. 2019;11(10). doi:10.3390/cancers11101506
15. Ali OM, Nalawade SS, Xi Y, et al. A Radiomic Machine Learning Model to Predict Treatment Response to Methotrexate and Survival Outcomes in Primary Central Nervous System Lymphoma (PCNSL). Blood. 2020;136(Supplement 1):29-30. doi:10.1182/blood-2020-141941
Figures
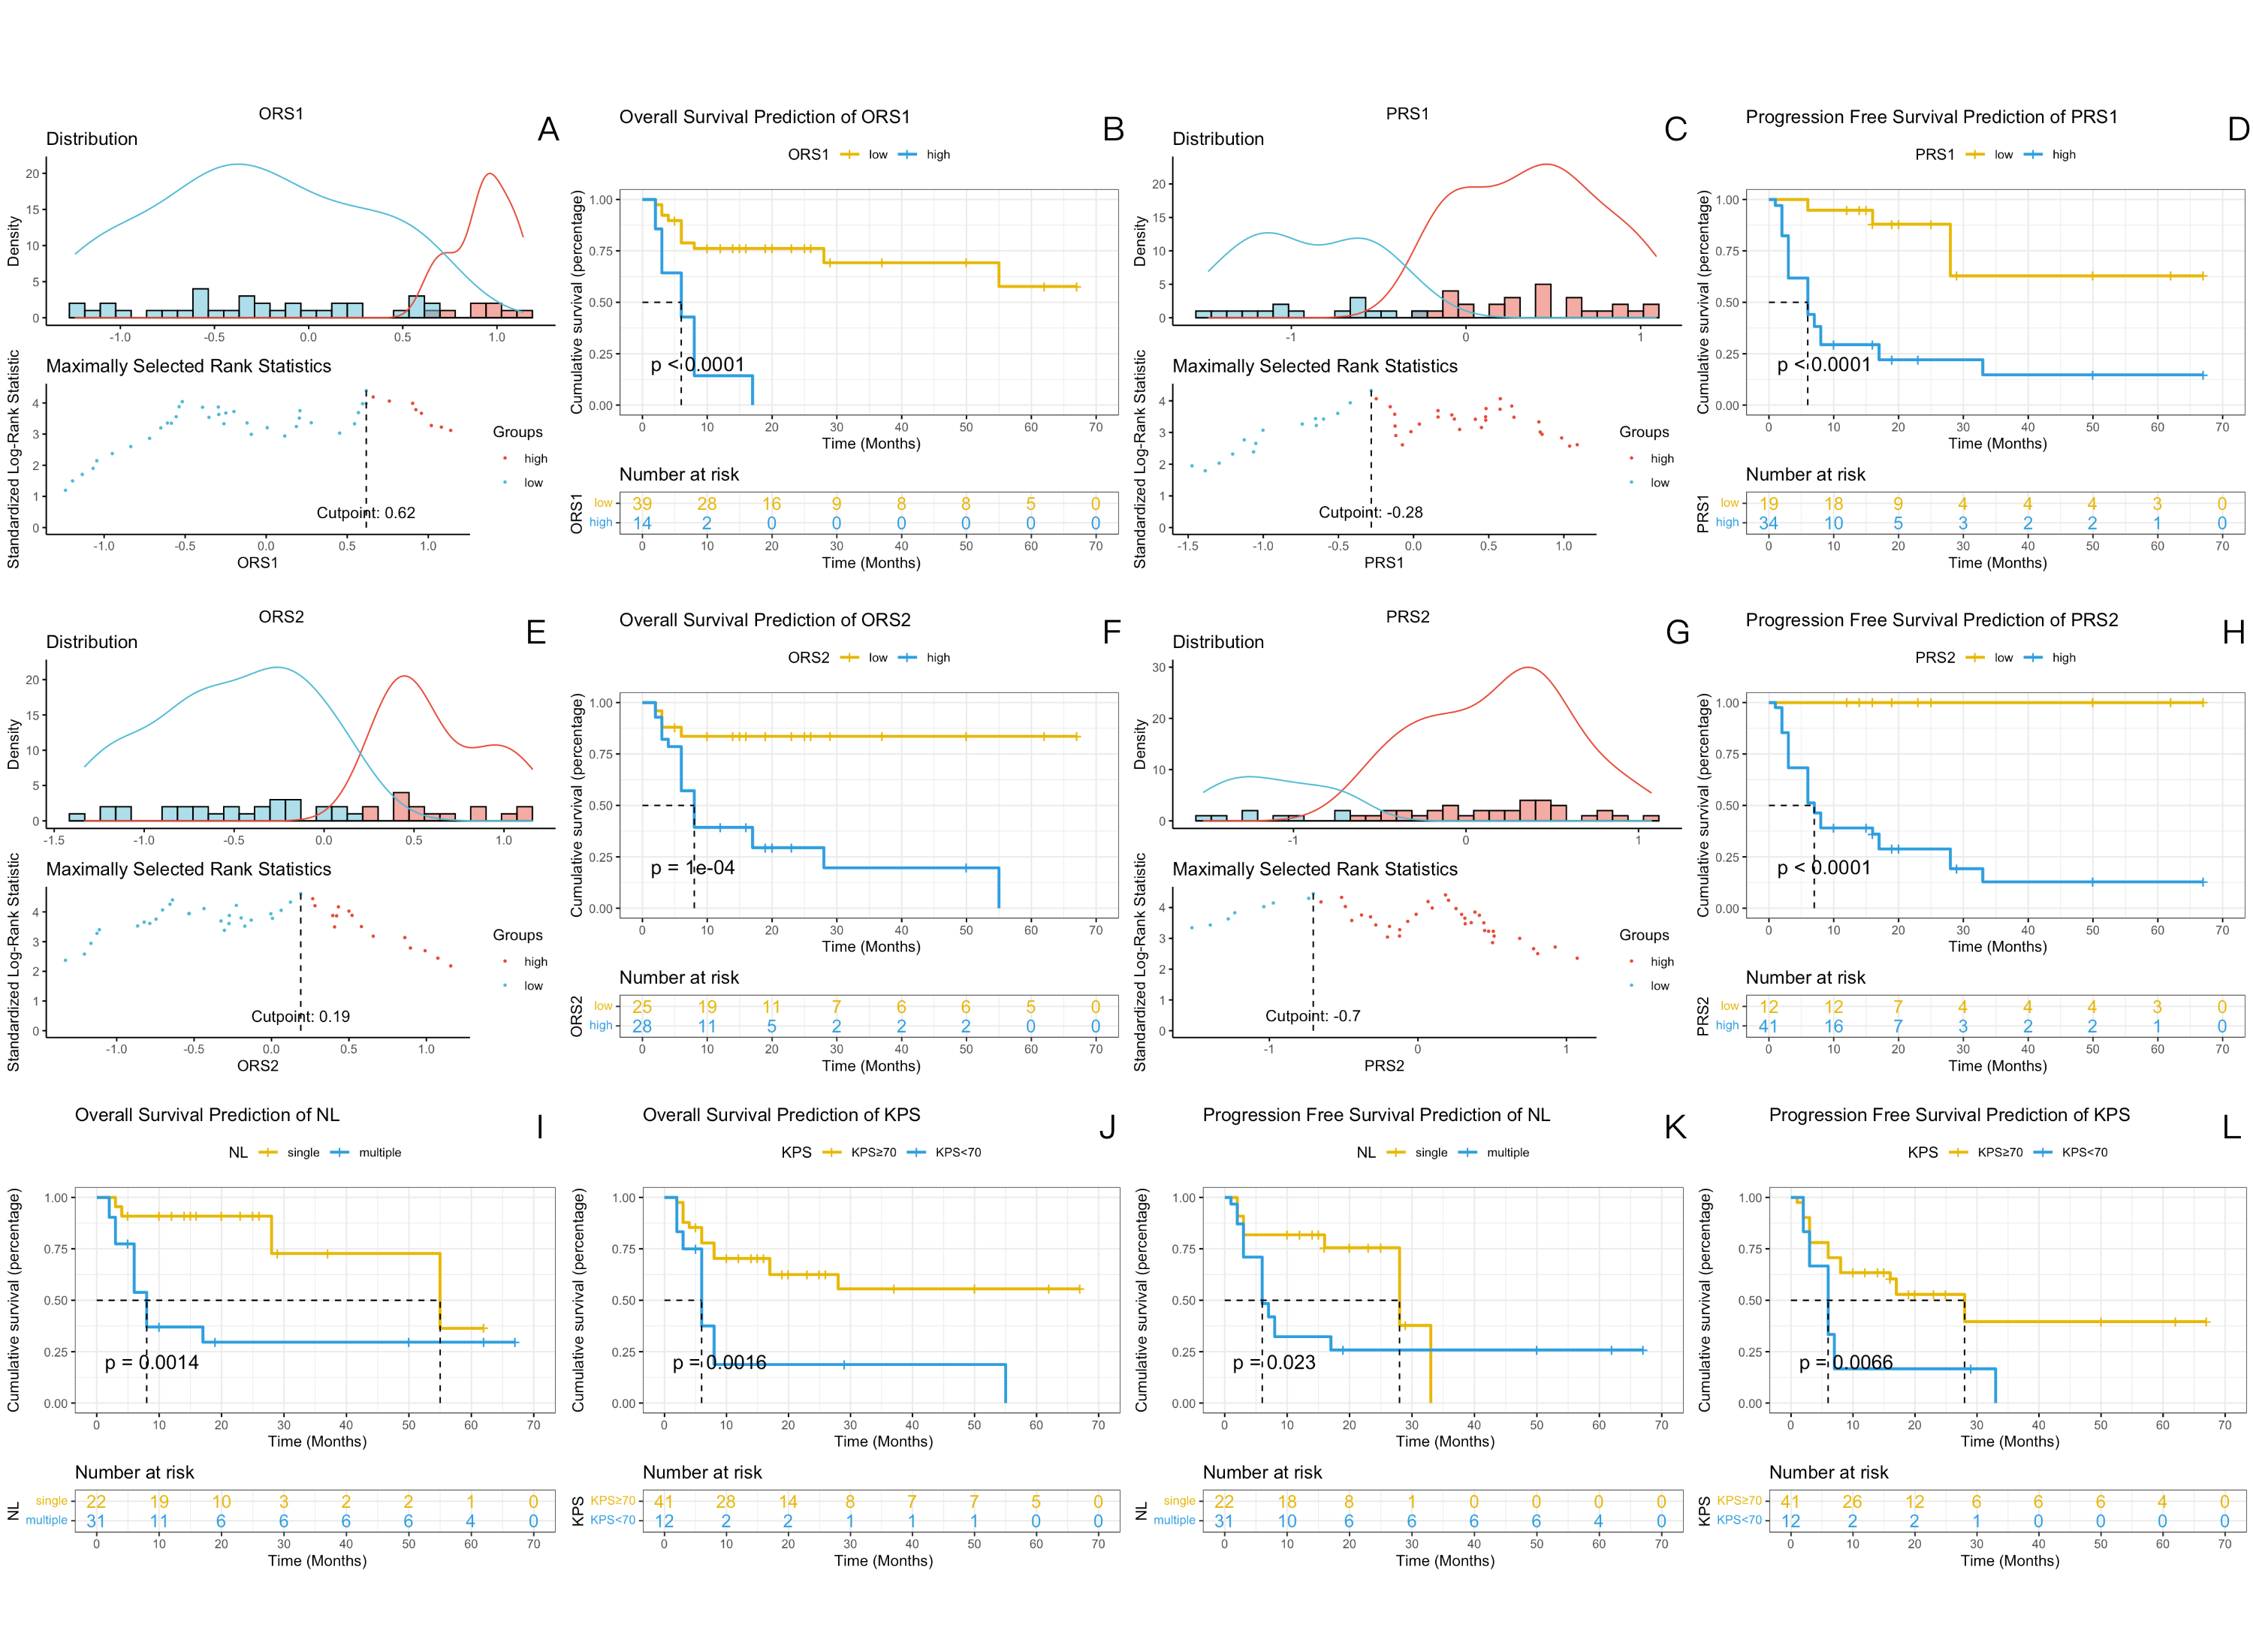
Figure 1. Kaplan-Meier analysis for OS and PFS prediction. (A), (C), (E) and (G) calculated the cutpiont. (B), (D), (E)and (H) were Kaplan-Meier curve of ORS and PRS. (I) - (L) were Kaplan-Meier curve of NL for OS and PFS. (p value from log-rank test).
Abbreviations: KPS, Karnofsky performance score; NL, number of lesions; ORS1 and PRS1, rad-score based on ADC map; ORS1 and PRS2, rad-score based on ASL s; OS, overall survival; PFS, Progression-free survival.
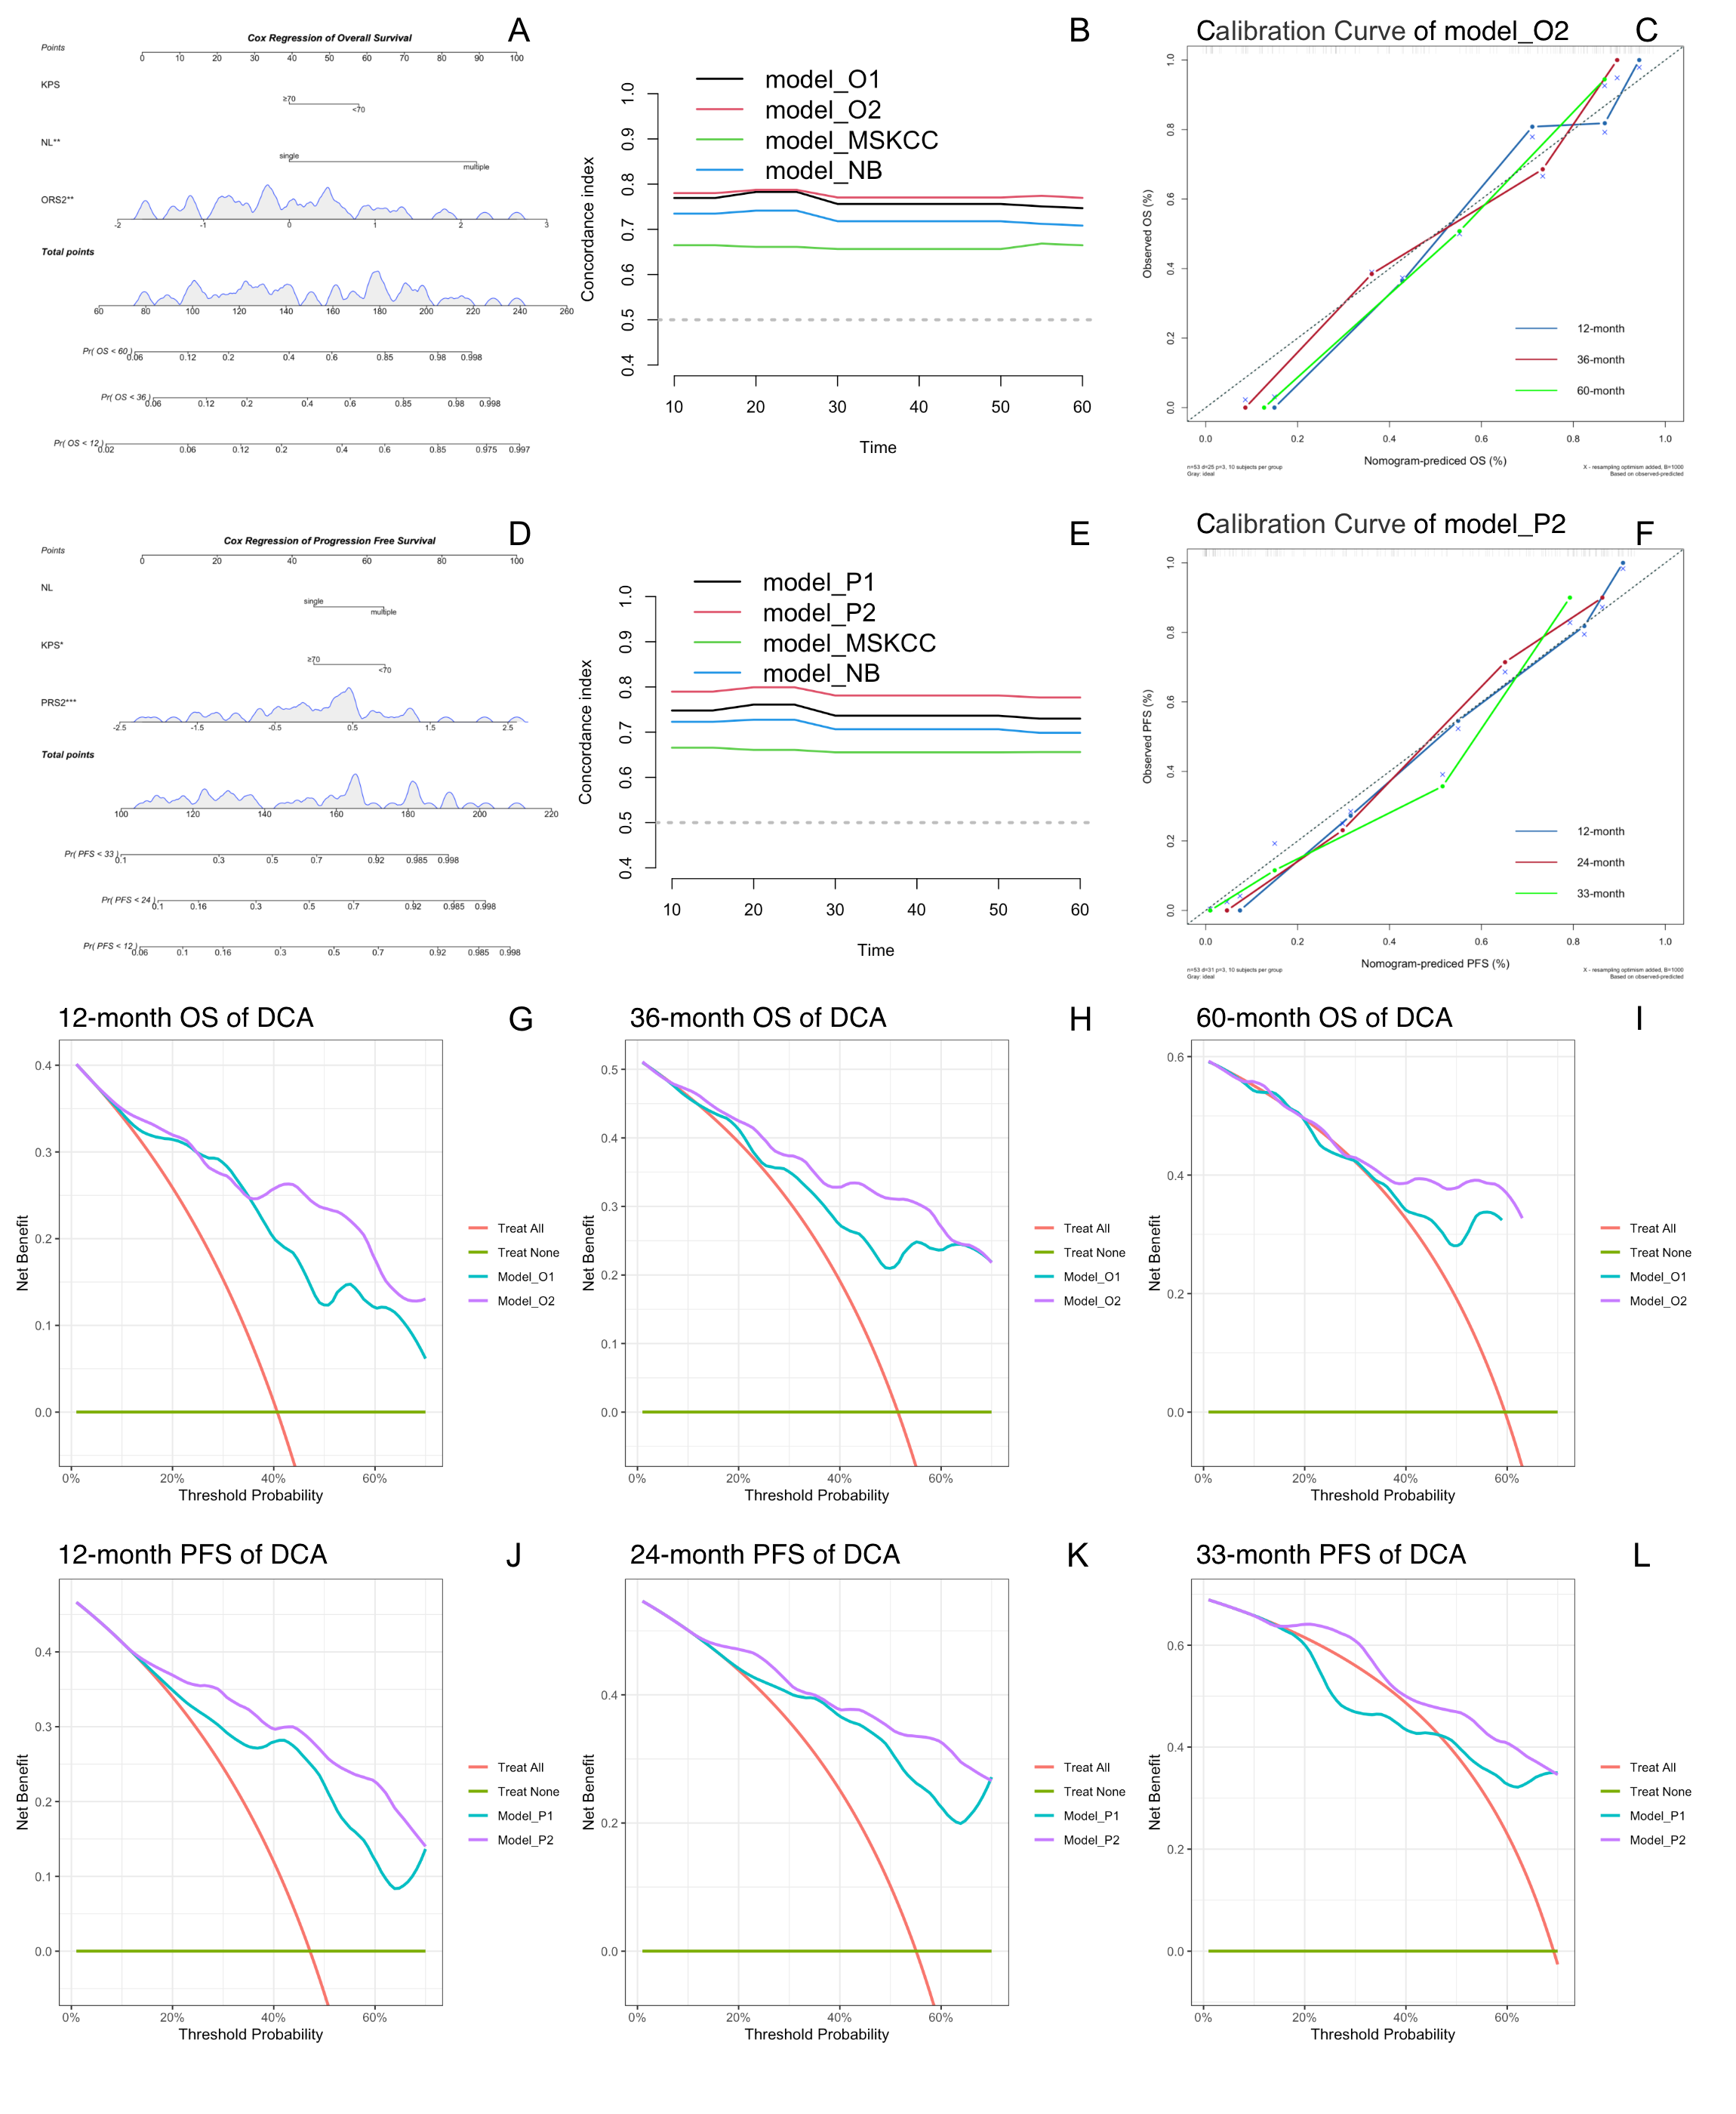
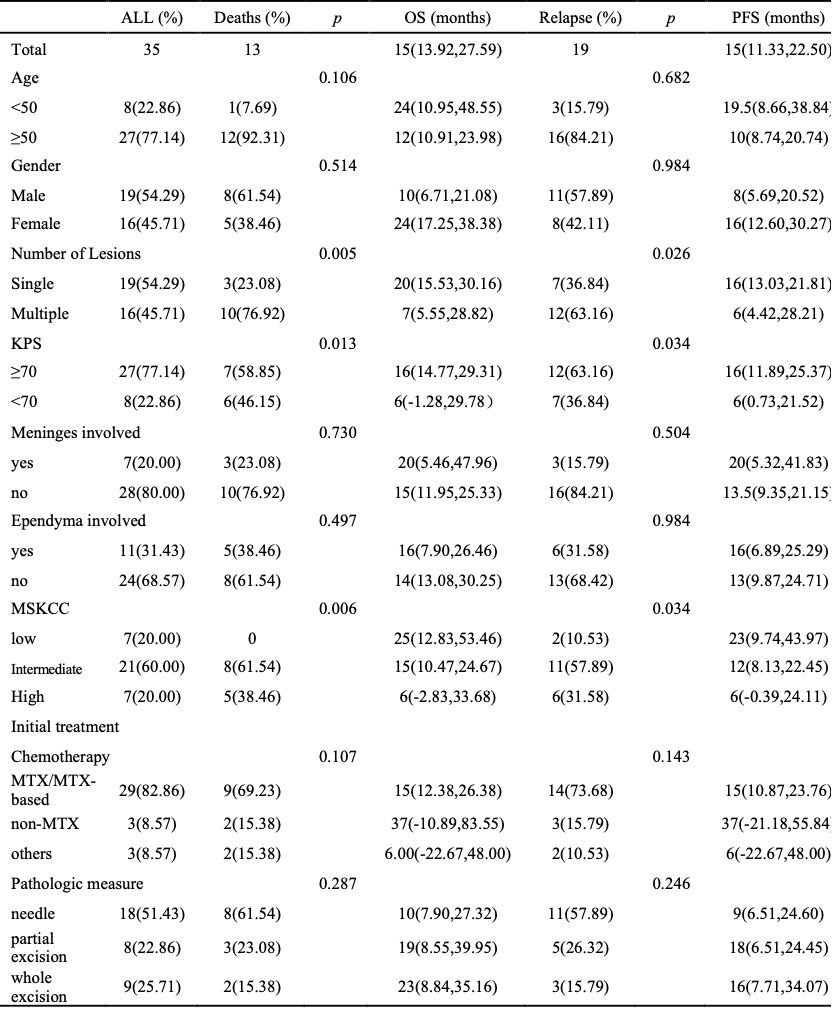
Table 1. Patients Clinical Data.
Note: Distribution death and progression status are reported as absolute counts (%). OS and PFS are reported as mean (95% confidence interval).
Abbreviations: KPS, Karnofsky performance score; MSKCC, Memorial Sloan-Kettering Cancer Center score; MTX, methotrexate; OS, overall survival; PFS, progression-free survival.
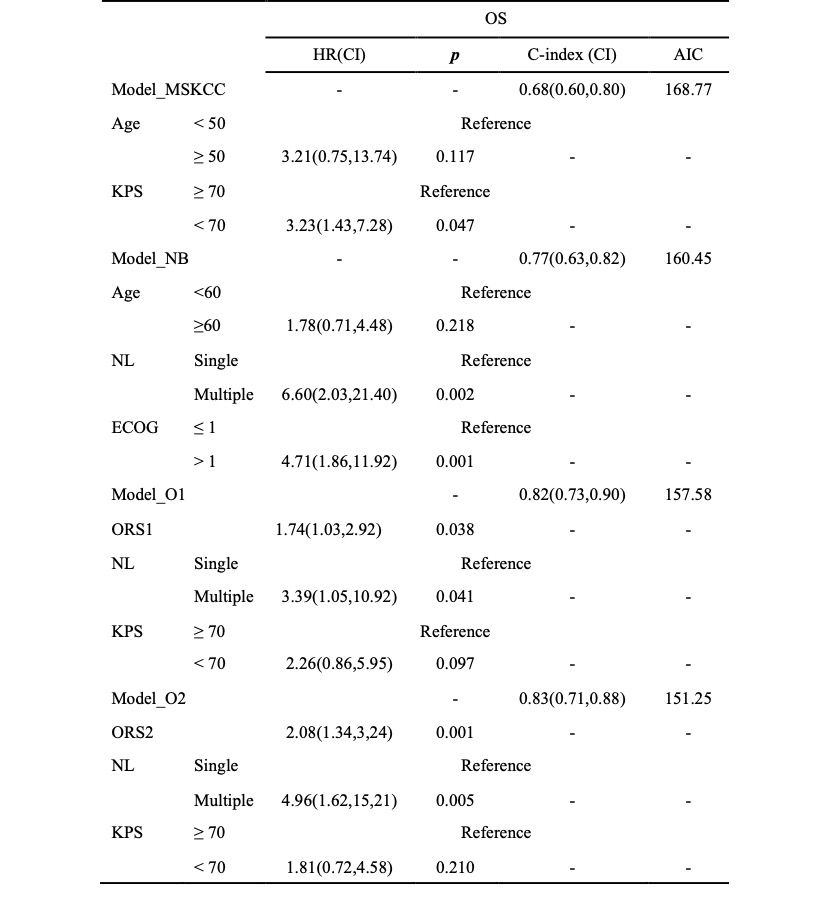
Table 2. Multivariable Cox regression models of OS prediction.
Abbreviations: AIC, Akaike information criterion; c-index, concordance index; CI, confidence interval; ECOG, Eastern Cooperative Oncology Group; HR, hazard ratio; KPS, Karnofsky performance score; MSKCC, Memorial Sloan-Kettering Cancer Center score; NB, Nottingham/Barcelona model; NL, number of lesions; ORS1, rad-score based on ADC map; ORS2, rad-score based on ASL; OS, overall survival.
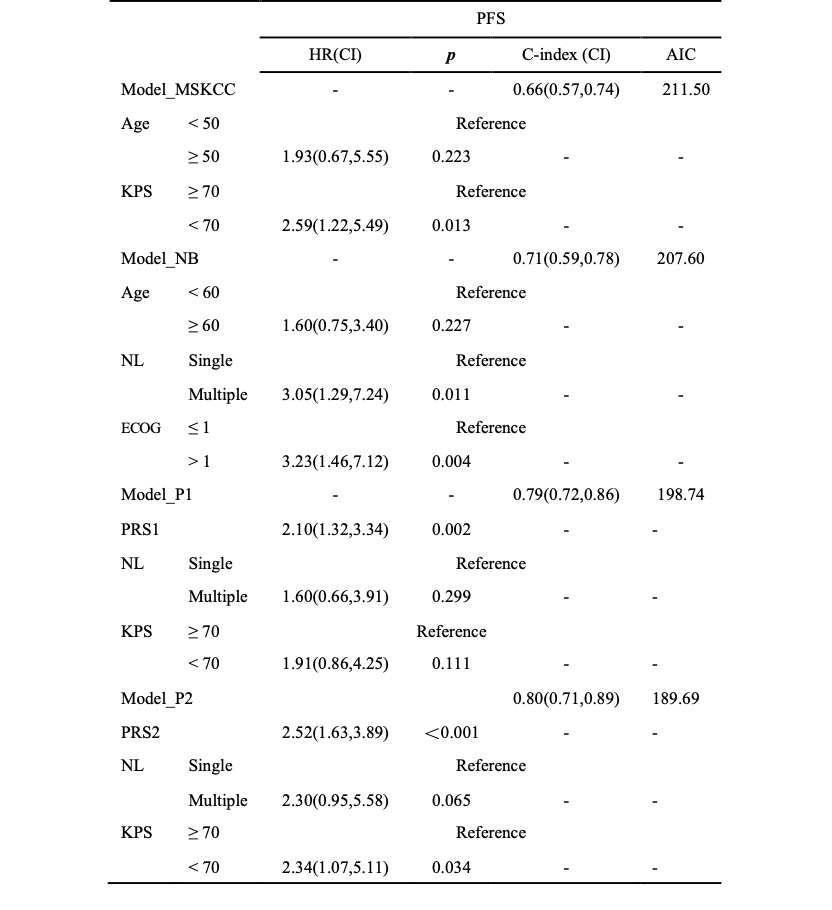
Table 3. Multivariable Cox regression models for PFS prediction.
Abbreviations: AIC, Akaike information criterion; c-index, concordance index; CI, confidence interval; ECOG, Eastern Cooperative Oncology Group; HR, hazard ratio; KPS, Karnofsky performance score; MSKCC, Memorial Sloan-Kettering Cancer Center score; NB, Nottingham/Barcelona model; NL, number of lesions; PFS, progression-free survival; PRS1, rad-score based on ADC map; PRS2, rad-score based on ASL.