1961
MRI histogram analysis of tumor-infiltrating CD8+ T cell levels in patients with glioblastoma1Lanzhou University Second Hospital, Lanzhou, China
Synopsis
Keywords: Tumors, Tumor
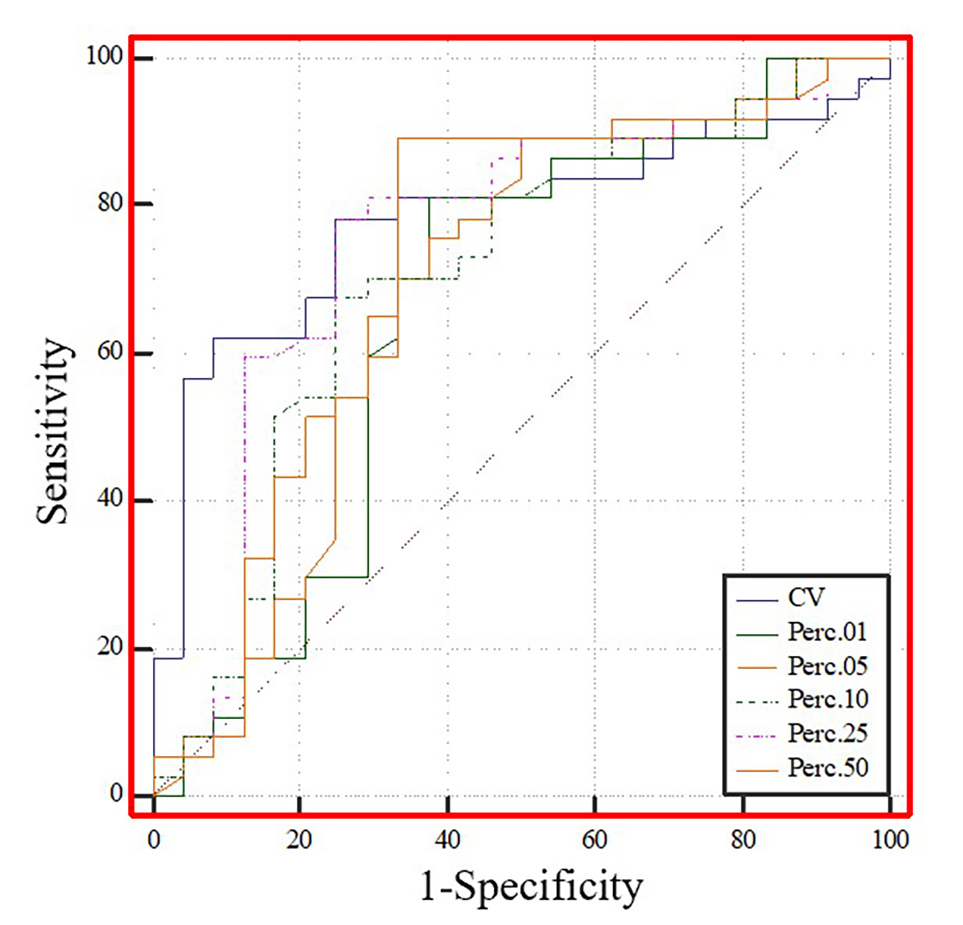
CD8+ T cell infiltration in tumors is a powerful predictor of the clinical and postoperative prognosis of GBM patients. Immunohistochemical staining was used to assess tumor-infiltrating CD8+ T cell expression in patient-derived tumor tissue samples. Histogram analysis of GBM was performed using Firevoxel software. Among the T1C histogram features, the CV, mean, 5th, 10th, 25th, and 50th percentiles were correlated with the levels of CD8+ T cells. The ROC curve analysis revealed that the CV had the highest AUC value (0.783). Histogram analysis is an efficient non-invasive imaging modality for the prediction of tumor-infiltrating CD8+ T cells in glioblastoma.Introduction
Glioblastoma (GBM) is the most common malignant brain tumor and has a median overall survival (OS) of 12–18 months. CD8+ lymphocytes limit tumor cell growth, inhibit tumor infiltration, and mediate tumor elimination. Therefore, CD8+ T cell infiltration in tumors is a powerful predictor of the clinical and postoperative prognosis of GBM patients. Therefore, preoperative assessment of tumor-infiltrating CD8+ T cells is necessary for informing the treatment strategies and prognosis of patients with GBM. Histogram analysis is a post-processing technique for measuring several parameters and it can better elucidate the tissue microstructure . We aimed to investigate the predictive utility of preoperative T1C histograms for the levels of tumor-infiltrating CD8+ T cells in patients with GBM.Methods
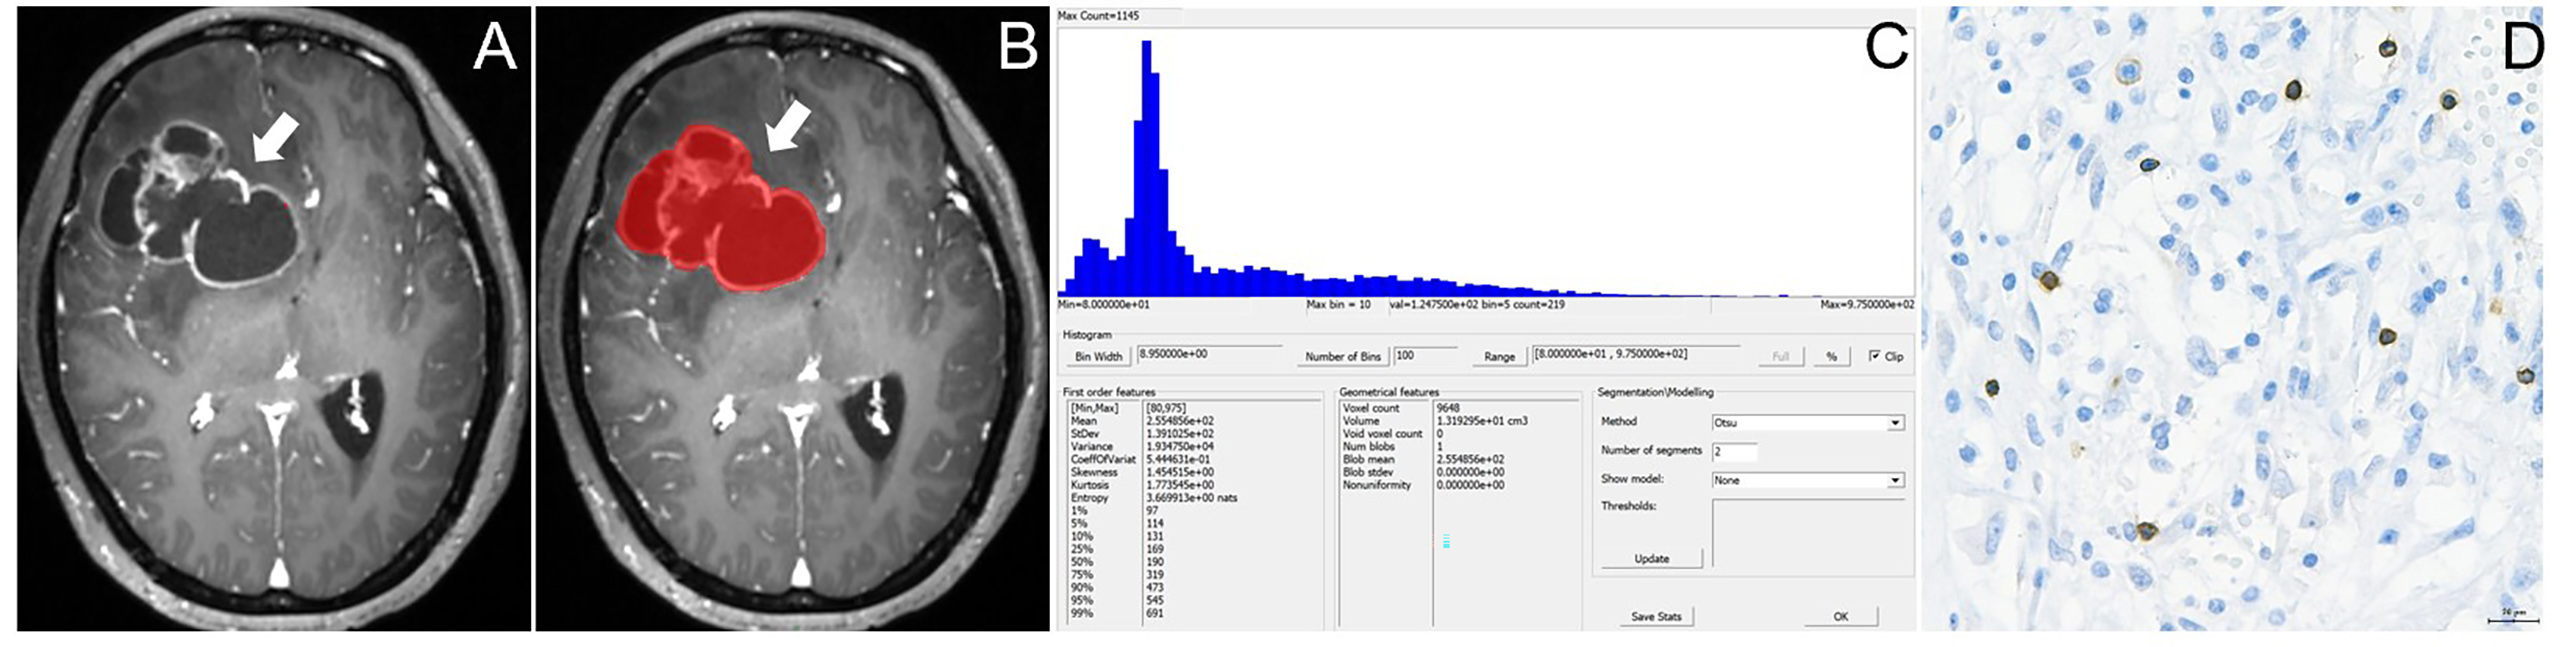
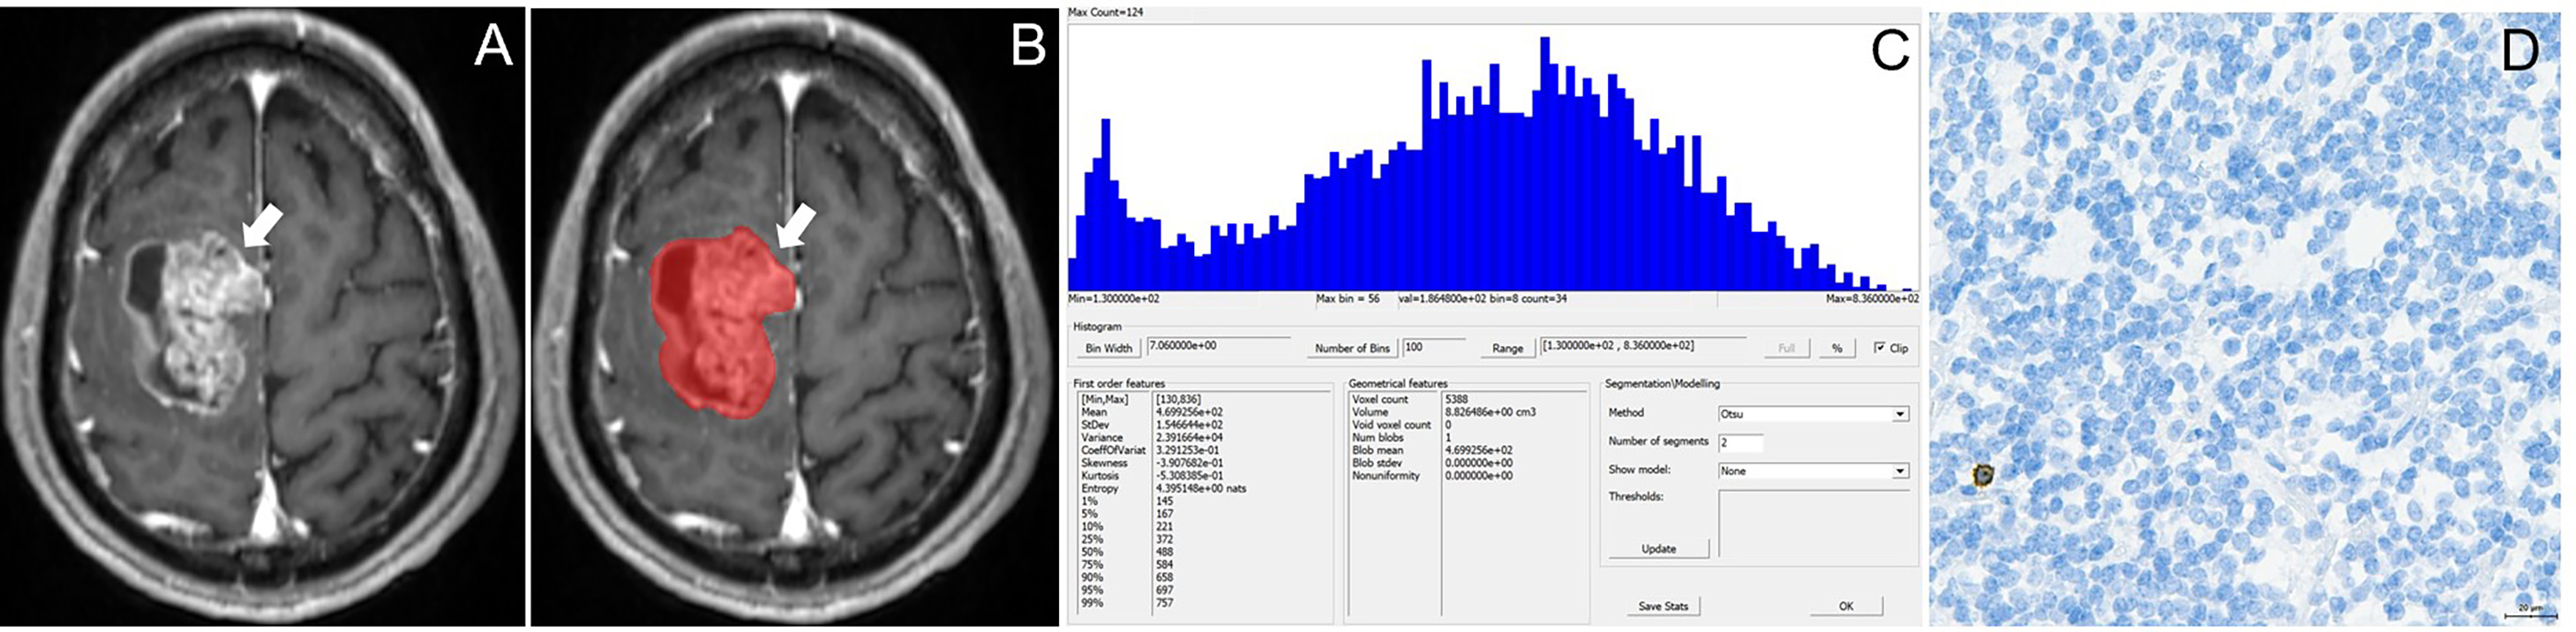
This retrospective study was approved by the local institutional review board, which waived the requirement for informed consent. We retrospectively analyzed the pathological and imaging data of 61 patients with GBM confirmed by surgery and pathology. Moreover, the levels of tumor-infiltrating CD8+ T cells in tumor tissue samples obtained from the patients were quantified through immunohistochemical staining and evaluated with respect to overall survival. The patients were divided into the high and low CD8 expression groups. Preoperative T1-weighted contrast-enhanced (T1C) histogram parameters of patients with GBM were extracted using Firevoxel software. We investigated the correlation between the histogram feature parameters and CD8+ T cells. We performed statistical analyses of the T1C histogram parameters in both groups and identified characteristic parameters with significant between-group differences. Additionally, we performed a receiver operating characteristic curve (ROC) analysis to determine the predictive utility of these parameters.Results
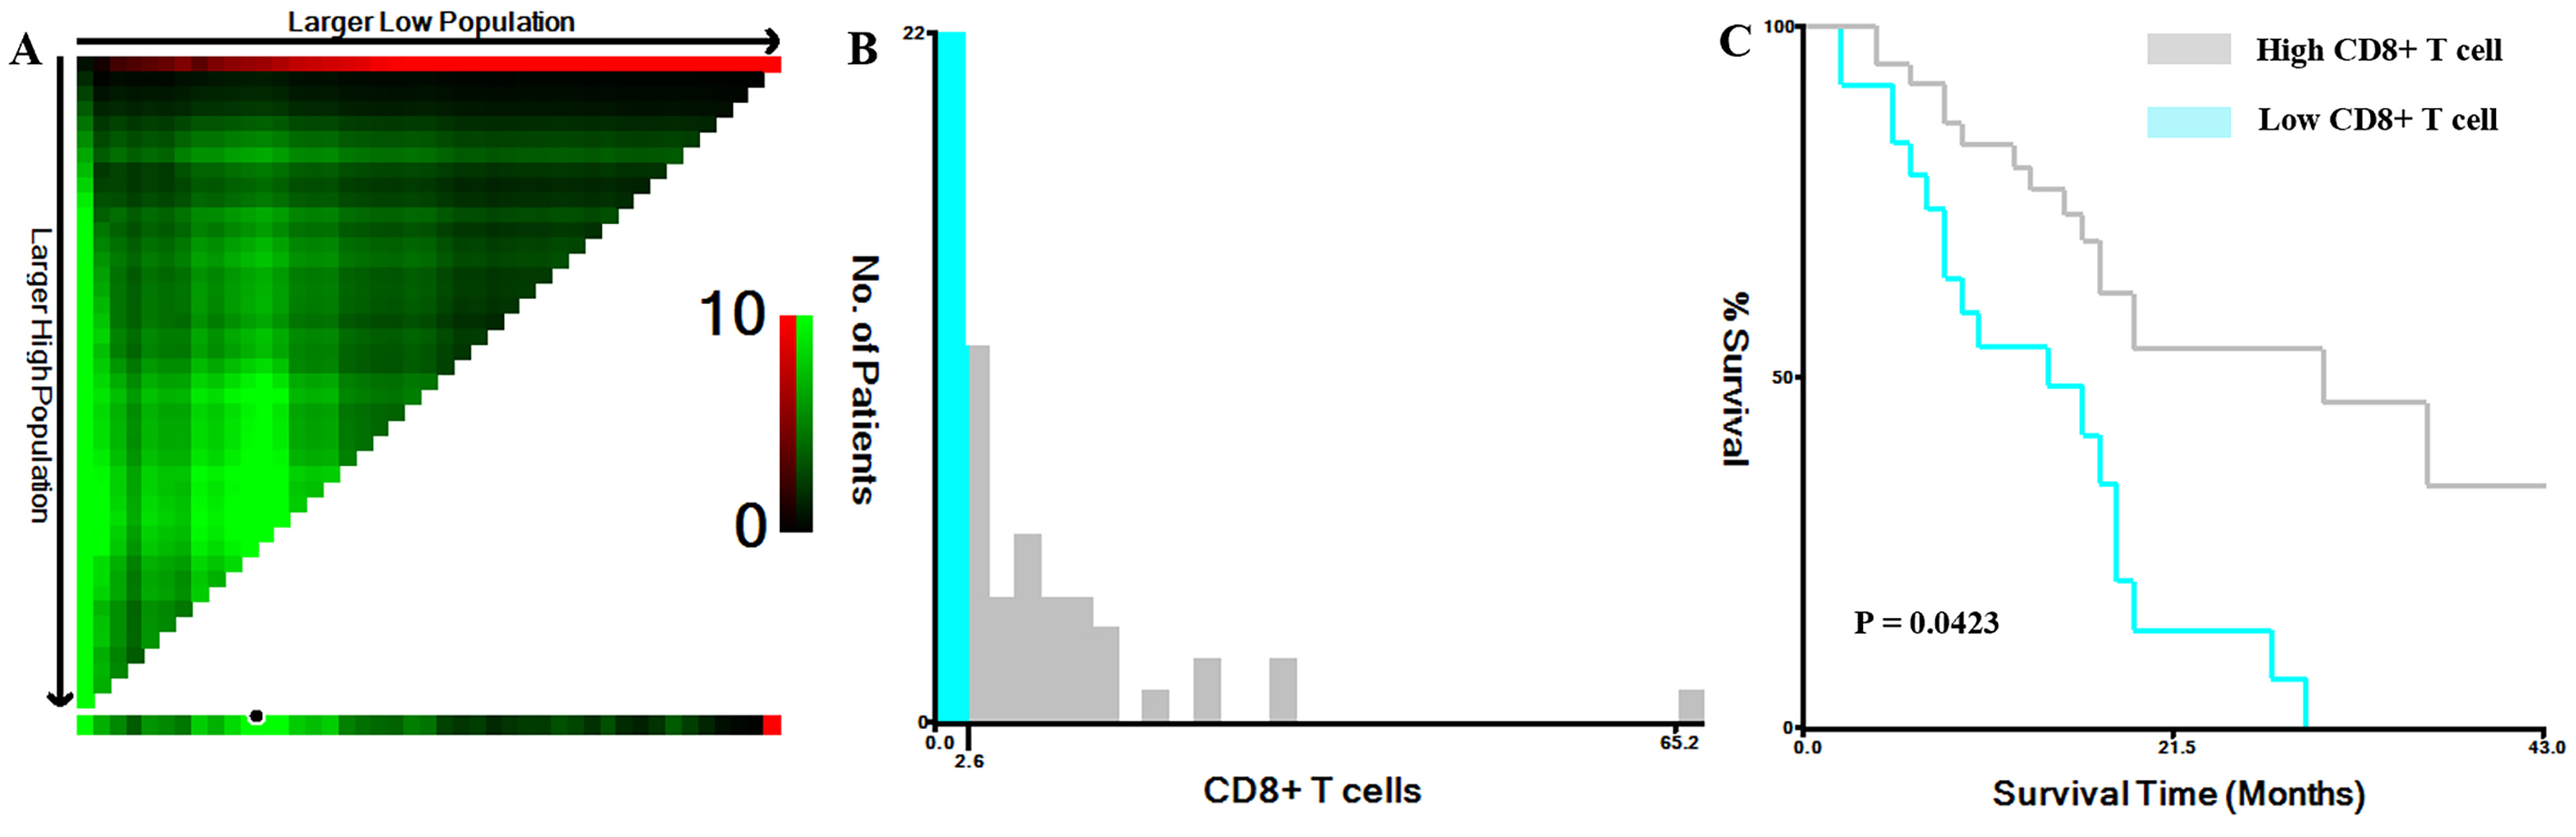
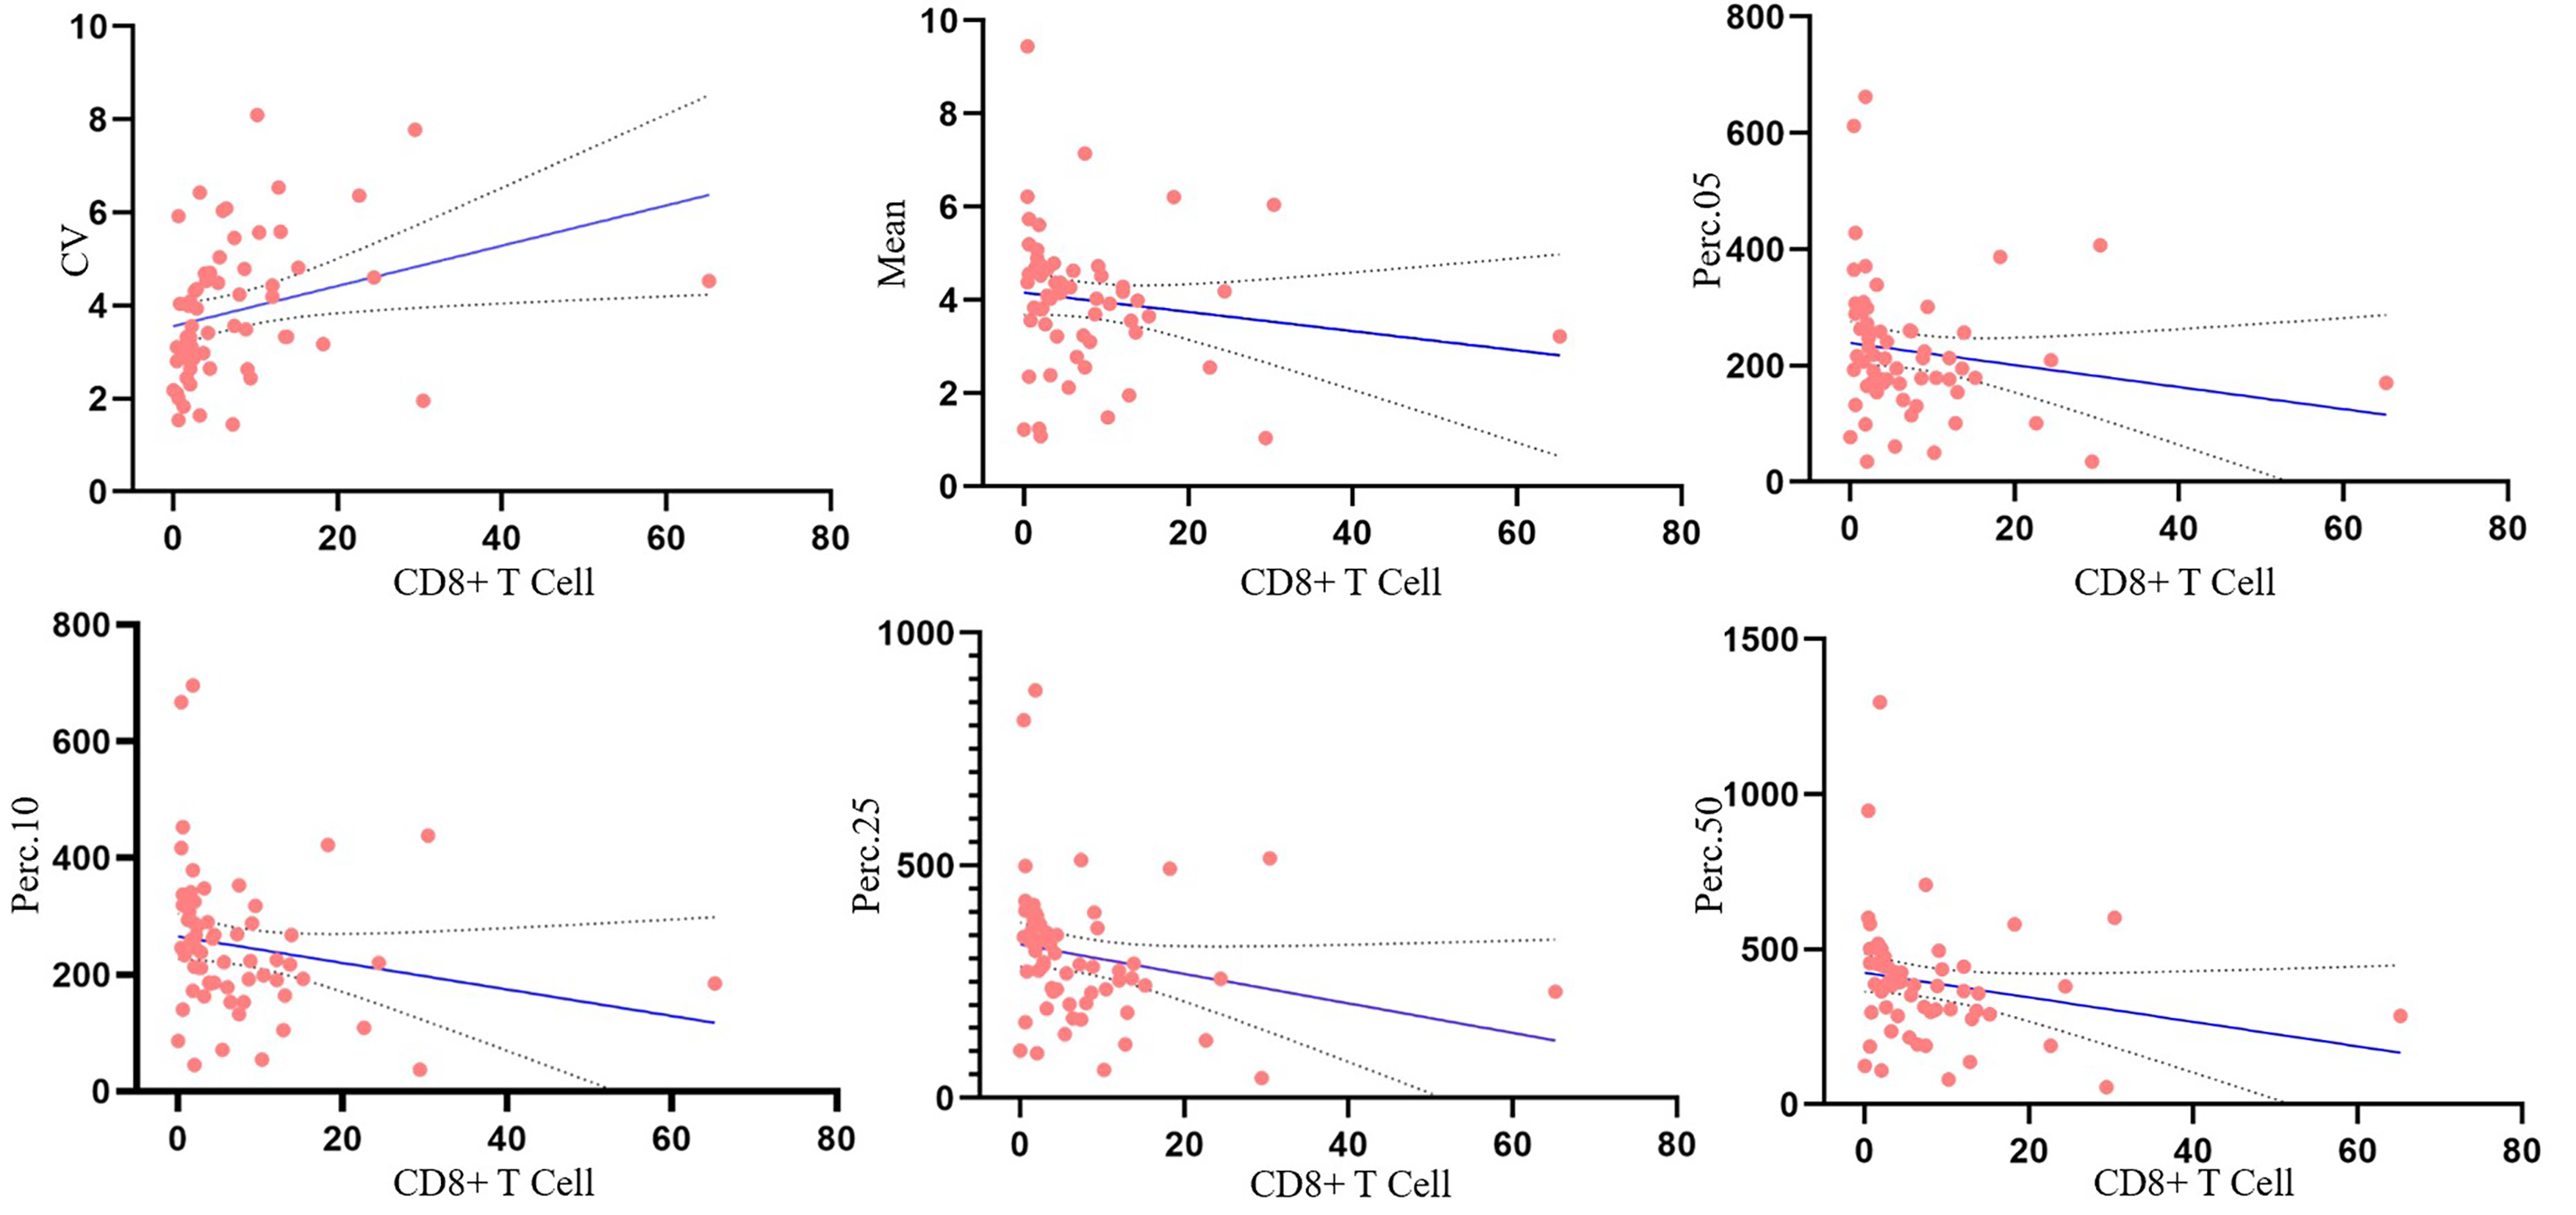
The levels of tumor-infiltrating CD8+ T cells were positively associated with overall survival in patients with GBM (P = 0.0156). Among the T1C histogram features, the mean, 5th, 10th, 25th, and 50th percentiles were negatively correlated with the levels of CD8+ T cells. Moreover, the coefficient of variation (CV) was positively correlated with the levels of CD8+ T cells (all P < 0.05). There was a significant between-group difference in the CV, 1st, 5th, 10th, 25th, and 50th percentiles (all p < 0.05). The ROC curve analysis revealed that the CV had the highest AUC value (0.783; 95% confidence interval: 0.658–0.878), with sensitivity and specificity values of 0.784 and 0.750, respectively, for distinguishing between the groups.Discussion
Percentile is the most widely used parameter in histogram analysis. In our study, there was a significant between-group difference in the 1st, 5th, 10th, 25th, and 50th percentiles; however, there was no significant between-group difference in the mean values. This indicates that the percentile can better reflect the internal lesion characteristics. The CV describes the degree of dispersion of the means of the characteristic values of the lesions. A larger CV indicates more deviation of the data from the mean value, and thus greater variability of the lesions. In our study, the CV values were significantly higher in the high CD8 expression group than in the low CD8 expression group, which indicates an uneven mean distribution of lesion characteristics in the CD8 group, and thus lesion variability. This could be attributed to the fact that high numbers of CD8 cells may facilitate increased elimination of tumor cells, which results in more within-tumor heterogeneity. Further studies are warranted to confirm this.Conclusions
CD8+ T cells are correlated with the prognosis of GBM patients. The preoperative T1C histogram is a reliable predictive tool for the levels of tumor-infiltrating CD8+ T cells in GBM; moreover, it can facilitate the preoperative prediction of the prognosis of patients with GBM.Acknowledgements
Thanks to all the partners who contributed to this research, including Caiqiang Xue, Junlin Zhou.References
1. Davis ME. Glioblastoma: Overview of Disease and Treatment. Clin J Oncol Nurs 2016;20(5 Suppl):S2-8.
2. Hagiwara A, Schlossman J, Shabani S, et al. Incidence, molecular characteristics, and imaging features of "clinically-defined pseudoprogression" in newly diagnosed glioblastoma treated with chemoradiation. Journal of neuro-oncology 2022.
3. Sun Q, Chen Y, Liang C, et al. Biologic Pathways Underlying Prognostic Radiomics Phenotypes from Paired MRI and RNA Sequencing in Glioblastoma. Radiology 2021;301(3):654-663.
4. Ren X, Zhang L, Zhang Y, Li Z, Siemers N, Zhang Z. Insights Gained from Single-Cell Analysis of Immune Cells in the Tumor Microenvironment. Annu Rev Immunol 2021;39:583-609.
5. Liu D, Chen J, Ge H, et al. Radiogenomics to characterize the immune-related prognostic signature associated with biological functions in glioblastoma. Eur Radiol 2022.
6. Zhou X, Qu M, Tebon P, et al. Screening Cancer Immunotherapy: When Engineering Approaches Meet Artificial Intelligence. Adv Sci (Weinh) 2020;7(19):2001447.
7. Ghouzlani A, Kandoussi S, Tall M, Reddy KP, Rafii S, Badou A. Immune Checkpoint Inhibitors in Human Glioma Microenvironment. Front Immunol 2021;12:679425.
8. Lakin N, Rulach R, Nowicki S, Kurian KM. Current Advances in Checkpoint Inhibitors: Lessons from Non-Central Nervous System Cancers and Potential for Glioblastoma. Front Oncol 2017;7:141.
9. Ugel S, Cane S, De Sanctis F, Bronte V. Monocytes in the Tumor Microenvironment. Annu Rev Pathol 2021;16:93-122.
10. Bian Y, Liu C, Li Q, et al. Preoperative Radiomics Approach to Evaluating Tumor-Infiltrating CD8(+) T Cells in Patients With Pancreatic Ductal Adenocarcinoma Using Noncontrast Magnetic Resonance Imaging. Journal of magnetic resonance imaging : JMRI 2022;55(3):803-814.
11. Apetoh L, Smyth MJ, Drake CG, et al. Consensus nomenclature for CD8(+) T cell phenotypes in cancer. Oncoimmunology 2015;4(4):e998538.
12. Teng MW, Ngiow SF, Ribas A, Smyth MJ. Classifying Cancers Based on T-cell Infiltration and PD-L1. Cancer Res 2015;75(11):2139-2145.
13. Bian Y, Liu YF, Jiang H, et al. Machine learning for MRI radiomics: a study predicting tumor-infiltrating lymphocytes in patients with pancreatic ductal adenocarcinoma. Abdom Radiol (NY) 2021;46(10):4800-4816.
14. Han S, Zhang C, Li Q, et al. Tumour-infiltrating CD4(+) and CD8(+) lymphocytes as predictors of clinical outcome in glioma. Br J Cancer 2014;110(10):2560-2568.
15. Yang I, Tihan T, Han SJ, et al. CD8+ T-cell infiltrate in newly diagnosed glioblastoma is associated with long-term survival. Journal of clinical neuroscience : official journal of the Neurosurgical Society of Australasia 2010;17(11):1381-1385.
16. Feng P, Li Y, Tian Z, Qian Y, Miao X, Zhang Y. Analysis of Gene Co-Expression Network to Identify the Role of CD8 + T Cell Infiltration-Related Biomarkers in High-Grade Glioma. Int J Gen Med 2022;15:1879-1890.
17. Xue C, Liu S, Deng J, et al. Apparent Diffusion Coefficient Histogram Analysis for the Preoperative Evaluation of Ki-67 Expression in Pituitary Macroadenoma. Clin Neuroradiol 2022;32(1):269-276.
18. Xu M, Tang Q, Li M, Liu Y, Li F. An analysis of Ki-67 expression in stage 1 invasive ductal breast carcinoma using apparent diffusion coefficient histograms. Quant Imaging Med Surg 2021;11(4):1518-1531.
19. Jiang L, Zhou L, Ai Z, et al. Machine Learning Based on Diffusion Kurtosis Imaging Histogram Parameters for Glioma Grading. J Clin Med 2022;11(9).
20. Gao A, Zhang H, Yan X, et al. Whole-Tumor Histogram Analysis of Multiple Diffusion Metrics for Glioma Genotyping. Radiology 2022;302(3):652-661.
21. Zhang HW, Lyu GW, He WJ, et al. Differential diagnosis of central lymphoma and high-grade glioma: dynamic contrast-enhanced histogram. Acta Radiol 2020;61(9):1221-1227.
22. Ulyte A, Katsaros VK, Liouta E, et al. Prognostic value of preoperative dynamic contrast-enhanced MRI perfusion parameters for high-grade glioma patients. Neuroradiology 2016;58(12):1197-1208. 23. Ansell SM. Hodgkin lymphoma: MOPP chemotherapy to PD-1 blockade and beyond. Am J Hematol 2016;91(1):109-112.
24.Tong H, Sun J, Fang J, et al. A Machine Learning Model Based on PET/CT Radiomics and Clinical Characteristics Predicts Tumor Immune Profiles in Non-Small Cell Lung Cancer: A Retrospective Multicohort Study. Front Immunol 2022;13:859323.
25. Just N. Improving tumour heterogeneity MRI assessment with histograms. Br J Cancer 2014;111(12):2205-2213.
26. Nelson DA, Tan TT, Rabson AB, Anderson D, Degenhardt K, White E. Hypoxia and defective apoptosis drive genomic instability and tumorigenesis. Genes Dev 2004;18(17):2095-2107.
27. Yildirim M, Baykara M. Differentiation of progressive disease from pseudoprogression using MRI histogram analysis in patients with treated glioblastoma. Acta Neurol Belg 2022;122(2):363-368.
28. Shi Z, Li J, Zhao M, et al. Quantitative Histogram Analysis on Intracranial Atherosclerotic Plaques: A High-Resolution Magnetic Resonance Imaging Study. Stroke 2020;51(7):2161-2169.
Figures