1959
A Subregion-based RadioFusionOmics Model Discriminates between Grade 4 Astrocytoma and Glioblastoma on Multisequence MRI1Department of Radiology, Guangzhou First People's Hospital, Guangzhou, China, 2Philips Healthcare, Guangzhou, China
Synopsis
Keywords: Tumors, Radiomics
Abstract
IntroductionAccording to the 2016 edition of the World Health Organization (WHO) classification criterion, gliomas can be grouped as per both histopathologic appearance and well-established molecular parameters. The malignant GBM is categorized as isocitrate dehydrogenase (IDH) mutant (IDHm) and IDH wildtype (IDHw) [1; 2]. These two IDH variants exhibit distinct biological characteristics and clinical prognosis. In this context, the 2021 WHO classification of tumors of the central nervous system, 5th edition (WHO CNS 5) highlights the IDH genotype in the setting for adult-type grade 4 glioma, IDHw gliomas and IDHm GBM were redefined as GBM and adult-type grade 4 astrocytoma respectively [3-5]. MRI-based radiographical examination is the most suitable option for non-invasive identification of IDH status, as it demonstrated excellent diagnostic capabilities for predicting IDH genotypes. However, most research has focused on lower-grade gliomas and their findings are thus possibly inapplicable to the 2021 WHO CNS 5 standard, albeit some studies showed promising performance [6-8]. Constructing radiomics models from conventional MRI sequences and using them for routine clinical use is an attractive alternative as it requires no sophisticated sequencing techniques. However, its effectiveness, as per WHO CNS 5 standards, needs to be validated.
Methods
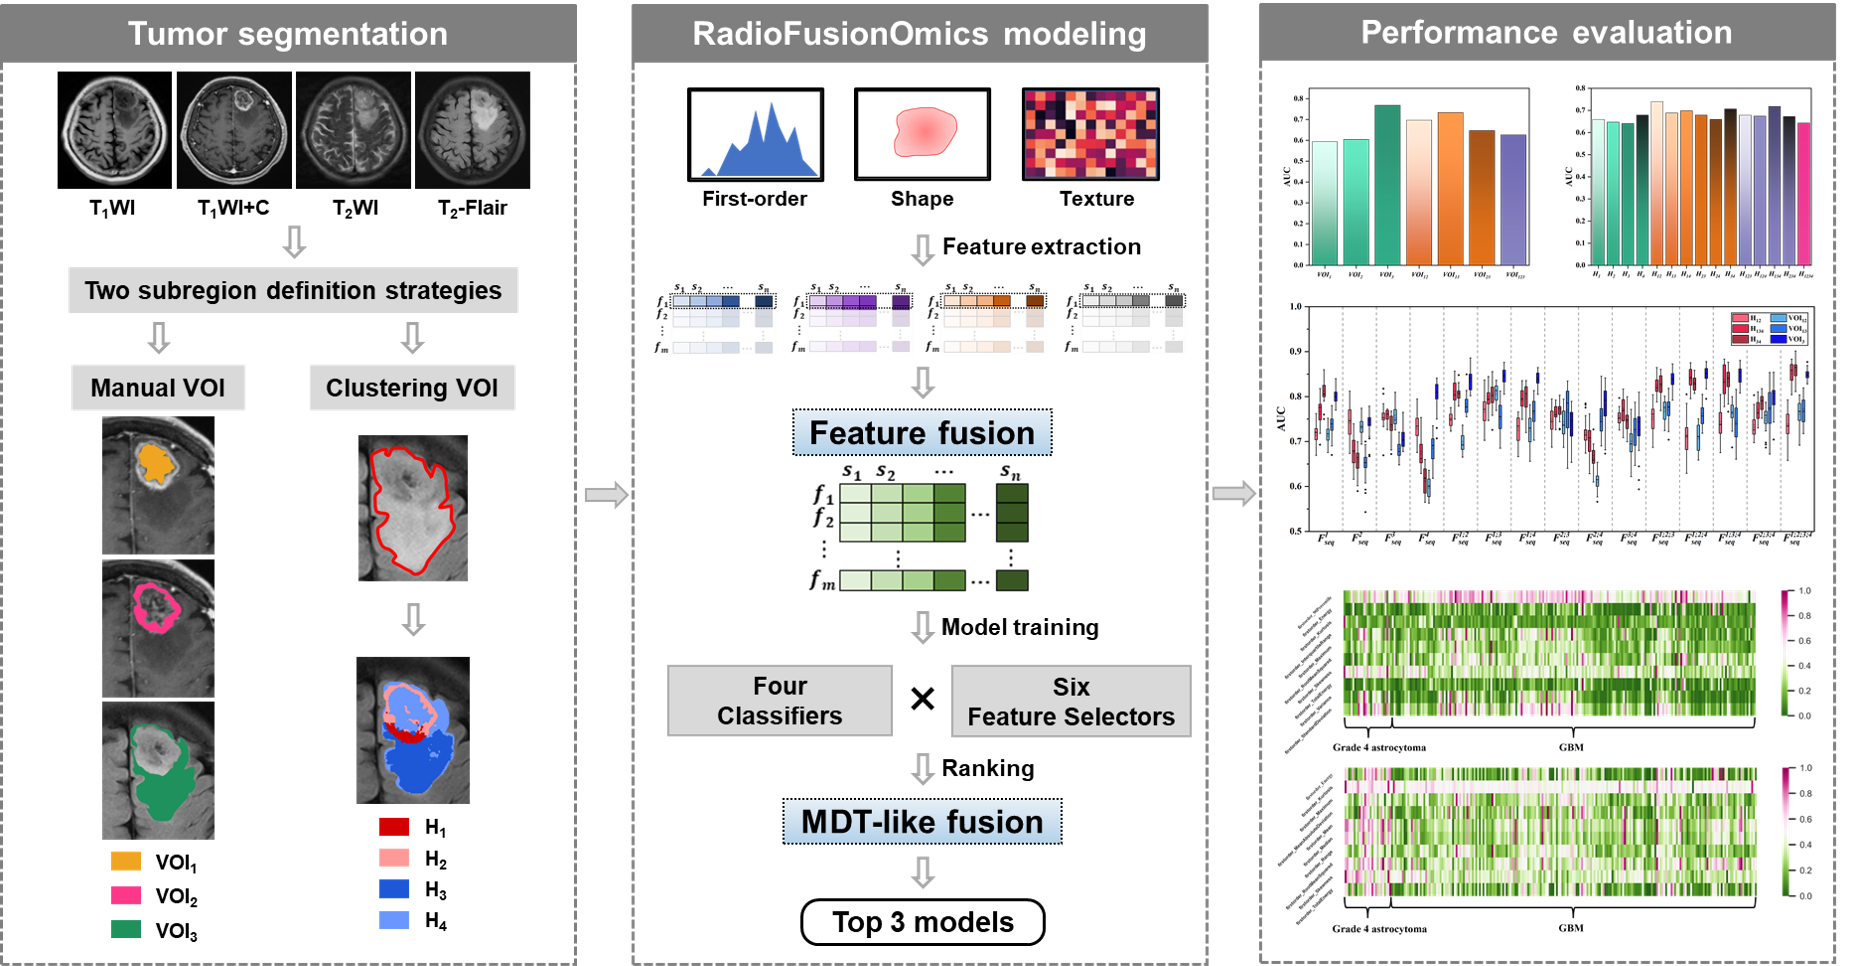
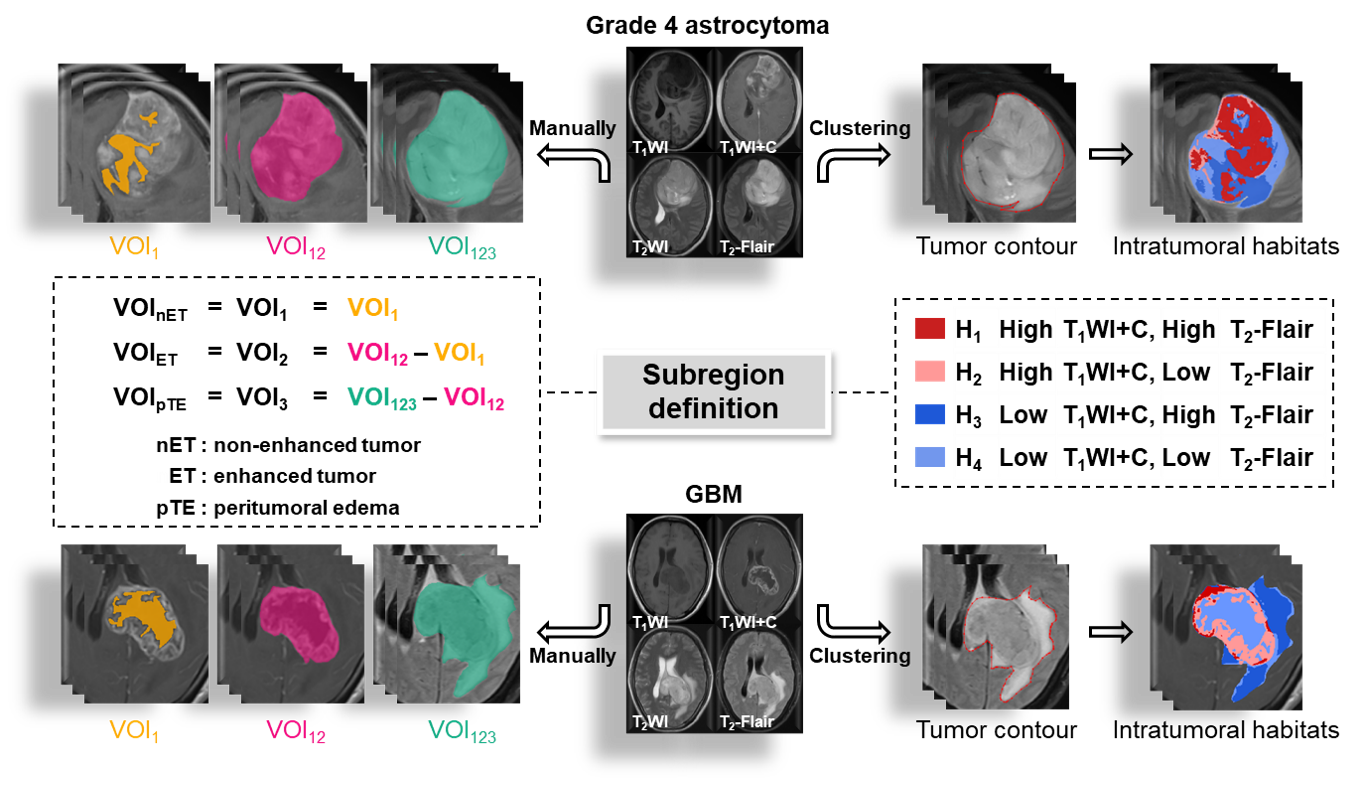
329 patients (40 grade 4 astrocytomas and 289 glioblastomas) with histologic diagnosis was retrospectively collected from our local institution and The Cancer Imaging Archive (TICA). The volumes of interests (VOIs) were obtained from four multiparametric MRI sequences (T1WI, T1WI+C, T2WI, T2-Flair) using 1) manual segmentation of the non-enhanced tumor (nET), enhanced tumor (ET), and peritumoral edema (pTE), and 2) K-means clustering of four subregions (H1, H2, H3 and H4). The optimal VOI and best MRI sequence combination were determined. The performance of the RFO model was evaluated using the area under the ROC curve (AUC) and the best signatures were identified.
Results
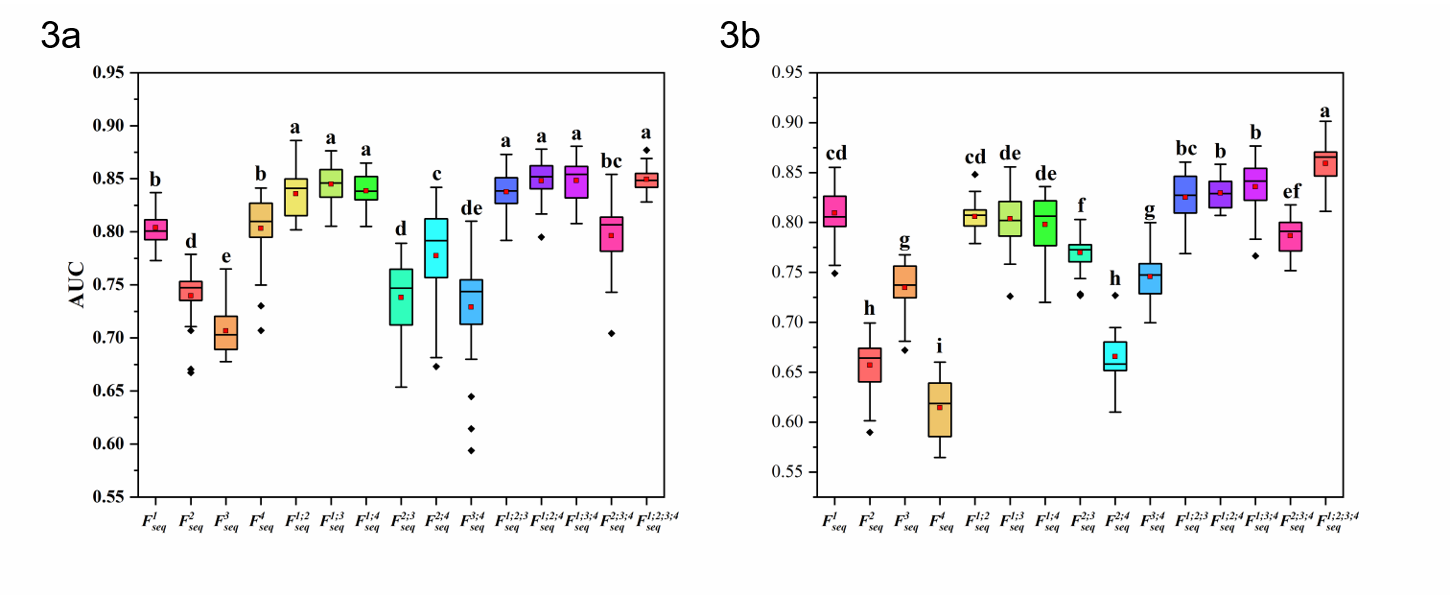
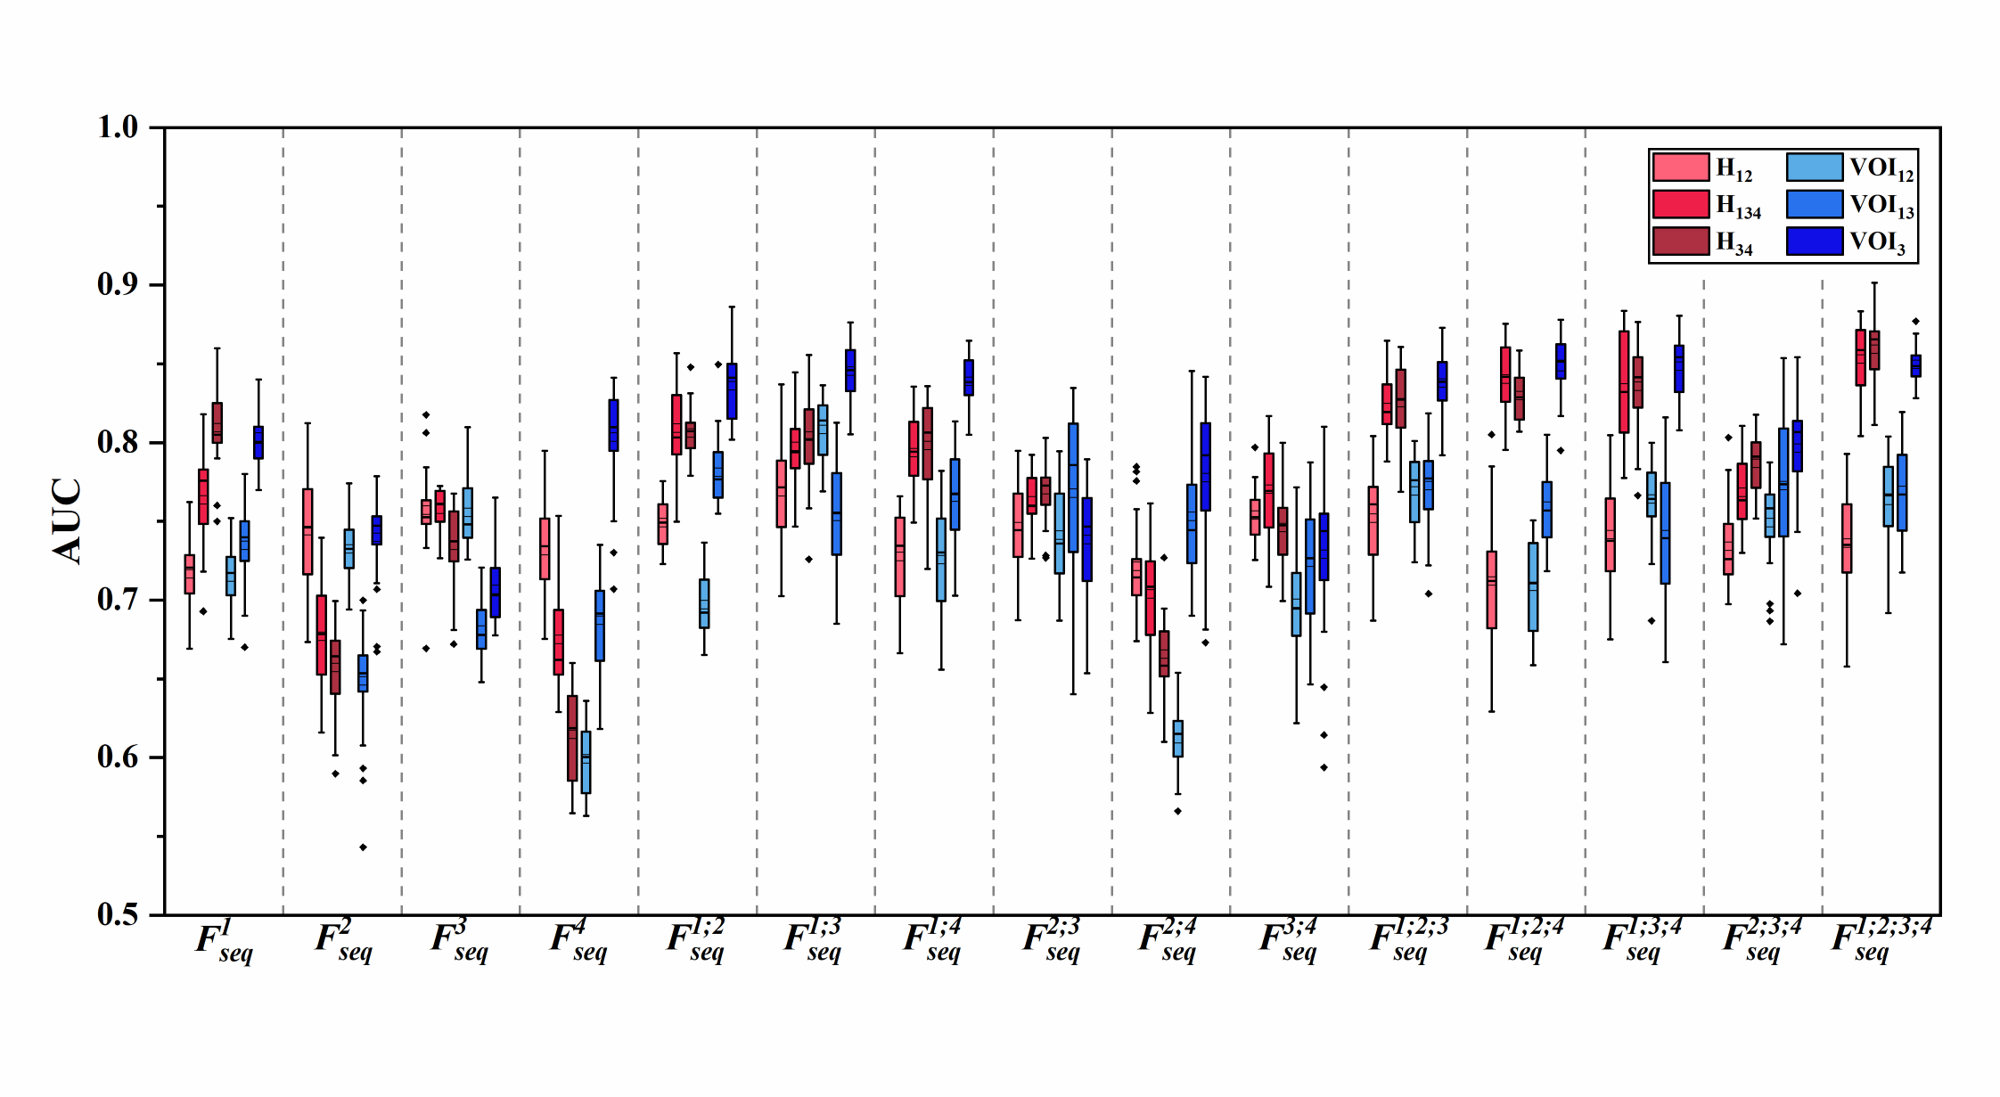
The two best VOIs were manual VOI3 (putative peritumoral edema) and clustering H34 (low T1WI+C, high T2-Flair (H3) combined with low T1WI+C and low T2-Flair (H4)). Features fused from four MRI sequences ( ) outperformed those from either a single sequence or other sequence combinations. The RFO model that was trained using fused features achieved the AUC of 0.868 (VOI3) and 0.884 (H34) in the primary cohort (p=0.059), and 0.824 (VOI3) and 0.838 (H34) in the testing cohort (p=0.023).
Discussion
Subregion identification is a critical step in defining anatomically (or radiographically) meaningful localized zones for characterization of a glioma lesion [9; 10]. Various segmentation methodologies often yield subregions that have distinct physical meanings. For example, manual identification is performed by radiologists with the assumption that MRI signal characteristics correlate with specific anatomical regions/tissues — enhancement on T1WI+C is typically considered a tumor entity and central non-enhancing hypointense signal represents necrosis. Nevertheless, global signal trends (e.g., enhancing, non-enhancing) usually define relatively large anatomical zones, and might not necessarily reflect morphological/pathological complexities within a much smaller scale (e.g., pixel-level). This hypothesis was supported by emerging evidence that high tumor cellularity is detected in both enhancing and non-enhancing regions of the GBM [11]. The clustering algorithm has been used to characterize subregions —so-called “habitats”— that were pertinent to distinct subpopulations harboring divergent biological behaviors, which had therapeutic and prognostic implications [12-14]. In this study, we compared the two aforementioned subregion definition strategies and the best performance was seen in clustering subregion H34 with all four sequences T1WI, T2WI, T2-Flair and T1WI+C fused in the RFO model. This suggests that voxel-based clustering subregions might also define heterogeneity-related intratumoral territories when reliable radiomics signatures are extracted.
Conclusion
The performance of subregions defined by clustering was comparable to that of subregions that were manually defined. Fusion of features from the edematous subregions of multiple MRI sequences by the RFO model resulted in differentiation between grade 4 astrocytoma and glioblastoma.
Acknowledgements
This study was funded by the National Natural Science Foundation of China (81874216, 81971574), the Natural Science Foundation of Guangdong Province (2021A1515011350, 2022A1515011410), the Guangdong Basic and Applied Basic Research Foundation (2021A1515220060), the Science and Technology Project of Guangzhou (201904010422, 202102010025), the Special Fund for the Construction of High-level Key Clinical Specialty (Medical Imaging) in Guangzhou, Guangzhou Key Laboratory of Molecular Imaging and Clinical Translational Medicine (202201020376).References
1 Aldape K, Zadeh G, Mansouri S, Reifenberger G, von Deimling A (2015) Glioblastoma: pathology, molecular mechanisms and markers. Acta Neuropathologica 129:829-848
2 Chen R, Smith-Cohn M, Cohen AL, Colman H (2017) Glioma Subclassifications and Their Clinical Significance. Neurotherapeutics 14:284-297
3 Louis DN, Perry A, Wesseling P et al (2021) The 2021 WHO Classification of Tumors of the Central Nervous System: a summary. Neuro Oncol 23:1231-1251
4 Wen PY, Packer RJ (2021) The 2021 WHO Classification of Tumors of the Central Nervous System: clinical implications. Neuro Oncol 23:1215-1217
5 Gritsch S, Batchelor TT, Gonzalez CL (2022) Diagnostic, therapeutic, and prognostic implications of the 2021 World Health Organization classification of tumors of the central nervous system. Cancer 128:47-58
6 Yu J, Shi Z, Lian Y et al (2017) Noninvasive IDH1 mutation estimation based on a quantitative radiomics approach for grade II glioma. European Radiology 27:3509-3522
7 Suh CH, Kim HS, Jung SC, Choi CG, Kim SJ (2019) Imaging prediction of isocitrate dehydrogenase (IDH) mutation in patients with glioma: a systemic review and meta-analysis. European Radiology 29:745-758
8 Chang K, Bai HX, Zhou H et al (2018) Residual Convolutional Neural Network for the Determination of IDH Status in Low- and High-Grade Gliomas from MR Imaging. Clinical Cancer Research 24:1073-1081
9 Figini M, Riva M, Graham M et al (2018) Prediction of Isocitrate Dehydrogenase Genotype in Brain Gliomas with MRI: Single-Shell versus Multishell Diffusion Models. Radiology 289:788-796
10 Ye Z, Price RL, Liu X et al (2020) Diffusion Histology Imaging Combining Diffusion Basis Spectrum Imaging (DBSI) and Machine Learning Improves Detection and Classification of Glioblastoma Pathology. Clinical Cancer Research 26:5388-5399
11 O'Connor JPB, Rose CJ, Waterton JC, Carano RAD, Parker GJM, Jackson A (2015) Imaging Intratumor Heterogeneity: Role in Therapy Response, Resistance, and Clinical Outcome. Clinical Cancer Research 21:249-257
12 Cui Y, Tha KK, Terasaka S et al (2016) Prognostic Imaging Biomarkers in Glioblastoma: Development and Independent Validation on the Basis of Multiregion and Quantitative Analysis of MR Images. Radiology 278:546-553
13 Zhang B, Song L, Yin J (2021) Texture Analysis of DCE-MRI Intratumoral Subregions to Identify Benign and Malignant Breast Tumors. Frontiers in Oncology 11:688182
14 Fan Y, Dong Y, Yang H et al (2021) Subregional radiomics analysis for the detection of the EGFR mutation on thoracic spinal metastases from lung cancer. Physics in medicine & biology 66:215008Figures